
Data gathering
7.1 Introduction
7.2 Four key issues
7.3 Data recording
7.4 Interviews
7.5 Questionnaires
7.6 Observation
7.7 Choosing and combining techniques
7.1 Introduction
This chapter presents some techniques for data gathering which are commonly used in interaction design activities. In particular, data gathering is a central part of identifying needs and establishing requirements, and of evaluation.
Within the requirements activity, the purpose of data gathering is to collect sufficient, accurate, and relevant data so that a set of stable requirements can be produced. Within evaluation, data gathering is needed in order to capture users' reactions and performance with a system or prototype.
In this chapter we introduce three main techniques for gathering data. (Some additional techniques relevant only to evaluation are discussed in Chapters 12–15.) In the next chapter we discuss how to analyze and interpret the data collected. These three techniques are interviews, questionnaires, and observation. Interviews involve an interviewer asking one or more interviewees a set of questions which may be highly structured or unstructured; interviews are usually synchronous and are often face-to-face, but they don't have to be. Questionnaires are a series of questions designed to be answered asynchronously, i.e. without the presence of the investigator; these may be on paper, or online. Observation may be direct or indirect. Direct observation involves spending time with individuals observing activity as it happens. Indirect observation involves making a record of the user's activity as it happens to be studied at a later date. All three techniques may be used to collect qualitative or quantitative data.
Although this is a small set of basic techniques, they are flexible and can be combined and extended in many ways. Indeed it is important not to focus on just one data gathering technique but to use them flexibly and in combination so as to avoid biases which are inherent in any one approach.
The way in which each technique is used varies depending on the interaction design activity being undertaken. More detailed descriptions of how the different techniques are used within specific activities of the lifecycle are given in later chapters (Chapter 10 for requirements, and Chapters 12–15 for evaluation). Here we give some basic practical information about each technique.
The main aims of the chapter are to:
- Discuss how to plan and run a successful data gathering program.
- Enable you to plan and run an interview.
- Enable you to design a simple questionnaire.
- Enable you to plan and execute an observation.
7.2 Four Key Issues
Data gathering sessions need to be planned and executed carefully. Specific issues relating to the three data gathering techniques are discussed in the following sections, but first we consider four key issues that require attention for a data gathering session to be successful. These four issues are goal setting, the relationship between the data collector and the data provider, triangulation, and pilot studies.
7.2.1 Setting Goals
The main reason for gathering data at all is to glean information about something. For example, you might want to understand how technology fits into normal family life, or you might want to identify which of two icons representing a ‘send email’ action is easier to use, or you might want to find out whether the redesign you are planning for a hand-held meter reader is along the right lines. There are many different reasons for gathering data, and before beginning it is important to identify specific goals for the particular study. The goals that are set will influence the nature of the data gathering sessions, the data gathering techniques to be used, and also the analysis to be performed. Once the goals have been set, then you can concentrate on what data to look for and what to do with it once it is gathered.
The goals may be expressed more or less formally, e.g. using some structured or even mathematical format, or using a simple description such as the ones in the previous paragraph, but whatever the format they should be clear and concise. In interaction design it is more usual to express the goals of data gathering more informally.
7.2.2 The Relationship with Participants
One significant aspect of any data gathering is the relationship between the person (people) doing the gathering and the person (people) providing the data. Making sure that this relationship is clear and professional will help to clarify the nature of the study. One way in which this can be achieved is to ask participants to sign an informed consent form. The details of this form will vary, but it usually asks the participant to confirm that the purpose of the data gathering and how the data will be used has been explained to them and that they are happy to continue. It also often includes a statement that the participant may withdraw at any time, and that in this case none of their data will be used in the study.
It is common practice in many countries to use an informed consent form when running evaluation sessions, particularly where the participants are members of the public, or are volunteers in a research project (see Box 13.2). In this case, the informed consent form is intended to protect the interests of both the data gatherer and the data provider. The gatherer wants to know that the data she collects can be used in her analysis, presented to interested parties, and published in reports (as appropriate). The data provider wants reassurance that the information he gives will not be used for other purposes, or in any context that would be detrimental to him. This is especially true when disadvantaged groups such as disabled people or children are being interviewed. In the case of children, using an informed consent form reassures parents that their children will not be asked threatening, inappropriate, or embarrassing questions, or be asked to look at disturbing or violent images. In these cases, parents are asked to sign the form.
However, this kind of consent is not generally required when collecting data for the requirements activity where a contract already exists in some form between the data collector and the data provider. For example, consider the situation where a consultant is hired to gather data from a company in order to establish a set of requirements for a new interactive system to support timesheet entry. The employees of this company would be the users of the system, and the consultant would therefore expect to have access to the employees to gather data about the timesheet activity. In addition, the company would expect its employees to cooperate in this exercise. In this case, there is already a contract in place which covers the data gathering activity, and therefore an informed consent form is less likely to be required. As with most ethical issues, the important thing is to consider the situation carefully and make a judgment based on the specific circumstances.
Similarly, incentives for completing a questionnaire might be needed in some circumstances because there is no clear and direct advantage to the respondents, but in other circumstances, respondents may see it as part of their job to complete the questionnaire. For example, if the questionnaires form part of the requirements activity for a new mobile sales application to support sales executives, then it is likely that sales executives will complete a questionnaire about their job if they are told that the new device will impact on their day-to-day lives. In this case, the motivation for providing the required information is clear. However, if you are collecting data to understand how appealing is a new interactive website for school children, different incentives would be appropriate. Here, the advantage for the individuals to complete a questionnaire is not so obvious.
7.2.3 Triangulation
Triangulation is a strategy that entails using more than one data gathering technique to tackle a goal, or using more than one data analysis approach on the same set of data. For example, using observation to understand the context of task performance, interviews to target specific user groups, questionnaires to reach a wider population, and focus groups to build a consensus view is one example of a triangulated data gathering program. Triangulation provides different perspectives and corroboration of findings across techniques, thus leading to more rigorous and defensible findings.
7.2.4 Pilot Studies
A pilot study is a small trial run of the main study. The aim is to make sure that the proposed method is viable before embarking on the real study. Data gathering participants can be (and usually are) very unpredictable, even when a lot of time and effort has been spent carefully planning the data gathering session. Plans for a data gathering session should be tested by doing a pilot study before launching into the main study. For example, the equipment and instructions that are to be used can be checked, the questions for an interview or in a questionnaire can be tested for clarity, and an experimental procedure can be confirmed as viable. Potential problems can be identified in advance so that they can be corrected. Distributing 500 questionnaires and then being told that two of the questions were very confusing wastes time, annoys participants, and is an expensive error that could have been avoided by doing a pilot study.
If it is difficult to find people to participate or if access to participants is limited, colleagues or peers can be asked to comment. Getting comments from peers is quick and inexpensive and can be a substitute for a pilot study. It is important to note that anyone involved in a pilot study cannot be involved in the main study. Why? Because they will know more about the study and this can distort the results.
Box 7.1: Data Versus Information
There is an important difference between data and information. Data is a collection of facts from which conclusions may be drawn, while information is the result of analyzing and interpreting the data. For example, you might want to know whether a particular screen structure has improved the user's understanding of the application. In this case, the data collected might include the time it takes for a set of users to perform a particular task, the users’ comments regarding their use of the application, biometric data about the users’ heart rate while using the application, and so on. At this stage, all you have is data. In order to get to information, the data needs to be analyzed and the results interpreted. That information can then feed into the requirements or evaluation activity.
7.3 Data Recording
The most common forms of data recording are taking notes, audio recording, taking photographs, and video recording. These may be used individually or in combination. For example, an interview may be audio recorded and then to help the interviewer in later analysis, a photograph of the interviewee may be taken. Digital still cameras are especially useful as they provide an image immediately and the photograph can be re-taken if necessary. Digicams are also increasingly used to record data directly onto a disk that can be downloaded into a computer package such as iMovie or Premiere. This is much easier, cheaper and more convenient than using analog video cassettes. Questionnaires are usually completed by the participant and therefore are ‘self-documenting’, i.e. no further data recording needs to be arranged. Participant diary studies are also self-documenting, and interaction logs are usually generated automatically (see Section 7.6.3 for more details). Which data recording techniques are used will depend on the context, time available, and the sensitivity of the situation; the choice of data recording techniques will have an impact on how intrusive the data gathering will be. In most settings, audio taping, photographs, and notes will be sufficient. In others it is essential to collect video data so as to record in detail the intricacies of the activity and its context. Three common data recording approaches are discussed below.
7.3.1 Notes Plus Still Camera
Taking notes is the least technical way of recording data, but it can be difficult and tiring to write and listen or observe at the same time. It is easy to lose concentration, biases creep in, handwriting can be difficult to decipher, and the speed of writing is limited. Working with another person solves some of these problems and provides another perspective. Handwritten notes are flexible in the field or in an interview situation but must be transcribed. However, this transcription can be the first step in data analysis, as the data will be reviewed and organized. A laptop computer can be used instead of handwritten notes, but it is more obtrusive and cumbersome. Even a PDA with keyboard can be distracting because of the key clicks; paper and pen seem to be almost invisible. Digital images or documents can be easily collected (provided permission has been given). If a record of other images and documents is needed, photographs or sketches can be captured.
7.3.2 Audio Plus Still Camera
Audio recording can be a useful alternative to note taking and is less intrusive than video. In observation, it allows observers to be more mobile than with video cameras, and so is very flexible. In an interview, it allows the interviewer to pay more attention to the interviewee rather than be trying to take notes as well as listen. Transcribing a lot of audio data is time-consuming, which may seem daunting, but it isn't always necessary to transcribe all of it—often only sections are needed. Many studies do not need a great level of detail, and instead, recordings are used as a reminder and as a source of anecdotes for reports. It is also surprising how evocative it can be to hear audio recordings of people or places where you have been. If using audio recording as the main or only technique then it is important that the quality is good. It should be checked before the sessions starts.
As above, audio recording can be supplemented with still photographs of artifacts, events, and the environment.
7.3.3 Video
Video has the advantage of capturing both visual and audio data but can be intrusive.
A further problem with using video is that attention becomes focused on what is seen through the lens. It is easy to miss other things going on outside of the camera view. When recording in noisy conditions, e.g. in rooms with fans or air conditioning running or outside when it is windy, the sound can easily get muffled. It is also important to check that the tape is rewound to the beginning, the camera switched on and the lens cap removed.
Imagine you are a consultant who is employed to help develop a new computerized garden planning tool to be used by amateur and professional garden designers. Your goal is to find out how garden designers use an early prototype as they walk around their clients' gardens sketching design ideas, taking notes, and asking the clients about what they like and how they and their families use the garden. What are the advantages and disadvantages of the three approaches to data recording discussed above, in this environment?
Comment
Handwritten notes do not require specialist equipment. They are unobtrusive and very flexible but difficult to do while walking around a garden. If it starts to rain there is no equipment to get wet, but notes may get soggy and difficult to read (and write!). Video captures more information, e.g. the landscape, where the designers are looking, sketches, comments, etc., but it is more intrusive and you must hold the camera. It is also difficult if it starts to rain. Audio is a good compromise, but integrating sketches and other artifacts later can be more burdensome.
Garden planning is a highly visual, aesthetic activity, so it would be important to supplement note taking and audio recording with a still camera.
Such simple checks can go a long way to ensure valuable data is recorded—it is easy to accidentally overlook something in the stress of the moment.
In Table 7.1 we summarize the key features, advantages, and drawbacks of these three combinations of data recording techniques.
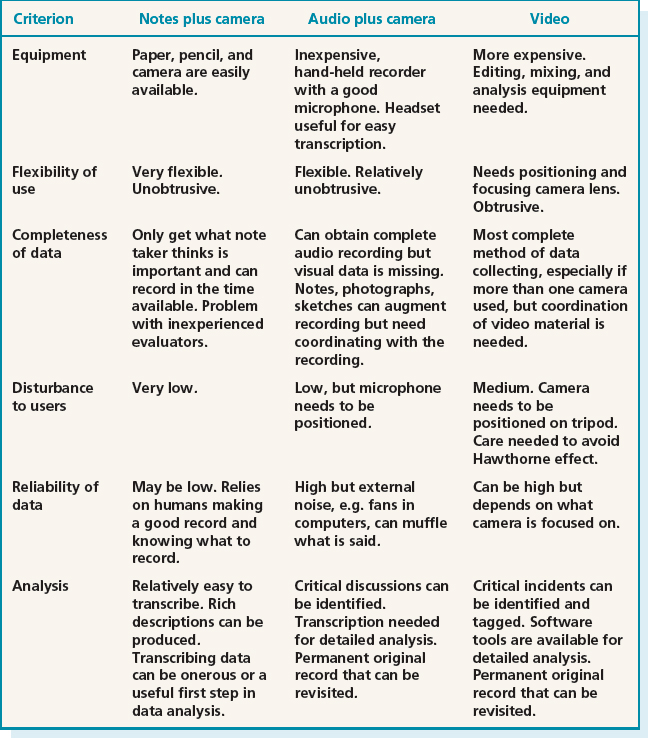
Table 7.1 Comparison of the three main approaches to data recording
7.4 Interviews
Interviews can be thought of as a “conversation with a purpose” (Kahn and Cannell, 1957). How like an ordinary conversation the interview can be depends on the type of interview method used. There are four main types of interviews: open-ended or unstructured, structured, semi-structured, and group interviews (Fontana and Frey, 1994). The first three types are named according to how much control the interviewer imposes on the conversation by following a predetermined set of questions. The fourth involves a small group guided by a facilitator.
The most appropriate approach to interviewing depends on the purpose of the interview, the questions to be addressed, and the stage in the lifecycle. For example, if the goal is to gain first impressions about how users react to a new design idea, such as an interactive sign, then an informal, open-ended interview is often the best approach. But if the goal is to get feedback about a particular design feature, such as the layout of a new web browser, then a structured interview or questionnaire is often better. This is because the goals and questions are more specific in the latter case.
7.4.1 Unstructured Interviews
Open-ended or unstructured interviews are at one end of a spectrum of how much control the interviewer has over the interview process. They are exploratory and are more like conversations around a particular topic; they often go into considerable depth. Questions posed by the interviewer are open, meaning that there is no particular expectation about the format or content of answers. Open questions are used when you want to explore the range of opinions. For example, “What are the advantages of using a PDA?” Here, the interviewee is free to answer as fully or as briefly as she wishes and both interviewer and interviewee can steer the interview.
It is always advisable to have a plan of the main topics to be covered. Going into an interview without an agenda should not be confused with being open to new information and ideas (see Section 7.4.5 on planning an interview). One of the skills necessary for conducting an unstructured interview is getting the balance right between making sure that answers to relevant questions are obtained, while at the same time being prepared to follow new lines of enquiry that were not anticipated.
A benefit of unstructured interviews is that they generate rich data, i.e. data that gives a deep understanding of the topic, and is often interrelated and complex. In addition, interviewees may mention issues that the interviewer has not considered. But this benefit often comes at a cost. A lot of unstructured data is generated, which can be very time-consuming to analyze. It is also impossible to replicate the process, since each interview takes on its own format. Typically in interaction design, there is no attempt to analyze every interview in detail. Instead, the interviewer makes notes or audio records the session and then goes back through the data afterwards to note the main issues of interest.
7.4.2 Structured Interviews
In structured interviews, the interviewer asks predetermined questions similar to those in a questionnaire (see Section 7.5). Structured interviews are useful when the goals are clearly understood and specific questions can be identified. To work best, the questions need to be short and clearly worded. Typically the questions are closed, which means that they require an answer from a predetermined set of alternatives. Responses may involve selecting from a set of options that are read aloud or presented on paper. Closed questions work well for fast interviews when the range of answers is known, and where people tend to be in a rush. In a structured interview the same questions are used with each participant so the study is standardized. Example questions for a structured interview might be:
- Which of the following websites do you visit most frequently: amazon.com, barnes&noble.com, google.com, msn.com?
- How often do you visit this website: every day, once a week, once a month, less often than once a month?
- Have you ever purchased anything online?
- If so, how often do you purchase items online: every day, once a week, once a month, less often than once a month?
Questions in a structured interview should be worded exactly the same for each participant, and they should be asked in the same order.
7.4.3 Semi-structured Interviews
Semi-structured interviews combine features of structured and unstructured interviews and use both closed and open questions. For consistency the interviewer has a basic script for guidance, so that the same topics are covered with each interviewee. The interviewer starts with preplanned questions and then probes the interviewee to say more until no new relevant information is forthcoming. For example:
Which music websites do you visit most frequently? <Answer mentions several but stresses that she prefers hottestmusic.com>
Why? <Answer says that she likes the site layout>
Tell me more about the site layout <Silence, followed by an answer describing the site's navigation>
Anything else that you like about the site? <Answer describes the animations>
Thanks. Are there any other reasons for visiting this site so often that you haven't mentioned?
It is important not to pre-empt an answer by phrasing a question to suggest that a particular answer is expected. For example, “You seemed to like this use of color …” assumes that this is the case and will probably encourage the interviewee to answer that this is true so as not to offend the interviewer. Children are particularly prone to behave in this way (see Box 7.2 for more on data gathering with children). The body language of the interviewer, for example, whether she is smiling, scowling, looking disapproving, etc., can have a strong influence on whether the interviewee will agree with a question.
Also, the interviewer needs to give the person time to speak and not move on too quickly. Probes are a device for getting more information, especially neutral probes such as, “Do you want to tell me anything else?” The person may also be prompted to help her along. For example, if the interviewee is talking about a computer interface but has forgotten the name of a key menu item, the interviewer might want to remind her so that the interview can proceed productively. Semi-structured interviews are intended to be broadly replicable, so probing and prompting should aim to help the interview along without introducing bias.
Box 7.2: Working with children
Children think and react to situations differently from adults. Sitting a 4-year-old child down in a formal interview situation is unlikely to result in anything other than a wall of silence. If children are to be included in your data gathering sessions, then child-friendly methods are needed to make them feel at ease. For example, for very young children of pre-reading or early reading age, data gathering sessions need to rely on images and chat rather than written instructions or questionnaires. Read et al. (2002) have developed a set of ‘smileys’ for use with children in interviews (see Figure 7.1). Recording children can also pose its problems. Children have a tendency to perform in front of a camera unless it is placed behind them, or they are given time to get used to it being there.

Figure 7.1 A smileyometer gauge for early readers
The appropriate techniques to involve children also depend on the goal of the data gathering session. For example, Guha et al. (2005) work with children as technology design partners. They focus on children between the ages of 7 and 11. They have found that unexpected innovations result when working as an inter-generational team, i.e. adults and children working together. The method they use is called cooperative inquiry (Druin, 2002) and is based on Scandinavian cooperative design practices, participatory design, and contextual inquiry. There are many techniques that can be used in cooperative inquiry, such as sketching ideas and brainstorming, and observational research which has been modified to accommodate children's preferred approaches. For example, the ‘mixing ideas’ approach (which also works with younger children, aged 5 to 6) involves three stages. In the first stage, each child generates ideas, working one-on-one with an adult. In the second stage, groups of adults and children mix together these ideas. Finally, all the ideas are mixed together to form ‘the big idea’ (see Figure 7.2). Guha et al. report that they are currently developing technology reflecting concepts that emerged from the big idea.
In contrast, the Equator project investigated the use of new technology to encourage children to record and analyse aspects of the environment themselves. For example, Rogers et al. (2005) report on the Ambient Wood project which investigates the use of ubiquitous computing and mobile technologies to support learning. In this work, a learning experience was designed that encourages children to explore habitats in a woodland area. Each child was given a PDA and a mobile probing tool (see Figure 7.3), which can collect data about their environment and send it to a central server. The data collected by the probe could be collated and displayed on the PDA in real time, thus giving immediate feedback to their investigations. The child's position was also monitored and location-specific data sent to their PDA, e.g. when they walked past a specific plant.

Figure 7.2 The cut up and remixed big idea
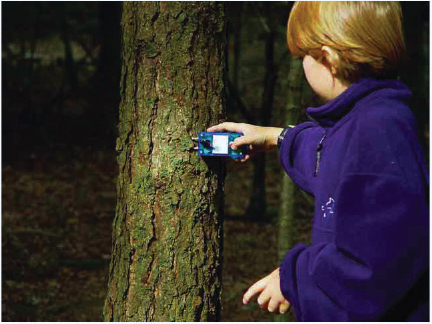
Figure 7.3 The probing tool in the Ambient Wood project being used to collect light and moisture readings
7.4.4 Focus Groups
Interviews are often conducted with one interviewer and one interviewee, but it is also common to interview people in groups. One form of group interview that is frequently used in marketing, political campaigning, and social sciences research is the focus group. Normally 3 to 10 people are involved, and the discussion is led by a trained facilitator. Participants are selected to provide a representative sample of the target population. For example, in an evaluation of a university website, a group of administrators, faculty, and students may form three separate focus groups because they use the web for different purposes. In requirements activities it is quite common to hold a focus group in order to identify conflicts in terminology or expectations from different sections within one department or organization.
The benefit of a focus group is that it allows diverse or sensitive issues to be raised that might otherwise be missed. The method assumes that individuals develop opinions within a social context by talking with others. Often questions posed to focus groups seem deceptively simple, but the idea is to enable people to put forward their own opinions in a supportive environment. A preset agenda is developed to guide the discussion, but there is sufficient flexibility for the facilitator to follow unanticipated issues as they are raised. The facilitator guides and prompts discussion and skillfully encourages quiet people to participate and stops verbose ones from dominating the discussion. The discussion is usually recorded for later analysis and participants may be invited to explain their comments more fully.
Focus groups can be very relaxed affairs (for the participants that is), but in some product development methods, focus groups have become very formalized. For example, the workshops (as they are called) used in Joint Application Development (Wood and Silver, 1995) are very structured, and their contents and participants are all prescribed.

Dilemma What they say and what they do
What users say isn't always what they do. When asked a question, people sometimes give the answers that they think show them in the best light, or they may just forget what happened or how long they spent on a particular activity. For example, in a study looking at the maintenance of telecommunications software, the developers stated that most of their job involved reading documentation, but when observed, it was found that searching and looking at source code was much more common than looking at documentation (Singer et al., 1997).
So, can interviewers believe all the responses they get? Are the respondents giving ‘the truth’ or are they simply giving the answers that they think the interviewer wants to hear?
It isn't possible to avoid this behavior, but it is important to be aware of it and to reduce such biases by choosing questions carefully, getting a large number of participants or by using a combination of data gathering techniques.
7.4.5 Planning and Conducting an Interview
Planning an interview involves developing the set of questions or topics to be covered, collating any documentation to give to the interviewee (such as consent form or project description), checking that recording equipment works in advance and you know how to use it, working out the structure of the interview, and organizing a suitable time and place.
Developing Interview Questions
Questions for an interview may be open or closed. Open questions are best suited to interviews where the goal of the session is exploratory. Closed questions require a list of possible answers, and so they can only be used in a situation where you know the possible answers in advance. It is always possible to have an ‘other’ option, but the ideal is that this option is not used very often. So whether you choose to use open questions or closed questions depends on what is already known about the topic of investigation and the goal of the interview. An unstructured interview will usually consist entirely of open questions, while a structured interview will usually consist of closed questions. A semi-structured interview may use a combination of both types.
The following guidelines for developing interview questions are derived from Robson (2002):
- Compound sentences can be confusing, so split them into two separate questions. For example, instead of, “How do you like this cell phone compared with previous ones that you have owned?” Say, “How do you like this cell phone?” “Have you owned other cell phones?” If so, “How did you like it?” This is easier for the interviewee to respond to and easier for the interviewer to record.
- Interviewees may not understand jargon or complex language and might be too embarrassed to admit it, so explain them in layman's terms.
- Try to keep questions neutral, for example, if you ask “Why do you like this style of interaction?” this question assumes that the person does like it and will discourage some interviewees from stating their real feelings.
Activity 7.2
Cybelle (see Figure 7.4) is an intelligent agent that guides visitors to the website Agentland which contains information about intelligent agents. As Cybelle is an intelligent agent, it is not straightforward to interact with her, and she can be frustrating. However, she remembers your name between visits, which is friendly.

Figure 7.4 Cybelle the intelligent agent
Cybelle has a variety of facial expressions and although the answers to my questions were often strange, she has an interesting approach to life, and one might almost say that she has personality! To see Cybelle in action, go to the website (http://www.agentland.com/) and ask her some questions. You can ask any question you like, about intelligent agents, herself, or anything else. Alternatively, you can do this activity by just looking at the figure and thinking about the questions.
The developers of Cybelle want to find out whether this approach encourages interest in intelligent agents, or whether it turns people away. To this end, they have asked you to conduct some interviews for them.
- What is the goal of your data gathering session?
- Suggest ways of recording the interview data.
- Suggest a set of questions that are suitable for use in an unstructured interview that seek opinions about whether Cybelle would encourage or discourage interest in intelligent agents.
- Based on the results of the unstructured interviews, the developers of Cybelle have found that two important acceptance factors are whether she is amusing and whether she answers questions on intelligent agents accurately. Write a set of semi-structured interview questions to evaluate these two aspects. Show two of your peers the Cybelle website. Then ask them to comment on your questions. Refine the questions based on their comments.
- The goal is to seek opinions about whether Cybelle would encourage or discourage interest in intelligent agents.
- Taking notes might be cumbersome and distracting to the interviewee, and it would be easy to miss important points. An alternative is to audio record the session. Video recording is not needed as it isn't necessary to see the interviewee. However, it would be useful to have a camera at hand to take shots of the interface in case the interviewee wanted to refer to aspects of Cybelle.
- Possible questions include: Do you find chatting with Cybelle helpful? Does Cybelle answer your questions on intelligent agents appropriately? In what way(s) does Cybelle affect your interest in intelligent agents?
- Semi-structured interview questions may be open or closed. Some closed questions that you might ask include:
- Have you seen Cybelle before?
- Would you like to find out about intelligent agents from Cybelle?
- In your opinion, is Cybelle amusing or irritating?
Some open questions, with follow-on probes, include:
- What do you like most about Cybelle? Why?
- What do you like least about Cybelle? Why?
- Please give me an example where Cybelle amused or irritated you.
It is helpful when collecting answers to list the possible responses together with boxes that can just be checked (i.e. ticked). Here's how we could convert some of the questions from Activity 7.2.
- Have you seen Cybelle before? (Explore previous knowledge)

- Would you like to find out about intelligent agents from Cybelle? (Explore initial reaction, then explore the response)

- Why?
If response is “Yes” or “No,” interviewer says, “Which of the following statements represents your feelings best?”
For “Yes,” Interviewer checks the box
□ I don't like typing
□ This is fun/cool
□ It's going to be the way of the future
□ Another reason (Interviewer notes the reason)
For “No,” Interviewer checks the box
□ I don't like systems that pretend to be people
□ She doesn't answer my questions clearly
□ I don't like her ‘personality’
□ Another reason (Interviewer notes the reason)
- In your opinion, is Cybelle amusing or irritating?
Interviewer checks box
□ Amusing
□ Irritating
□ Neither
Running the interview
Before starting, make sure that the aims of the interview have been communicated to and understood by the interviewees, and they feel comfortable. Some simple techniques can help here, such as finding out about their world before the interview so that you can dress, act, and speak in a manner that will be familiar. This is particularly important when working with disadvantaged groups such as disabled people, children, or seriously ill patients.
During the interview, it is better to listen more than to talk, to respond with sympathy but without bias, and even to enjoy the interview (Robson, 2002). Robson suggests the following steps for an interview:
- An introduction in which the interviewer introduces himself and explains why he is doing the interview, reassures interviewees regarding any ethical issues, and asks if they mind being recorded, if appropriate. This should be exactly the same for each interviewee.
- A warm-up session where easy, non-threatening questions come first. These may include questions about demographic information, such as “What area of the country do you live in?”
- A main session in which the questions are presented in a logical sequence, with the more probing ones at the end. In a semi-structured interview the order of questions may vary between participants, depending on the course of the conversation and what seems more natural.
- A cool-off period consisting of a few easy questions (to defuse tension if it has arisen).
- A closing session in which the interviewer thanks the interviewee and switches off the recorder or puts her notebook away, signaling that the interview has ended.
7.4.6 Other Forms of Interview
Telephone interviews are a good way of interviewing people with whom you cannot meet. You cannot see their body language, but apart from this telephone interviews have much in common with face-to-face interviews.
Online interviews, using either asynchronous communication such as email or synchronous communication such as instant messaging, can also be used. For interviews that involve sensitive issues, answering questions anonymously may be preferable to meeting face-to-face. If, however, face-to-face meetings are desirable but impossible because of geographical distance, video-conferencing systems can be used. Feedback about a product or a process can also be obtained from customer help lines, consumer groups, and online customer communities that provide help and support, e.g. see Box 9.2 on user involvement at Microsoft.
At various stages of design, it is useful to get quick feedback from a few users through short interviews, which are often more like conversations, in which users are asked their opinions.
Retrospective interviews, i.e. interviews which reflect on an activity that was performed in the recent past, are often conducted to check with participants that the interviewer has correctly understood what was happening.
7.4.7 Enriching The Interview Experience
Interviews often take place in a neutral environment, e.g. a meeting room away from the interviewee's normal desk, and the interview situation provides an artificial context, i.e. separate from normal tasks. In these circumstances it can be difficult for interviewees to give full answers to the questions posed. To help combat this, interviews can be enriched by using props such as prototypes or work artifacts that the interviewee or interviewer brings along, or descriptions of common tasks (examples of these kinds of props are scenarios and prototypes, which are covered in Chapters 10 and 11). These props can be used to provide context for the interviewees and help to ground the data in a real setting. Figure 7.5 illustrates the use of prototypes in a focus group setting.
For example, Jones et al. (2004) used diaries as a basis for interviews. They performed a study to probe the extent to which certain places are associated with particular activities and information needs. Each participant was asked to keep a diary in which they entered information about where they were and what they were doing at 30 minute intervals. The interview questions were then based around their diary entries.
7.5 Questionnaires
Questionnaires are a well-established technique for collecting demographic data and users' opinions. They are similar to interviews in that they can have closed or open questions. Effort and skill are needed to ensure that questions are clearly worded and the data collected can be analyzed efficiently. Clearly worded questions are particularly important when there is no researcher present to encourage the respondent and to resolve any ambiguities or misunderstandings. Well-designed questionnaires are good at getting answers to specific questions from a large group of people, and especially if that group of people is spread across a wide geographical area, making it infeasible to visit them all. Questionnaires can be used on their own or in conjunction with other methods to clarify or deepen understanding. For example, information obtained through interviews with a small selection of interviewees might be corroborated by sending a questionnaire to a wider group to confirm the conclusions. The methods and questions used depend on the context, target audience, data gathering goal, and so on.

Figure 7.5 Enriching a focus group with prototypes. Here prototype screens are displayed on the wall for all participants to see
The questions asked in a questionnaire, and those used in a structured interview, are similar, so how do you know when to use which technique? Essentially, the difference lies in the motivation of the respondent to answer the questions. If you think that this motivation is high enough to complete a questionnaire without anyone else present, then a questionnaire will be cheaper and easier to organize. On the other hand, if the respondents need some persuasion to answer the questions, it would be better to use an interview format and ask the questions face-to-face through a structured interview. For example, structured interviews are easier and quicker to conduct in situations in which people will not stop to complete a questionnaire, such as at a train station or while walking to their next meeting. One approach which lies between these two is the telephone interview.
It can be harder to develop good questionnaire questions compared with structured interview questions because the interviewer is not available to explain them or to clarify any ambiguities. Because of this, it is important that questions are specific; when possible, closed questions should be asked and a range of answers offered, including a ‘no opinion’ or ‘none of these’ option. Finally, negative questions can be confusing and may lead to the respondents giving false information. Some questionnaire designers use a mixture of negative and positive questions deliberately because it helps to check the users' intentions. In contrast, the designers of QUIS (Box 7.3) (Chin et al., 1988) decided not to mix negative and positive statements because the questionnaire was already complex enough without forcing participants to pay attention to the direction of the argument.
Box 7.3: QUIS, Questionnaire for User Interaction Satisfaction
The Questionnaire for User Interaction Satisfaction (QUIS), developed by the University of Maryland Human–Computer Interaction Laboratory, is one of the most widely used questionnaires for evaluating interfaces (Chin et al., 1988; Shneiderman, 1998a). Although developed for evaluating user satisfaction, it is frequently applied to other aspects of interaction design. An advantage of this questionnaire is that it has gone through many cycles of refinement and has been used for hundreds of evaluation studies, so it is well tried and tested. The questionnaire consists of the following 12 parts that can be used in total or in parts:
- system experience (i.e. time spent on this system)
- past experience (i.e. experience with other systems)
- overall user reactions
- screen design
- terminology and system information
- learning (i.e. to operate the system)
- system capabilities (i.e. the time it takes to perform operations)
- technical manuals and online help
- online tutorials
- multimedia
- teleconferencing
- software installation.
Notice that the third part of QUIS assesses users' overall reactions. Evaluators often use this part on its own because it is short so people are likely to respond.
7.5.1 Designing The Questionnaire's Structure
Many questionnaires start by asking for basic demographic information, e.g. gender, age, place of birth, and details of relevant experience, e.g. the time or number of years spent using computers, or the level of expertise within the domain under study, etc. This background information is useful for putting the questionnaire responses into context. For example, if two respondents conflict, these different perspectives may be due to their level of experience—a group of people who are using the web for the first time are likely to express different opinions regarding websites to another group with five years of web experience. However, only contextual information that is relevant to the study goal needs to be collected. In the website example above, it is unlikely that the person's shoe size will provide relevant context to their responses!
Specific questions that contribute to the data gathering goal usually follow these more general questions. If the questionnaire is long, the questions may be subdivided into related topics to make it easier and more logical to complete.
The following is a checklist of general advice for designing a questionnaire:
- Think about the ordering of questions. The impact of a question can be influenced by question order.
- Consider whether you need different versions of the questionnaire for different populations.
- Provide clear instructions on how to complete the questionnaire. For example, if you want a check put in one of the boxes, then say so. Questionnaires can make their message clear with careful wording and good typography.
- A balance must be struck between using white space and the need to keep the questionnaire as compact as possible. Long questionnaires cost more and deter participation and completion.
Box 7.4 contains an excerpt from a paper questionnaire designed to evaluate users' satisfaction with some specific features of a prototype website for career changers aged 34–59 years.
Box 7.4: An Excerpt from a User Satisfaction Questionnaire Used to Evaluate a Website for Career Changers
Notice that in the following excerpt most questions involve circling the appropriate response, or checking the box that most closely describes their opinion: these are commonly used techniques. Fewer than 50 participants were involved in this study, so inviting them to write an open-ended comment suggesting recommendations for change was manageable. It would have been difficult to collect this information with closed questions, since good suggestions would undoubtedly have been missed because the evaluator is unlikely to have thought to ask about them.
Please circle the most appropriate selection:
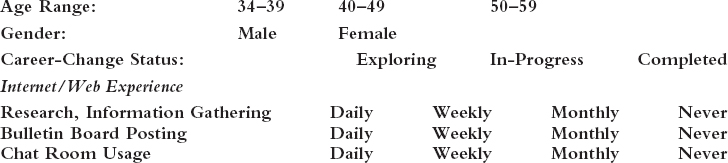
Please rate (i.e. check the box to show) agreement or disagreement with the following statements:

Please add any recommendations for changes to the overall design, language or navigation of the website on the back of this paper.
Thanks for your participation in the testing of this prototype.
From Andrews et al., (2001).
7.5.2 Question and Response Format
There are several different types of question, each of which requires a particular kind of response. For example, closed questions require an answer from a set of possibilities while open questions are unrestricted. Sometimes many options can be chosen, sometimes respondents need to indicate only one, and sometimes it is better to ask users to locate their answer within a range. Selecting the most appropriate question and response format makes it easier for respondents to be able to answer clearly. Some commonly used formats are described below.
Check boxes and ranges
The range of answers to demographic questionnaires is predictable. Gender, for example, has two options, male or female, so providing the two options and asking respondents to circle a response makes sense for collecting this information (as in Box 7.4). A similar approach can be adopted if details of age are needed. But since some people do not like to give their exact age, many questionnaires ask respondents to specify their age as a range (see Box 7.4). A common design error arises when the ranges overlap. For example, specifying two ranges as 15–20, 20–25 will cause confusion: which box do people who are 20 years old check? Making the ranges 14–19, 20–24 avoids this problem.
A frequently asked question about ranges is whether the interval must be equal in all cases. The answer is that it depends on what you want to know. For example, if you want to collect information for the design of an e-commerce site to sell life insurance, the target population is going to be mostly people with jobs in the age range of, say, 21–65 years. You could, therefore, have just three ranges: under 21, 21–65, and over 65. In contrast, if you wanted to see how the population's political views varied across the generations, you might be interested in looking at 10-year cohort groups for people over 21, in which case the following ranges would be appropriate: under 21, 22–31, 32–41, etc.
Rating scales
There are a number of different types of rating scales that can be used, each with its own purpose (see Oppenheim, 1992). Here we describe two commonly used scales, Likert and semantic differential scales. The purpose of these is to elicit a range of responses to a question that can be compared across respondents. They are good for getting people to make judgments about things, e.g. how easy, how usable, etc., and therefore are important for usability studies.
Likert scales rely on identifying a set of statements representing a range of possible opinions, while semantic differential scales rely on choosing pairs of words that represent the range of possible opinions. Likert scales are more commonly used because identifying suitable statements that respondents will understand is easier than identifying semantic pairs that respondents interpret as intended.
Likert scales. Likert scales are used for measuring opinions, attitudes, and beliefs, and consequently they are widely used for evaluating user satisfaction with products. For example, users' opinions about the use of color in a website could be evaluated with a Likert scale using a range of numbers, as in (1), or with words as in (2):
- The use of color is excellent (where 1 represents strongly agree and 5 represents strongly disagree):

- The use of color is excellent:
In both cases, respondents could be given a box to tick as shown, or they could be asked to ring the appropriate number or phrase, in which case the boxes are not needed. Designing a Likert scale involves the following three steps:
- Gather a pool of short statements about the subject to be investigated. For example, “This control panel is easy to use” or “The procedure for checking credit rating is too complex.” A brainstorming session with peers in which you identify key aspects to be investigated is a good way of doing this.
- Decide on the scale. There are three main issues to be addressed here: how many points does the scale need? Should the scale be discrete or continuous? How to represent the scale? See Box 7.5 for more on this topic.
- Select items for the final questionnaire and reword as necessary to make them clear.
Semantic differential scales. Semantic differential scales are used less frequently than Likert scales, possibly because it is harder to find pairs of words that can be interpreted consistently by participants. They explore a range of bipolar attitudes about a particular item. Each pair of attitudes is represented as a pair of adjectives. The participant is asked to place a cross in one of a number of positions between the two extremes to indicate agreement with the poles, as shown in Figure 7.6. The score for the evaluation is found by summing the scores for each bipolar pair. Scores can then be computed across groups of participants. Notice that in this example the poles are mixed so that good and bad features are distributed on the right and the left. In this example there are seven positions on the scale.
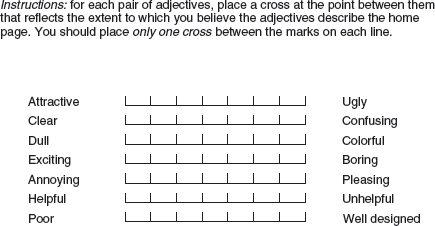
Figure 7.6 An example of a semantic differential scale
Box 7.5: What Scales to Use—3, 5, 7, or More?
When designing Likert and semantic differential scales, issues that need to be addressed include: how many points are needed on the scale? How should they be presented, and in what form?
Many questionnaires use seven- or five-point scales and there are also three-point scales. Arguments for the number of points go both ways. Advocates of long scales argue that they help to show discrimination, as advocated by the QUIS team (QUIS has a nine-point scale; Box 7.3 (Chin et al., 1988)). Rating features on an interface is more difficult for most people than, say, selecting among different flavors of ice cream, and when the task is difficult there is evidence to show that people ‘hedge their bets.’ Rather than selecting the poles of the scales if there is no right or wrong, respondents tend to select values nearer the center. The counter-argument is that people cannot be expected to discern accurately among points on a large scale, so any scale of more than five points is unnecessarily difficult to use.
Another aspect to consider is whether the scale should have an even or odd number of points. An odd number provides a clear central point. On the other hand, an even number forces participants to make a decision and prevents them from sitting on the fence.
We suggest the following guidelines:
How many points on the scale?
Use a small number, e.g. 3, when the possibilities are very limited, as in yes/no type answers:
![]()
Use a medium-sized range, e.g. 5, when making judgments that involve like/dislike, agree/disagree statements:

Use a longer range, e.g. 7 or 9, when asking respondents to make subtle judgments. For example, when asking about a user experience dimension such as ‘level of appeal’ of a character in a video game:
![]()
Discrete or continuous?
Use boxes for discrete choices and scales for finer judgments.
What order?
Place the positive end of the scale first and the negative end last. This matches the logical way people think about scoring. For example:
- — strongly agree
- — slightly agree
- — agree
- — slightly disagree
- — strongly disagree.
Activity 7.3
Spot four poorly designed features in Figure 7.7.
Comment
Some of the features that could be improved include:
- Question 2 requests exact age. Many people prefer not to give this information and would rather position themselves in a range.

- In question 3, years of experience is indicated with overlapping scales, i.e. 1, <1–3, 3–5, etc. How do you answer if you have 1, 3, or 5 years of experience?
- For question 4, the questionnaire doesn't tell you whether you should check one, two, or as many boxes as you wish.
- The space left for people to answer the open-ended question 5 is too small, which will annoy some people and deter them from giving their opinions.
7.5.3 Administering questionnaires
Two important issues when using questionnaires are reaching a representative sample of participants and ensuring a reasonable response rate. For large surveys, potential respondents need to be selected using a sampling technique. However, interaction designers commonly use small numbers of participants, often fewer than 20 users. 100% completion rates are often achieved with these small samples, but with larger or more remote populations, ensuring that surveys are returned is a well-known problem. 40% return is generally acceptable for many surveys, but much lower rates are common. Depending on your audience you might want to consider offering incentives (see Section 7.2.2).
7.5.4 Online questionnaires
Online questionnaires are becoming increasingly common because they are effective for reaching large numbers of people quickly and easily. There are two types: email and web-based. The main advantage of email is that you can target specific users. But unless email is just used to contact potential respondents and point them to a web-based questionnaire, an email questionnaire is likely to be simply an electronic editable version of a paper-based questionnaire, and this loses some of the advantages you get with a web-based questionnaire. For example, a web-based questionnaire can be interactive and can include check boxes, pull-down and pop-up menus, help screens, and graphics, e.g. Figure 7.8. It can also provide immediate data validation and can enforce rules such as select only one response, or certain types of answers such as numerical, which cannot be done in email or with paper. Other advantages of web-based questionnaires include faster response rates and automatic transfer of responses into a database for analysis (Andrews et al., 2003).
The main problem with web-based questionnaires is obtaining a random sample of respondents. As there is no central registry of Internet users, it is not possible to identify the size and demography of the full population being surveyed, and traditional sampling methods cannot be used. This means that the respondents are inevitably self-selecting and so the results cannot be generalized to offline populations. This was a criticism of the survey run by Georgia Tech's GVU (Graphic, Visualization and Usability) Centre, one of the first online surveys. This survey collected demographic and activity information from Internet users twice yearly between January 1994 and October 1998. The policy that GVU employed to deal with this difficult sampling issue was to make as many people aware of the GVU survey as possible so that a wide variety of participants were encouraged to respond. However, even these efforts did not avoid biased sampling, since participants were still self-selecting.

Figure 7.8 An excerpt from a web-based questionnaire showing pull-down menus
Some survey experts instead propose using national census records to sample offline (Nie and Ebring, 2000). The highly regarded PEW surveys select households to poll using random digit samples of telephone numbers, but these are telephone surveys and an equivalently reliable sampling method has not yet been suggested for online surveys. In some countries, web- and mobile phone-based questions are used in conjunction with television to elicit viewers' opinions of programs and political events, e.g. the television program Big Brother. A term that is gaining popularity is convenience sampling, which is another way of saying that the sample includes those who were available rather than those selected using scientific sampling.
Designing a web-based questionnaire involves the following steps (Andrews et al., 2003):
- Devise the questionnaire as if it is to be delivered on paper first, following the general guidelines introduced above.
- Develop strategies for reaching the target population.
- Produce an error-free interactive electronic version from the original paper-based one. It may also be useful to embed feedback and pop-up help within the questionnaire.
- Make the questionnaire accessible from all common browsers and readable from different-sized monitors and different network locations.
- Make sure information identifying each respondent can be captured and stored confidentially because the same person may submit several completed surveys. This can be done by recording the Internet domain name or the IP address of the respondent, which can then be transferred directly to a database. However, this action could infringe people's privacy and the legal situation should be checked. Another way is to access the transfer and referrer logs from the web server, which provide information about the domains from which the web-based questionnaire was accessed. Unfortunately, people can still send from different accounts with different IP addresses, so additional identifying information may also be needed.
- Thoroughly pilot test the questionnaire. This may be achieved in four stages: the survey is reviewed by knowledgeable analysts; typical participants complete the survey using a think-aloud protocol (see below); a small version of the study is attempted; a final check to catch small errors is conducted.
There are many online questionnaire templates available on the web that provide a range of choices, including different question types (e.g. open, multiple choice), rating scales (e.g. Likert, semantic differential), and answer types (e.g. radio buttons, check boxes, drop-down menus). The following activity asks you to make use of one of these templates to design a questionnaire for the web.
Activity 7.4
Go to questionpro.com, or a similar survey site, that allows you to design your own questionnaire using their set of widgets for a free trial period (http://www.questionpro.com/buildyoursurvey/ at time of writing).
Create a web-based questionnaire for the set of questions you developed for Activity 7.2 (Cybelle). For each question produce two different designs, for example radio buttons and drop-down menus for one question; for another question provide a 10-point semantic differential scale and a 5-point scale.
What differences (if any) do you think your two designs will have on a respondent's behavior? Ask a number of people to answer one or other of your questions and see if the answers differ for the two designs.
Comment
You may have found that respondents use the response types in different ways. For example, they may select the end options more often from a drop-down menu than from a list of options that are chosen via radio buttons. Alternatively, you may find no difference and that people's opinions are not affected by the widget style used at the interface. Any differences found, of course, may be due to the variation between individual responses rather than being caused by features in the questionnaire design. To tease the effects apart you would need to ask a large number of participants, e.g. in the order of 50–100, to respond to the questions for each design.
Box 7.6: Do People Answer Online Questionnaires Differently to Paper and Pencil? If so, why?
There has been much research examining how people respond to surveys when using a computer compared with the traditional paper and pencil method. Some studies suggest that people are more revealing and consistent in their responses when using a computer to report their habits and behaviors, such as eating, drinking, and amount of exercise, e.g. Luce et al. (2003). Students have also been found to rate their instructors less favorably when online, suggesting they are more honest in their views of their instructors (Chang, 2004). One reason for this is that students may feel less social pressure when filling in a questionnaire at a computer and hence freer to write the truth than when sitting in a classroom, with others around them, filling out a paper-based version.
Another factor that can influence how people answer questions is the way the information is structured on the screen or page, such as the use of headers, the ordering, and the placement of questions. But the potential may be greater for web-based questionnaires since they provide more opportunities than paper ones for manipulating information (Smyth et al., 2004). For example, the use of dropdown menus, radio buttons, and jump-to options may influence how people read and navigate a questionnaire. Research is beginning to investigate how such interactivity affects respondents' behavior when thinking about their replies; for example, Smyth et al. (2005) have found that providing forced choice formats results in more options being selected. The initial findings suggest that instead of prescribing a generic design format for all web-based questionnaires, e.g. using only radio buttons or entry check boxes, that the design should be selected based on the purpose of the questionnaire and the types of questions being asked (Gunn, 2002).
7.6 Observation
Observation is a useful data gathering technique at any stage during product development. Early in design, observation helps designers understand the users' context, tasks, and goals. Observation conducted later in development, e.g. in evaluation, may be used to investigate how well the developing prototype supports these tasks and goals.
Users may be observed directly by the investigator as they perform their activities, or indirectly through records of the activity that are read afterwards. Observation may also take place in the field, or in a controlled environment. In the former case, individuals are observed as they go about their day-to-day tasks in the natural setting. In the latter case, individuals are observed performing specified tasks within a controlled environment such as a usability laboratory.
Activity 7.5
To appreciate the different merits of observation in the field and observation in a controlled environment, read the scenarios below and answer the questions that follow.
Scenario 1. A usability consultant joins a group who have been given GPS-based phones to test on a visit to Stockholm. Not knowing the restaurants in the area, they use the GPS-based phone to find a list of restaurants within a five-mile radius of their hotel. Several are listed and while the group waits for a taxi, they find the telephone numbers of a couple, call them to ask about their menus, select one, make a booking, and head off to the restaurant. The usability consultant observes some problems keying instructions because the buttons seem small. She also notices that the text on the screen seems rather small, but the person using it is able to get the information needed and call the restaurant. Discussion with the group supports the evaluator's impression that there are problems with the interface, but on balance the device is useful and the group is pleased to get a table at a good restaurant nearby.
Scenario 2. A usability consultant observes how participants perform a preplanned task using the GPS-based phone in a usability laboratory. The task requires the participants to find the telephone number of a restaurant called Matisse. It takes them several minutes to do this and they appear to have problems. The video recording and interaction log suggest that the screen is too small for the amount of information they need to access and this is supported by participants' answers on a user satisfaction questionnaire.
- In which situation does the observer take the most control?
- What are the advantages and disadvantages of these two types of observation?
- When might each type of observation be useful?
Comment
- The observer takes most control in the second study. The task is predetermined, the participant is instructed what to do, and she is located in a controlled laboratory environment.
- The advantages of the field study are that the observer saw how the device could be used in a real situation to solve a real problem. She experienced the delight expressed with the overall concept and the frustration with the interface. By watching how the group used the device ‘on the move,’ she gained an understanding of what they liked and what was lacking. The disadvantage is that the observer was an insider in the group, so how objective could she be? The data is qualitative and while anecdotes can be very persuasive, how useful are they? Maybe she was having such a good time that her judgment was clouded and she missed hearing negative comments and didn't notice some people's annoyance. Another study could be done to find out more, but it is not possible to replicate the exact situation, whereas the laboratory study is easier to replicate. The advantages of the laboratory are that several users performed the same task, so different users' performance could be compared and averages calculated. The observer could also be more objective because she was more of an outsider. The disadvantage is that the study is artificial and says nothing about how the device would be used in the real environment.
- Both types of study have merits. Which is better depends on the goals of the study. The laboratory study is useful for examining details of the interaction style to make sure that usability problems with the interface and button design are diagnosed and corrected. The field study reveals how the phone is used in a real-world context and how it integrates with or changes users' behavior. Without this study, it is possible that developers might not have discovered the enthusiasm for the phone because the reward for doing laboratory tasks is not as compelling as a good meal!
7.6.1 Direct Observation in The Field
It can be very difficult for people to explain what they do or to even describe accurately how they achieve a task. So it is very unlikely that an interaction designer will get a full and true story by using interviews or questionnaires. Observation in the field can help fill in details and nuances that are not elicited from the other forms of investigation. It also provides context for tasks, and contextualizing the users and the interactive product provides important information about why activities happen the way they do. However, observation in the field can be complicated and can result in a lot of data that is not very relevant if it is not planned and carried out carefully.
Activity 7.6
- Find a small group of people who are using any kind of technology, e.g. computers, household, or entertainment appliances, and try to answer the question, “What are these people doing?” Watch for three to five minutes and write down what you observe. When you have finished, note down how you felt doing this, and any reactions in the group of people you observed.
- If you were to observe the group again, how would you change what you did the first time?
Comment
- The chances are that you found the experience prompted many uncertainties. For example, were the group talking, working, playing, or something else? How were you able to decide? Did you feel awkward or embarrassed watching? Did you wonder whether you should tell them that you were observing them? What problems did you encounter doing this exercise? Was it hard to watch everything and remember what happened? What were the most important things? Did you wonder if you should be trying to identify and remember just those things? Was remembering the order of events tricky? Perhaps you naturally picked up a pen and paper and took notes. If so, was it difficult to record fast enough? How do you think the people being watched felt? Did they know they were being watched? Did knowing affect the way they behaved? Perhaps some of them objected and walked away. If you didn't tell them, do you think you should have?
- The initial goal of the observation, i.e. to find out what the people are doing, was vague, and the chances are that it was quite a frustrating experience not knowing what was significant for answering your question and what could be ignored. The questions used to guide observation need to be more focused. For example, you might ask, what are the people doing with the technology? Is everyone in the group using it? Are they looking pleased, frustrated, serious, happy? Does the technology appear to be central to the users' goals?
All data gathering should have a clearly stated goal, but it is particularly important to have a focus for an observation session because there is always so much going on. On the other hand, it is also important to be able to respond to changing circumstances; for example, you may have planned one day to observe a particular person performing a task, but you are invited to an unexpected meeting which is relevant to your observation goal, and so it makes sense to attend the meeting instead. In observation there is a careful balance between being guided by goals and being open to modifying, shaping, or refocusing the study as you learn about the situation. Being able to keep this balance is a skill that develops with experience.
Dilemma: When should I stop observing?
Knowing when to stop doing any type of data gathering can be difficult for novices, but it is particularly tricky in observational studies because there is no obvious ending. Schedules often dictate when your study ends. Otherwise, stop when you stop learning new things. Two indications of having done enough are when you start to see similar patterns of behavior being repeated, or when you have listened to all the main stakeholder groups and understand their perspectives.
Structuring frameworks for observation in the field
During an observation, events can be complex and rapidly changing. There is a lot for observers to think about, so many experts have a framework to structure and focus their observation. The framework can be quite simple. For example, this is a practitioner's framework for use in evaluation studies that focuses on just three easy-to-remember items to look for:
- The person. Who is using the technology at any particular time?
- The place. Where are they using it?
- The thing. What are they doing with it?
Even a simple framework such as this one based on who, where, and what can be surprisingly effective to help observers keep their goals and questions in sight. Experienced observers may, however, prefer more detailed frameworks, such as the one suggested by Colin Robson (2002) which encourages observers to pay greater attention to the context of the activity:
- Space. What is the physical space like and how is it laid out?
- Actors. What are the names and relevant details of the people involved?
- Activities. What are the actors doing and why?
- Objects. What physical objects are present, such as furniture?
- Acts. What are specific individual actions?
- Events. Is what you observe part of a special event?
- Time. What is the sequence of events?
- Goals. What are the actors trying to accomplish?
- Feelings. What is the mood of the group and of individuals?
Activity 7.7
As in Activity 7.6 above, find a small group of people who are using any kind of technology. Observe this group for about 10 minutes and write down your observations, structured using Robson's framework.
Then consider how you feel about this observation exercise compared to the previous one.
Comment
Hopefully you will have felt more confident this second time, partly because it is the second time you've done some observation, and partly because the framework provided you with a structure for what to look at.
Both of the frameworks introduced above are relatively general and could be used in many different types of study, but there are other frameworks that have been developed to focus on particular circumstances. For example, Rogers and Bellotti (1997) suggest a more specific framework to support field studies in conjunction with designing future technologies. They divide their set of questions into two parts: problematizing existing settings and envisioning future settings.
Problematizing existing settings
- Why is an observation about a work practice or other activity striking?
- What are the pros and cons of the existing ways technologies are used in a setting?
- How have ‘workarounds’ evolved and how effective are they?
- Why do certain old-fashioned practices, using seemingly antiquated technologies persist, despite more advanced technologies being available in the setting?
Envisioning future settings
- What would be gained and lost through changing current ways of working or carrying out an activity by introducing new kinds of technological support?
- What might be the knock-on effects for other practices and activities through introducing new technologies?
- How might other settings be enhanced and disrupted through deploying the same kinds of future technologies?
Degree of participation
Depending on the type of study, the degree of participation within the study environment varies across a spectrum, which can be characterized as ‘insider’ at one end and ‘outsider’ at the other (see Figure 7.9). Where a particular study falls along this spectrum depends on its goal and on the practical and ethical issues that constrain and shape it.
An observer who adopts an approach right at the ‘outsider’ end of the spectrum is called a ‘passive observer’ and she will not take any part in the study environment at all. It is difficult to be a truly passive observer if you are in the field, simply because you can't avoid interacting with the activities happening around you.
An observer who adopts an approach at the ‘insider’ end of this spectrum is called a ‘participant observer.’ This means that he attempts to become a full member of the group he is studying. This can also be a difficult role to play since being an observer requires a certain level of detachment, while being a full participant assumes a different role. As a participant observer it is important to keep the two roles clear and separate, so that observation notes are objective, while participation is also maintained. It may also not be possible to take a full participant observer approach, for other reasons. For example, you may not be skilled enough in the task at hand, the organization/group may not be prepared for you to take part in their activities, or the timescale may not provide sufficient opportunity to become familiar enough with the task to participate fully.
An interesting example of participant observation is provided by Nancy Baym's work (1997) in which she joined an online community interested in soap operas for over a year in order to understand how the community functioned. She told the community what she was doing and offered to share her findings with them. This honest approach gained her their trust, and they offered support and helpful comments. As Baym participated she learned about the community, who the key characters were, how people interacted, their values, and the types of discussion that were generated. She kept all the messages as data to be referred to later. She also adapted interviewing and questionnaire techniques to collect additional information. She summarizes her data gathering as follows:

Figure 7.9 The degree of participation varies along a spectrum from insider to outsider
The data for this study were obtained from three sources. In October 1991, I saved all the messages that appeared … I collected more messages in 1993. Eighteen participants responded to a questionnaire I posted … Personal email correspondence with 10 other … participants provided further information. I posted two notices to the group explaining the project and offering to exclude posts by those who preferred not to be involved. No one declined to participate. (Baym, 1997, p. 104)
Using this data, Baym examined the group's technical and participatory structure, its emergent traditions, and its use of technology. As the work evolved, she shared its progress with the group members, who were supportive and helpful.
Activity 7.8
Drawing on your experience of using email, blogs, bulletin boards, or chat rooms, how might participant observation online differ from face-to-face participant observation?
Comment
In online participant observation you don't have to look people in the eye, deal with their skepticism, or wonder what they think of you, as you do in face-to-face situations. What you wear, how you look, and the tone of your voice don't matter. However, what you say (type) or don't say and how you say it are central to the way others will respond to you. When interacting online you only see part of a person's context. You usually can't see how they behave offline, how they present themselves, their body language, how they spend their day, their personalities, who is present but not participating, and so on.
Planning and conducting an observation in the field
The frameworks introduced in the previous section are useful not only for providing focus but also for organizing the observation and data gathering activity. But although choosing a framework is important, it is only one aspect of planning an observation. Other decisions include: the level of participation to adopt; how to make a record of the data; how to gain acceptance in the group being studied; how to handle sensitive issues such as cultural differences or access to private spaces (see Box 7.7 on observation in the home); and how to ensure that the study uses different perspectives (people, activities, job roles, etc.). One way to achieve this last point is to work as a team. This can have several benefits. For instance, each person can agree to focus on different people or different parts of the context thereby covering more ground, observation and reflection can be interweaved more easily when there is more than one observer, and more reliable data is likely to be generated because observations can be compared, and results will reflect different perspectives.
Once in the throes of an observation, there are other issues that need to be considered. For example, it will be easier to relate to some people than others, and it will be tempting to pay attention to those who receive you well but everyone in the group needs to be attended to. Observation is a fluid activity, and it will be necessary to refocus the study as you reflect upon what has been seen. Having observed for a while, interesting phenomena that seem relevant will start to emerge. Gradually ideas will sharpen into questions that guide further observation.
Observing is an intense and tiring activity, but however tired you are, it is important to check the notes and other records and to write up experiences and observations at the end of each day. If this is not done, then valuable information will be lost as the next day's events override your previous day's impressions. Writing a diary or private blog is one way of keeping up, inserting relevant photos. Any documents collected or copied, e.g. minutes of a meeting, or discussion items, should be annotated, describing how they are used and at what stage of the activity. Some observers conducting an observation over several days or weeks take time out of each day to go through their notes and other records.
As notes are reviewed, personal opinion should be separated from observation of what happened, and anything for further investigation should be clearly marked. It is also a good idea to check observations with an informant or members of the group to ensure that you have understood what is happening and that your interpretations are accurate.
Box 7.7: Observation in the Home
Home use of technology such as the personal computer, wireless telephones, cell phones, remote controls, and game consoles is growing. Although consumer surveys and similar questionnaires may be able to gather some information about this market, ethnographic studies have been used to gain the extra insight that ensures the products do not just perform needed functions but are also pleasurable and easy to use.
Dray and Mrazek (1996) report on an international study of families' use of technology in which they visited 20 families in America, Germany, and France. They spent at least four hours in each of the homes, talking with all members of the family, including children of all ages, about their use of computer technology. One aspect of the study they emphasize is the need to develop a rapport with the family. They focused their attention on building a strong positive rapport in the first few minutes of the visit. In all cases, they used food as an icebreaker, by either bringing dinner with them for themselves and the family, or by ordering food to be delivered. This provided a mundane topic of conversation that allowed a natural conversation to be held.
After dinner, they moved to the location of the computer and began by asking the children about their use of the technology. Each family member was engaged in conversation about the technology, and printed samples of work were gathered by the researchers. A protocol designed by the marketing and engineering departments of the company was used to guide the conduct of this part of the study, but after all of the protocol had been covered, families were encouraged to discuss topics they were interested in. Immediately after a visit, the team held a formal debriefing session during which all photographs, videotapes, products, and notes were reviewed and a summary debriefing questionnaire was completed. A thank you letter was later sent to the families.
From this description you can see that a large amount of preparation was required in order to ensure that the study resulted in getting the right data, i.e. in collecting data that was going to answer the relevant questions.
Mateas et al. (1996) report on a pilot study that was also aimed at informing the design and development of domestic computing systems. They visited 10 families and they too emphasize the importance of making families feel comfortable with them. In their study, this was partly achieved by bringing a pizza dinner for everyone. After dinner, the adults and the children were separated. The researchers wanted to get an understanding of a typical day in the home. To do this, each family member was asked to walk through a typical day, using a felt board with a layout of their house, and felt rooms, products, activities, and people that could be moved around on the felt house.
From their work they derived a model of space, time, and social communication that differed from the model implied by the standard PC. For example, the standard PC is designed to be used in one location by one user for long periods of uninterrupted time. The studies revealed that, on the other hand, family activity is distributed throughout multiple spaces, is rarely conducted alone, and is not partitioned into long periods of uninterrupted use. In addition, the PC does not support communication among collocated members of the family, which is a key element of family life. They conclude that small, integrated computational appliances supporting multiple collocated users are more appropriate to domestic activity than the single PC.
These two studies, and indeed most studies in the home, focus on western cultures. In contrast, Genevieve Bell from Intel has been conducting studies of domestic technology across South and South East Asia (Bell, 2003; Bell et al., 2005). She emphasizes the importance of spending time with families and using a range of data gathering including observation. She has found significant differences between her experiences with western cultures and those with Asian cultures. For example, there is often not a large range of technologies available in the home, but the home is a hub of social activities and these need supporting. In India, it is often the case that new technologies are linked to communication. In Asia more generally, technologies are used to promote eGovernment,1 education, and the extended family. She also makes the point that observers have to work hard in order to defamiliarize themselves from the home environment. Everyone is an expert on ‘the home,’ yet it is important to distance yourself from familiar environments if ethnographic studies are to yield useful insights.
Ethnography
Ethnography has traditionally been used in the social sciences to uncover the social organization of activities, and hence to understand work. Since the early 1990s it has gained credibility in interaction design, and particularly in the design of collaborative systems, e.g. Box 7.8 and Crabtree (2003). A large part of most ethnographic studies is direct observation, but interviews, questionnaires, and studying artifacts used in the activities also feature in many ethnographic studies. Its main distinguishing feature compared to other approaches to data gathering is that it aims to observe a situation without imposing any a priori structure or framework upon it, and to view everything as ‘strange.’
Ethnography has become popular within interaction design because if products are to be used in a wide variety of environments, designers must know the context and ecology of those environments (Nardi and O'Day, 1999). Bell (2001) observes that ethnographic methods are a way of uncovering people's real desires, of getting insight into their lives and following their own stories and interests; knowing these things allows products to be designed that fit ‘intuitively’ into people's lives.
The observer in an ethnographic study adopts a participant observer (i.e. insider) role as much as possible. In fact, some ethnographers see participant observation as virtually synonymous with ethnography (Atkinson and Hammersley, 1994). Others view participant observation as just one technique that is used within an ethnographic study along with informants from the community, interviews with community members, and the study of community artifacts (Fetterman, 1998). Participant observation is simply at one end of the insider–outsider spectrum, and it can be used within various methodological frameworks. For example, participant observation may be used within an action research program of study where one of the goals is to understand the situation by changing and improving it.
Box 7.8: Ethnography in Requirements
The MERboard is a tool to support scientists and engineers display, capture, annotate, and share information to support the operation of two Mars Exploration Rovers (MERs) on the surface of Mars. A MER (see Figure 7.10) acts like a human geological explorer by collecting samples, analyzing them, and transmitting results back to the scientists on Earth. The scientists and engineers then collaboratively analyze the data received from the robots, decide what to study next, create plans of action, and send commands to the robots on the surface of Mars. The goal of MERboard is to support this collaboration.

Figure 7.10 Mars Exploration Rover
The requirements for MERboard were identified partly through ethnographic fieldwork, observations, and analysis (Trimble et al., 2002). In August 2001, the team of scientists and engineers ran a series of ‘field’ tests for the MER expedition. These tests simulated the process of receiving data, analyzing it, creating plans, and transmitting them to the MERs. These tests were observed in order to identify gaps in the science process. The main problems stemmed from the scientists' limitations in displaying, sharing, and storing information (see Figure 7.11a). For example, flip charts cannot embed images, cannot easily be used to share information with team members who are not collocated, are difficult to store and retrieve, and cannot be searched easily. In one incident, participants were seen to raise their laptops in the air for others to view information.
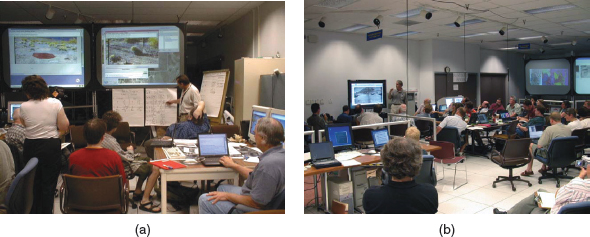
Figure 7.11 (a) The situation before MERboard. (b) A scientist using MERboard to present information
These observations led to the development of MERboard (see Figure 7.11b), which was also inspired by BlueBoard developed by IBM (Trimble et al., 2002). MERboard consists of several 50' plasma screens with touchscreen overlays backed by a computer; the computers are networked together through a centralized server and database. The interface contains four core applications: a whiteboard for brainstorming and sketching, a browser for displaying information from the web, the capability to display personal information and information across several screens, and a file storage space linked specifically to MERboard.
Gathering ethnographic data is not hard. You gather what is available, what is ‘ordinary,’ what it is that people do, say, how they work. The data collected therefore has many forms: documents, notes of your own, pictures, room layout sketches. Notebook notes may include snippets of conversation and descriptions of rooms, meetings, what someone did, or how people reacted to a situation. Data gathering is opportunistic in that you collect what you can collect and make the most of opportunities as they present themselves. Often, interesting phenomena do not reveal themselves immediately but only later on, so it is important to gather as much as possible within the framework of observation. Initially, time should be spent getting to know the people in the work place and bonding with them. It is critical, from the very beginning, that they understand why you are there, what you hope to achieve, and how long you plan to be there. Going to lunch with them, buying coffee, and bringing small gifts, e.g. cookies, can greatly help this socialization process. Moreover, it may be during one of the informal gatherings that key information is revealed.
Always show interest in the stories, gripes, and explanations that are provided but be prepared to step back if the phone rings or someone else enters the workspace. Most workers will stop mid-sentence if their attention is required elsewhere. Hence, you need to be prepared to switch in and out of their work cycles, moving into the shadow if something happens that needs the worker's immediate attention.
A good tactic is to explain to one of the participants during a quiet moment what you think is happening and then let her correct you. It is important not to appear overly keen or obtrusive. Asking too many questions, taking pictures of everything, showing off your knowledge, and getting in their way can be very off-putting. Putting up cameras on tripods on the first day is not a good idea. Listening and watching while sitting on the sidelines and occasionally asking questions is a much better approach. When you have gained the trust and respect of the participants you can then ask if they mind you setting up a video camera, taking pictures, or using a recorder.
The following is an illustrative list of materials that might be recorded and collected during an ethnographic study (adapted from Crabtree, 2003, p. 53):
- Activity or job descriptions.
- Rules and procedures (etc.) said to govern particular activities.
- Descriptions of activities observed.
- Recordings of the talk taking place between parties involved in observed activities.
- Informal interviews with participants explaining the detail of observed activities.
- Diagrams of the physical layout, including the position of artifacts.
- Photographs of artifacts (documents, diagrams, forms, computers, etc.) used in the course of observed activities.
- Videos of artifacts as used in the course of observed activities.
- Descriptions of artifacts used in the course of observed activities.
- Workflow diagrams showing the sequential order of tasks involved in observed activities.
- Process maps showing connections between activities.
Ethnographic studies traditionally take weeks, months, or even years, but interaction design requires much shorter studies because of the time constraints imposed by development schedules, and several adaptations of ethnography have emerged to tackle this challenge, as in Box 7.9.
Box 7.9: Ethnography in Evaluation
Many developers are unsure how to integrate ethnographic evaluation into development cycles. In addition, most developers have a technical training that does not encourage them to value qualitative data. Here is an example where it has been adapted for evaluation.
In a project for the Department of Juvenile Justice, Ann Rose and her colleagues developed a procedure to be used by technical design teams with limited ethnographic training (Rose et al., 1995). This applied form of ethnography acknowledges the comparatively small amounts of time available for any kind of user study. By making the process more structured, the amount of time needed for the study can be reduced. It also emphasizes that taking time to become familiar with the intricacies of a system enhances the evaluator's credibility during the field study and promotes productive fieldwork. The procedures this group advocates are highly structured, and while they may seem contrary to ethnographic practice, this structure helps to make it possible for some development teams to benefit from an applied ethnographic approach. There are four stages, as follows:
- Preparation
Understand organization policies and work culture.
Familiarize yourself with the system and its history.
Set initial goals and prepare questions. Gain access and permission to observe and interview.
- Field study
Establish a rapport with managers and users.
Observe and interview users in their workplace and collect data.
Follow any leads that emerge from the visits.
Record your visits.
- Analysis
Compile the collected data in numerical, textual, and multimedia databases. Quantify data and compile statistics. Reduce and interpret the data.
Refine the goals and processes used.
- Reporting
Consider multiple audiences and goals. Prepare a report and present the findings.
7.6.2 Direct Observation in Controlled Environments
Observing users in a controlled environment most commonly occurs within a usability laboratory and during the evaluation stage of the lifecycle. Observation in a controlled environment inevitably takes on a more formal character than observation in the field, and the user is likely to feel apprehensive. As with interviews discussed in Section 7.4, it is a good idea to prepare a script to guide how the participants will be greeted, be told about the goals of the study and how long it will last, and have their rights explained.
The same basic data recording techniques are used for direct observation in the laboratory and field studies (i.e. capturing photographs, taking notes, collecting video, etc.), but the way in which these techniques are used is different. In the laboratory the emphasis is on the details of what individuals do, while in the field the context is important and the focus is on how people interact with each other, the technology, and their environment. The equipment in the laboratory is usually set up in advance and is relatively static, but in order to avoid participants having to travel to a purpose-built usability laboratory, portable usability laboratories are now available—see Box 7.10.
The arrangement of equipment with respect to the participant is important in a usability laboratory because the details of activity need to be captured. Many usability laboratories, for example, have two or three wall-mounted, adjustable cameras to record users' activities while they work on test tasks. One camera might record facial expressions, another might focus on mouse and keyboard activity, and another might record a broad view of the participant and capture body language. The stream of data from the cameras is fed into a video editing and analysis suite where it is annotated and partially edited.
Box 7.10: Usability Laboratory in a Box
It is now possible to buy a portable usability laboratory in a suitcase which you can carry around with you. The advantages include that they record straight to hard disk, skipping out the laborious task of encoding video tapes one-by-one; they mix up to four video feeds into a single file, avoiding post hoc synchronization issues; they can be taken anywhere and can be up and running in minutes; they don't require any software installation on the test PC; they are suitable for evaluating mobile devices using the clip-on camera; and are also good for capturing spatially distributed interaction, e.g. ethnographic style observational studies or focus groups. You will read more about this in Chapter 14.
The think-aloud technique
One of the problems with observation is that the observer doesn't know what users are thinking, and can only guess from what they see. Observation in the field should not be intrusive as this will disturb the very context you are trying to capture, so asking questions of the participant should be limited. However, in a controlled environment, the observer can afford to be a little more intrusive. The think-aloud technique is a useful way of understanding what is going on in a person's head.
Figure 7.12 Home page of Lycos search engine
Imagine observing someone who has been asked to evaluate the interface of the web search engine Lycos. The user, who has used the web only once before, is told to find a list of the books written by the well-known biologist Stephen Jay Gould. He is told to type http://www.lycos.com and then proceed however he thinks best. He types the URL and gets a screen similar to the one in Figure 7.12.
Next he clicks on the People label just above the search box. He gets a screen similar to the one in Figure 7.13. He is silent. What is going on, you wonder? What is he thinking?
One way around this problem is to collect a think-aloud protocol, a technique developed by Erikson and Simon (1985) for examining people's problem-solving strategies. The technique requires people to say out loud everything that they are thinking and trying to do, so that their thought processes are externalized.
So, let's imagine an action replay of the situation just described, but this time the user has been instructed to think aloud:
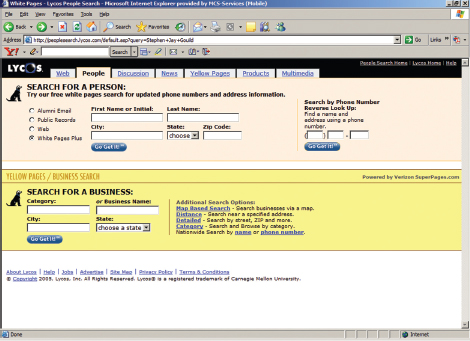
Figure 7.13 The screen that appears in response to choosing the People label
I'm typing in http://www.lycos.com as you told me. (types)
Now I press the enter key, right? (presses enter key) (pause and silence)
It's taking a few moments to respond.
Oh! Here it is. (Figure 7.12 appears)
Gosh, there's a lot of stuff on this screen, hmmm, I wonder what I do next. (pauses and looks at the screen) Probably a simple search. What's an advanced search? And there's all these things to choose from?
I just want to find Stephen Jay Gould, right, so let's go to the People section, and type in his name, then it's bound to have a list of his books? (pause, moves cursor towards the People label. Positions cursor. Clicks)
Ah! What's this … (looks at screen and Figure 7.13 appears)
(silence…)
Now you know more about what the user is trying to achieve but he is silent again. You can see that he has gone to the phone book search and that he doesn't realize that he will not find information about Stephen Jay Gould from here. What you don't know is what he is thinking now or what he is looking at. Has he realized where he's gone wrong? Is he confused?
The occurrence of these silences is one of the biggest problems with the think-aloud technique.
Try a think-aloud exercise yourself. Go to an e-commerce website, such as http://www.Amazon.com or http://www.BarnesandNoble.com, and look for something that you want to buy. Think aloud as you search and notice how you feel and behave.
Afterwards, reflect on the experience. Did you find it difficult to keep speaking all the way through the task? Did you feel awkward? Did you stop when you got stuck?
Comment
You probably felt self-conscious and awkward doing this. Some people say they feel really embarrassed. At times you may also have started to forget to speak out loud because it feels like talking to yourself, which most of us don't do normally. You may also have found it difficult to think aloud when the task got difficult. In fact, you probably stopped speaking when the task became demanding, and that is exactly the time when an observer is most eager to hear your comments.
If a user is silent during a think-aloud protocol, the observer could interrupt and remind him to think out loud, but that would be intrusive. Another solution is to have two people work together so that they talk to each other. Working with another person is often more natural and revealing because they talk in order to help each other along. This technique has been found particularly successful with children. It is also very effective when evaluating systems intended to be used synchronously by groups of users, e.g. shared whiteboards.
7.6.3 Indirect observation: tracking users' activities
Sometimes direct observation is not possible because it is obtrusive or observers cannot be present over the duration of the study, and so activities are tracked indirectly. Diaries and interaction logs are two techniques for doing this.
Diaries
In this technique, participants are asked to write a diary of their activities on a regular basis, e.g. what they did, when they did it, what they found hard or easy, and what their reactions were to the situation. For example, Robinson and Godbey (1997) asked participants in their study to record how much time they spent on various activities. These diaries were completed at the end of each day and the data was later analyzed to investigate the impact of television on people's lives.
Diaries are useful when participants are scattered and unreachable in person, for example as in many Internet and web-based projects. Diaries have several advantages: they do not take up much resource, require no special equipment or expertise, and are suitable for long-term studies. In addition, templates, like those used in open-ended online questionnaires, can be created online to standardize entry format and enable the data to go straight into a database for analysis. However, diary studies rely on participants being reliable and remembering to complete them, so incentives may be needed and the process has to be straightforward and quick. Another problem is that participants' memories of events are often exaggerated, e.g. remembering them as better or worse than they really were, or taking more or less time than they actually did.
The use of multiple media in diaries, e.g. photographs, audio clips, etc., is being explored by several researchers. Carter and Mankoff (2005) consider whether capturing events through pictures, audio, or artifacts related to the event affects the results of the diary study. They found that images resulted in more specific recall than other media, but audio was useful for capturing events when taking a picture was too awkward. Also, they found that tangible artifacts such as those in Figure 7.14 are more likely to result in discussion about wider beliefs and attitudes.
A diary study using different media was conducted by Barry Brown and his colleagues, who collected diaries from 22 people to examine when, how, and why they capture different types of information, such as notes, marks on paper, scenes, sounds, moving images, etc. (Brown et al., 2000). The participants were each given a small handheld camera and told to take a picture every time they captured information in any form. The study lasted for seven days and the pictures were used as memory joggers in a subsequent semi-structured interview used to get participants to elaborate on their activities; 381 activities were recorded. The pictures provided useful contextual information. From this data the investigators constructed a framework to inform the design of new digital cameras and handheld scanners.
Figure 7.14 Some tangible objects collected by participants involved in a study about a jazz festival
Interaction logs
Interaction logging involves instrumenting the software to record users' activity in a log that can be examined later. A variety of actions may be recorded, from key presses, mouse or other device movements, to time spent looking at help systems and task flow through software modules. If used in a usability evaluation, then gathering of the data is usually synchronized with video and audio logs to help evaluators analyze users' behavior and understand how users worked on the tasks they set.
Logging the number of visitors to a website is a common application of interaction logs, as the results can be used to justify maintenance and upgrades. For example, if you want to find out whether adding a bulletin board to an e-commerce website increases the number of visits, it is useful to be able to compare traffic before and after the addition of the bulletin board. You can also track how long people stayed at the site, which areas they visited, where they came from, and where they went next by tracking their Internet Service Provider (ISP) address. For example, in a study of an interactive art museum by researchers at the University of Southern California, server logs were analyzed by tracking visitors in this way (McLaughlin et al., 1999). Records of when people came to the site, what they requested, how long they looked at each page, what browser they were using, and what country they were from, etc., were collected over a seven-month period. The data was analyzed using Webtrends, a commercial analysis tool, and the evaluators discovered that the site was busiest on weekday evenings. In another study that investigated lurking behavior in listserver discussion groups, the number of messages posted was compared with list membership over a three-month period to see how lurking behavior differed among groups (Nonnecke and Preece, 2000).
A key advantage of logging activity is that it is unobtrusive provided system performance is not affected, but it also raises ethical concerns about observing participants without their knowledge (see the Dilemma box that follows). Another advantage is that large volumes of data can be logged automatically. However, powerful tools are needed to explore and analyze this data quantitatively and qualitatively. An increasing number of visualization tools are being developed for this purpose; one example is WebLog, which dynamically shows visits to websites, as illustrated in Figure 7.15 (Hochheiser and Shneiderman, 2001). A further example is shown in Figures 8.6 and 8.7.
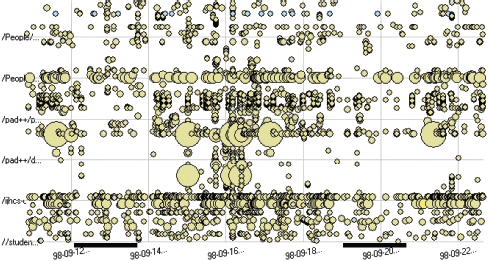
Figure 7.15 A display from WebLog, time versus URL. The requested URL is on the y-axis, with the date and time on the x-axis. The dark lines on the x-axis correspond to weekends. Each circle represents a request for a single page, and the size of the circle indicates the number of bytes delivered for a given request. (Color indicates the http status response)
While logging software can provide very useful data for website developers and application designers, it also has had some unfortunate negative side effects in Spyware, see Box 7.11.
Dilemma: They don't know we are watching. Shall we tell them?
If you have appropriate algorithms and sufficient computer storage, large quantities of data about Internet usage can be collected and users need never know. This information could be very valuable for many different reasons, but if we tell users that we are logging their behavior they may object or change their behavior. So, what should we do? It depends on the context, how much personal information is collected, and how the information will be used. Many companies now tell you that your computer activity and phone calls may be logged for quality assurance and other purposes. Most people do not object to this practice. However, should we be concerned about logging personal information (e.g. discussions about health or financial information)? Should users be worried? How can we exploit the ability to log user behavior when visiting websites without overstepping a person's civil rights? Where should we draw the line?
Box 7.11: Spyware: user logging without users knowing
A staggering number of PCs across the world have been infected by spyware; one independent survey found that nearly 90% of consumer machines have been hit (Webroot, cited in Hines, 2005). These are programs that are secretly deposited on computers that then roam around collecting information about users' browsing patterns, without letting them know. The logged data is then used to launch popup ads that target users, redirect web searches, and more insidiously steal users' personal information. Among the most popular programs are adware, keystroke loggers, and system monitors. Is this a desirable, ethical, or acceptable way of using data logging? What can be done about it?
Many people are beginning to change their online behavior, having learnt that spyware usually hijacks shareware and file-sharing programs they have downloaded from the web. They stop visiting such sites for fear that they harbor the spyware.
7.7 Choosing and combining techniques
It is usual to combine data gathering techniques in any one data gathering program in order to triangulate findings. Choosing which data gathering techniques to use depends on a variety of factors pertaining to the focus of the study, the participants involved, the nature of the technique, and the resources available. There is no ‘right’ technique or combination of techniques, but the decision will need to take all of these factors into account. Table 7.2 provides some information to help choose a set of techniques for a specific project. It lists the kind of information you can get, e.g. answers to specific questions, and the kind of data it yields, e.g. mostly qualitative or mostly quantitative. It also includes some advantages and disadvantages for each technique.
The focus of the study
The techniques used must be compatible with the goal of the study, i.e. they must be able to gather appropriate data. For example, the data to be collected may be implicit knowledge or it may be explicit, observable behavior; it may be opinion or it may be facts; it may be formal documented rules or it may be informal work-arounds and heuristics; it may be publicly accessible information or it may be confidential, and so on. The kind of data you want will probably be influenced by where you are in the development cycle. For example, at the beginning of the project you may not have any specific questions that need answering, so it is better to spend time exploring issues through interviews and observation rather than sending out questionnaires.

Table 7.2 Overview of data gathering techniques and their use
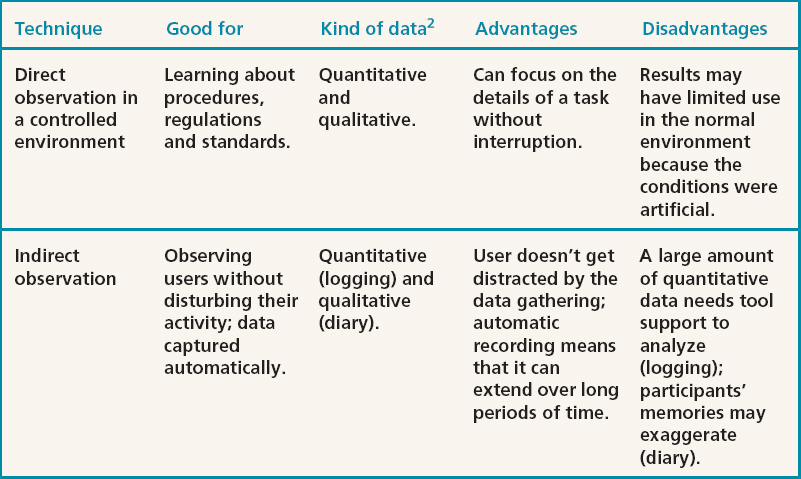
The task being investigated will also have dimensions that influence the techniques to use. For example, Olson and Moran (1996) suggest a task can be characterized along three dimensions: is it a set of sequential steps or a rapid overlapping series of subtasks; does it involve a lot of information and complex displays, or little information and simple representations; is the task to be performed by a layman or by a trained professional?
The participants involved
The characteristics of the target user group for the product will affect the kind of data gathering technique used. For example, techniques used for data gathering from young children may be very different from those used with adults (see Box 7.2). If the participants are in a hurry to catch a plane, they will not be receptive to a long interview; if their job involves interacting with people then they may be comfortable in a focus group, and so on.
The location and accessibility of participants also needs to be considered. It may be attractive to run a focus group for a large set of stakeholders, but if they are spread across a wide geographical area, it is unlikely to be practical. Similarly, the time participants need to give their undivided attention to the session is significant, e.g. an interview requires a higher level of active engagement while an observation allows the participant to continue with her normal activity.
Depending on what is motivating the participants to take part, it may be better to conduct interviews rather than to issue a questionnaire. It may also be better to conduct a focus group in order to widen consultation and participation, thereby enhancing feelings of ownership and expectations of the users.
The nature of the technique
We have already mentioned the issue of participants' time and the kind of data to be collected, but there is also the issue of whether the technique requires specialist equipment or training, and whether available investigators have the appropriate knowledge and experience. For example, how experienced is the investigator at conducting ethnographic studies, or in handling video data?
Available resources
The resources available will influence the choice, too. For example, sending out questionnaires nationwide requires sufficient time, money, and people to do a good design, pilot it, issue it, collate the results, and analyze them. If there is only three weeks and no-one on the team has designed a questionnaire before, then this is unlikely to be a success.
Activity 7.10
For each of the situations below, consider what kinds of data gathering would be appropriate and how you might use the different techniques introduced above. You should assume that you are at the beginning of the development and that you have sufficient time and resources to use any of the techniques.
- You are developing a new software system to support a small accountant's office. There is a system running already with which the users are reasonably happy, but it is looking dated and needs upgrading.
- You are looking to develop an innovative device for diabetes sufferers to help them record and monitor their blood sugar levels. There are some products already on the market, but they tend to be large and unwieldy. Many diabetes sufferers rely on manual recording and monitoring methods involving a ritual with a needle, some chemicals, and a written scale.
- You are developing a website for a young persons' fashion e-commerce site.
- As this is a small office, there are likely to be few stakeholders. Some period of observation is always important to understand the context of the new and the old system. Interviewing the staff rather than giving them questionnaires is likely to be appropriate because there aren't very many of them, and this will yield richer data and give the developers a chance to meet the users. Accountancy is regulated by a variety of laws and it would also pay to look at documentation to understand some of the constraints from this direction. So we would suggest a series of interviews with the main users to understand the positive and negative features of the existing system, a short observation session to understand the context of the system, and a study of documentation surrounding the regulations.
- In this case, your user group is spread about, so talking to all of them is infeasible. However, it is important to interview some, possibly at a local diabetic clinic, making sure that you have a representative sample. And you would need to observe the existing manual operation to understand what is required. A further group of stakeholders would be those who use or have used the other products on the market. These stakeholders can be questioned to find out the problems with the existing devices so that the new device can improve on them. A questionnaire sent to a wider group in order to back up the findings from the interviews would be appropriate, as might a focus group where possible.
- Again, you are not going to be able to interview all your users. In fact, the user group may not be very well defined. Interviews backed up by questionnaires and focus groups would be appropriate. Also, in this case, identifying similar or competing sites and evaluating them will help provide information for producing an improved product.
Assignment
The aim of this assignment is for you to practice data gathering. Assume that you have been employed to improve an interactive product such as a mobile phone, an iPOD, a VCR, a photocopying machine, computer software, or some other type of technology that interests you. You may either redesign this product, or create a completely new product. To do the assignment you will need to find a group of people or a single individual prepared to be your user group. These could be your family, your friends, or people in your class or local community group.
For this assignment you should:
- Clarify the basic goal of ‘improving the product’ by considering what this means in your circumstances.
- Watch the group (or person) casually to get an understanding of issues that might create challenges for you doing this assignment and information that might enable you to refine your goals.
- Explain how you would use each of the three data gathering techniques: interview, questionnaire, and observation in your data gathering program. Explain how your plan takes account of triangulation.
- Consider your relationship with your user group and decide if an informed consent form is required (Box 13.2 will help you to design your own if needed).
- Plan your data gathering program in detail:
- Decide what kind of interview you want to run, and design a set of interview questions for your study. Decide how you will record data, then acquire and test any equipment needed and run a pilot study.
- Decide whether you want to include a questionnaire in your data gathering program, and design appropriate questions for it. Run a pilot study to check your questionnaire.
- Decide whether you want to use direct or indirect observation and where on the outsider–insider spectrum of observers you wish to be. Decide how you will record data, then acquire and test any equipment needed and run a pilot study.
- Carry out your study but limit its scope. For example, only interview two or three people or plan only two half-hour observation periods.
- Reflect on your experience and suggest what you would do differently next time.
Keep the data you have gathered as this will form the basis of the assignment in Chapter 8.
Summary
This chapter has presented three main data gathering methods that are commonly used in interaction design: interviews, questionnaires, and observation. It has described in detail the planning and execution of each. In addition, four key issues of data gathering were presented, and how to record the data gathered was discussed.
Key Points
- All data gathering sessions should have clear goals.
- Each planned data gathering session should be tested by running a pilot study.
- Triangulation involves a combination of data gathering techniques.
- Data may be recorded using handwritten notes, audio or video recording, a camera, or any combination of these.
- There are three styles of interviews: structured, semi-structured, and unstructured.
- Questionnaires may be paper-based, email, or web-based.
- Questions for an interview or questionnaire can be open or closed. Closed questions require the interviewee to select from a limited range of options. Open questions accept a free-range response.
- Observation may be direct or indirect.
- In direct observation, the observer may adopt different levels of participation ranging from ‘insider’ (participant observer) to ‘outsider’ (passive observer).
- Choosing appropriate data gathering techniques depends on the focus of the study, the participants involved, the nature of the technique, and the resources available.
Further Reading
ANDREWS, D., NONNECKE, B., and PREECE, J., (2003) Electronic survey methodology: a case study in reaching hard-to-involve internet users. International Journal of Human–Computer Interaction 16(2): 185–210. This paper provides a comprehensive review of electronic survey design issues, based on recent literature. It then goes on to describe a case study from online communities showing how the quality criteria identified from this literature can be implemented.
OPPENHEIM, A.N. (1992) Questionnaire Design, Interviewing and Attitude Measurement. Pinter Publishers. This text is useful for reference. It provides a detailed account of all aspects of questionnaire design, illustrated with many examples.
ROBSON, C., (2002) Real World Research, 2nd edn. Blackwell Publishing. This book provides comprehensive coverage of data gathering (and analysis) techniques and how to use them.
BLY, S., (1997) Field work: is it product work? Interactions Jan/Feb: 25–30. This article provides additional information to supplement the interview with Sara Bly. It gives a broad perspective on the role of participant observation in product development.
BOGDEWIC, S.P. (1992) Participant observation. In Doing Qualitative Research, B.F. Crabtree and W.L. Miller (eds). Sage, pp. 45–69. This chapter provides an introduction to participant observation.
FETTERMAN, D.M. (1998) Ethnography: Step by Step, (2nd edn (Vol. 17). Sage. This book provides an introduction to the theory and practice of ethnography and is an excellent guide for beginners. In addition, it has a useful section on computerized tools for ethnography.
FULTON SURI, J., (2005) Thoughtless Acts? Chronicle Books, San Francisco. This intriguing little book invites you to consider how people react to their environment. It is a good introduction to the art of observation.
INTERVIEW: with Sara Bly

Sara Bly is a user-centered design consultant who specializes in the design and evaluation of distributed group technologies and practices. As well as having a Ph.D. in computer science, Sara is one of the pioneers in the development of rich, qualitative observational techniques for gathering data to analyze group interactions and activities that inform technology design. Prior to becoming a consultant, Sara managed the Collaborative Systems Group at Xerox Palo Alto Research Center (PARC). While at PARC, Sara also contributed to ground-breaking work on shared drawing, awareness systems, and systems that used non-speech audio to represent information, and to the PARC Media Space project, in which video, audio, and computing technologies were uniquely combined to create a trans-geographical laboratory.
JP: Sara, tell us about your work and what especially interests you.
SB: I'm interested in the ways that qualitative studies, particularly based on ethno-graphic methods, can inform design and development of technologies. My work spans the full gamut of user-centered design, from early conceptual design through iterative prototypes to final product deployment. I've worked on a wide range of projects from complex collaborative systems to straightforward desktop applications, and a variety of new technologies. My recent projects include a study of how people save and use the information they encounter while reading, a home projector with integrated DVD and an exploration of how people solve problems in home networks.
JP: Why do you think qualitative methods are so important for data gathering?
SB: I strongly believe that technical systems are closely bound with the social setting in which they are used. An important part of design and evaluation is to look ‘beyond the task.’ Too often we think of computer systems in isolation from the rest of the activities in which the people are involved. It's important to be able to see the interface in the context of ongoing practice. Usually the complexities and ‘messiness’ of everyday life do not lend themselves to constraining the data gathering to very specific and narrow questions. Qualitative methods are particularly helpful for exploring complex systems that involve several tasks, embedded in other activities that include multiple users.
JP: Can you give me an example?
SB: I was part of a team exploring how people encounter and save published material in the form of paper and electronic clippings. We conducted twenty artifact interviews in homes and offices. We weren't surprised to find that everyone has clippings of some form and they often share them. However, we were somewhat surprised to find that these shared clippings did more than provide a simple exchange of information. In fact, the content itself did not always have immediate value to the recipient. The data that particularly intrigued me was that the clippings could be a form of social bonding. Several recipients described some of their clippings as an indication that the giver was ‘thinking of’ them. This came from the open-ended interviews we had with people who were describing a range of materials they read and clippings they receive.3
JP: Collaborative applications seem particularly difficult to understand out of context.
SB: Yes, you have to look at collaborative systems integrated within an organizational culture in which working relationships are taken into account. We know that work practice impacts system design and that the introduction of a new system impacts work practice. Consequently, the system and the practice have to evolve together. Understanding the task or the interface is impossible without understanding the environment in which the system is or will be used.
JP: Much of what you've described involves various forms of observation. How do you collect and analyze this data?
SB: It's important that qualitative methods are not seen as just watching. Any method we use has at least three critical phases. First, there is the initial assessment of the domain and/or technology and the determination of the focal points to address. Second is the data collection, analysis, and representation, and third, the communication of the findings with the research or development team. I try to start with a clear understanding of what I need to focus on in the field. However, I also try hard not to start with assumptions about what will be true. So, I start with a well-defined focus but not a hypothesis. In the field (or even in the lab), I primarily use interviews and observations with some self-reporting that often takes the form of diaries, etc. The data typically consist of my notes, the audio and/or videotapes from interviews and observation time, still pictures, and as many artifacts as I can appropriately gather, e.g. a work document covered with post-its, a page from an old calendar. I also prefer to work with at least one other colleague so that there is a minimum of two perspectives on the events and data.
JP: It sounds like keeping track of all this data could be a problem. How do you organize and analyze it?
SB: Obviously it's critical not to end with the data collection. Whenever possible, I do immediate debriefs after each session in the field with my colleagues, noting individually and collectively whatever jumped out at us. Subsequently, I use the interview notes (from everyone involved) and the tapes and artifacts to construct as much of a picture of what happened as possible, without putting any judgment on it. For example, in a recent study six of us were involved in interviews and observations. We worked in pairs and tried to vary the pairings as often as possible. Thus, we had lots of conversations about the data and the situations before we ever came together. First, we wrote up the notes from each session (somegthing I try to do as soon as possible). Next we got together and began looking across the data. That is, we created representations of important events (tables, maps, charts) together. Because we collectively had observed all the events and because we could draw upon our notes, we could feed the data from each observation into each finding. Oftentimes, we create collections, looking for common behaviors or events across multiple sessions. A collection will highlight activities that are crucial in addressing the original focal points of the study. Whatever techniques we use, we always come back to the data as a reality and validity check.
JP: Is it difficult to get development teams and managers to listen to you? How do you feed your findings back?
SB: As often as possible, research and development teams are involved in the process along the way. They participate in setting the initial focal points for gathering data, occasionally in observation sessions, and as recipients of a final report. My goal with any project is to ensure that the final report is not a handoff but rather an interactive session that offers a chance to work together on what we've found.
JP: What are the main challenges you face?
SB: It's always difficult to conduct a field study with as much time and participation as would be ideal. Most development cycles are short and collecting the field data is just one of many necessary steps. So it's always a challenge to do a qualitative study that is timely, useful, and yet based on solid methodology.
The real gnawing question for me is how to get valuable data in the context of the customer's own environment and experience when either the activities are not easily observable and/or the system is not fully developed and ready to deploy. For example, a client recently had a prototype interface for a system that was intended to provide a new approach to person-to-person calls. It was not possible to give it to people to use outside the lab but using the interface only made sense in the context of actual real-world interactions. So, while we certainly could do a standard usability study of the interface, this approach wouldn't get at the questions of how well the product would fit into an actual work situation. What kinds of data can we hope to get in that situation that will inform us reliably about real world activity?
Of course there are always ‘day-to-day’ challenges; that's what makes the work so much fun to do! For instance, in the clipping study mentioned earlier, we expected that people would be likely to forget many of their clippings. How do we uncover the forgotten? We pushed to look at different rooms and different places (file drawers, piles by the sofa, the refrigerator), often discovering a clipping ourselves that we could then explore in conversation. We didn't want to rely on asking participants to predetermine what clippings they had.
In a more recent study of reading, one of our participants regularly reads in bed. How do we gather realistic data in that situation while not compromising our participant? In this case, we set up a video camera that our participant turned on himself. He just let a tape run out each day so that he could fall asleep as normally as possible.
JP: Finally, what about the future? Any comments?
SB: I think the explosion of digital technologies is both exciting and overwhelming. We now have so much new information constantly available and so many new devices to master that it's hard to keep up. The digital home is now even more complex than the digital office. This makes design more challenging—there are more complex activities, more diverse users and more conflicting requirements to pull together. To observe and understand this growth is a challenge that will require all the techniques at our disposal. I think an increasingly important aspect of new interfaces and interaction procedures will be not only how well they support performance, satisfaction, and experience, but how well a user is able to grasp a conceptual model that allows them to transition from current practices to new ones.
1 eGovernment, or electronic government, is the utilization of electronic technology to streamline or otherwise improve the business of government, often with respect to how citizens interact with it.
2 For a discussion of qualitative and quantitative see Section 8.2
3 Further information about this work is in Marshall and Bly (2004).