
Capturing information throughout the project is critical not only to project managers but to all team members alike. Equally important is the capability to analyze the information that was captured and understand it. With Visual Studio Team Foundation Server 2010, the mundane tasks associated with capturing is mostly automated, and gives crucial time back to the team to focus on building software rather than capturing information associated with building it.
Team Foundation Server also provides powerful features used to analyze the data and understand it. Tracking a project and monitoring it throughout its lifecycle is now made easier with Team Foundation Server Reporting and the dashboards. (Dashboards serve the purpose of providing useful information in an easy-to-consume form.)
This chapter examines the reporting capabilities of Team Foundation Server, working with reports, customizing reports, and the reviewing of reports shipped out-of-the box. In addition, this chapter looks into the new dashboards introduced in Visual Studio Team Foundation Server 2010 and team project portal as a way to stay up to date with the status of the project and the team.
Let's start with the reporting capabilities of Visual Studio Team Foundation Server 2010.
Reporting is one of the most powerful features of Team Foundation Server. Right from the first release of Team Foundation Server (that is, Team Foundation Server 2005), the central repository and the reports have been cornerstones for software development teams and the management team alike. Any data stored in the Team Foundation Server repository can be viewed as a report, which enables you to view and organize project metrics very easily. This includes work item tracking, build reports, version control stats, test results, quality indicators (performance and code coverage), and overall project health reports. Team Foundation Server ships with set of reports out-of-the-box (more on that later), but you can also create custom reports.
The reporting tools are not only useful for project managers, but also for team members in every role. For example, a developer can look at test results and hone in on specific bugs. Testers can look at a report to identify the work complete for testing, and so on.
Before looking into the details of reports, how to create custom reports, or the tools available to create reports, let's first look at how Team Foundation Server stores data. As you see in Figure 24-1, there are essentially three different data stores that Team Foundation Server uses:
Team Foundation Server operational store
Team Foundation Server data warehouse
Team Foundation Server OLAP cube
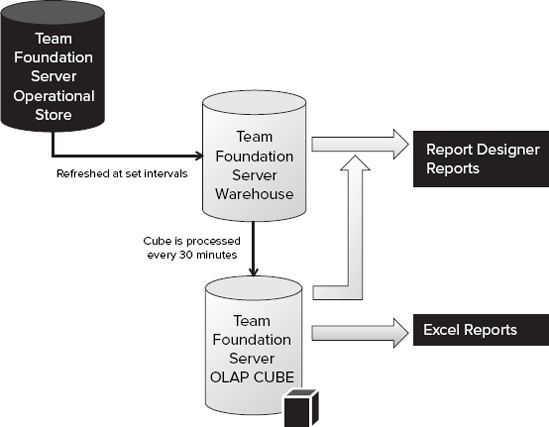
The Team Foundation Server operational store is a set of databases for storing information, including source control, build reports, test results, work item tracing, and so on. These are relational databases and they handle all live data. Hence, they are optimized for speed and performance. Multiple databases serve as the operational store, including the TFS_Configuration database and the various databases for the team project collections. Typically, you don't have to deal with (or understand) the structure of this set of databases. You will not go against this store to do reporting, for example.
Team Foundation Server data warehouse is specifically designed for querying and reporting, unlike the operational store that is designed for transactions. The schema of the warehouse is much easier to understand.
Team Foundation Server data warehouse gets the data from the operational stores on regularly set intervals. There are adapters for each of the databases in the operation store that take care of pushing the data into the warehouse. In Team Foundation Server 2008, by default, the refresh interval was 3600 seconds (that is, 60 minutes). Of course, you could change the interval using a controller service. In Team Foundation Server 2010, the update from the operational store to the warehouse is based on various events. When an event fires up, the corresponding adapter will be scheduled to execute and refresh the data in the warehouse. The interval for this execution is configurable.
In Team Foundation Server 2010, you will use the warehouse control service to change the refresh interval. Go to http://<TFSServerName:port>>/tfs/TeamFoundation/Administration/v3.0/WarehouseControlService.asmx. You must have the permission to update the warehouse setting to access this service. The WarehouseControlWebService has the following operations available:
In the ControllerService page, if you choose the operation GetSettings, it will show you the various processing jobs, its default value, and its current value. As you can see, the frequency with which the warehouse data refresh jobs are running is set to 120 seconds (or 2 minutes).
The star schema of the warehouse is suitable for analyzing the data. But, as you get into reports that require aggregated values, the warehouse may not be the best choice. The aggregation of values can become slow, depending on the volume of the rows.
Enter the Team Foundation Server OLAP cube. This is a multi-dimensional database that aggregates data for better analysis. Hence, you can correlate data based on the different metrics (that is, work items, build, test, and so on). Team Foundation Server OLAP cube gets the data from warehouse on preset interval. A scheduled job runs every 30 minutes to refresh the data in the cube from the warehouse, as shown in the settings in Figure 24-2. Also note that a full processing of the analysis database is scheduled to run on a daily basis, as indicated by the interval of "86400" seconds (or 24 hours) for the FullProcessIntervalSeconds setting.

The data in the cube can then be used by a variety of client tools, including Microsoft Excel and SQL Report Designer.
The cube consists of measures and dimensions. A measure is a numeric value that can be aggregated. Dimensions provide a way to summarize measures and categorize them based on additional metrics. Figure 24-3 shows the available measures and dimensions in the Team Foundation Server Analysis database.

Note
The blog post at http://blogs.msdn.com/sunder/archive/2009/10/19/team-foundation-server-2010-cube-schema-changes-in-beta-2.aspx provides information on changes to the cube between the 2008 and 2010 versions.
Team Foundation Server includes two sets of reports in its process template: Microsoft Excel Reports and SQL Reporting Services Reports. There are about 35 reports in the two process templates that ship with Team Foundation Server. From a project management perspective, one of the great advantages of using Team Foundation Server is that you don't have to manually correlate data from a host of third-party sources. The available reports are readily available in a dashboard (or portal).
You'll learn more about the reports shipped with the two process templates later in this chapter. But first, let's start by looking at the tools you will use to create Team Foundation Server reports.
You can use any tool that can connect to a data warehouse or an analysis database to create a report. Following are the two primary tools to create reports from Team Foundation Server by connecting to either the Team Foundation Server data warehouse or the Team Foundation Server OLAP cube:
Microsoft Office Excel
Report Designer and Report Builder
Note
You can also now use the work item queries to create a Microsoft Excel Report, which is discussed in more detail later in this chapter.
Figure 24-4 shows a quick map of which of these two tools is appropriate against which Team Foundation Server data store.

As you see, you can use the work item queries and Team Foundation Server Analysis database with Microsoft Excel and use Team Foundation Server analysis database and the data warehouse with the Report Designer.
Let's dive in and create some reports.
Note
To create reports, you need read access to the databases that makes up the warehouse and the cube. You can get access to either the warehouse or the cube or both. That will depend on the data store you will be using and the type of reports you want to create. The administrator of the database can grant you the read access. Refer to the help documentation at http://msdn.microsoft.com/en-us/library/ms252477(VS.100).aspx for information on permissions needed to access the warehouse and the analysis database.
As mentioned earlier, you can use Microsoft Excel to create reports from either the Team Foundation Server OLAP cube, or by using the work item queries. The latter is new in Team Foundation Server 2010, and a very popular addition in 2010. But let's first look at the steps to create a Microsoft Excel report from the cube. This should be familiar to you if you have created similar reports in Team Foundation Server 2008. The key advantage with the Microsoft Excel reports is the simplicity of using a pivot table, and connecting it to the cube to generate a report.
First, ensure that you have read access to the OLAP cube. Follow these steps to create a quick pivot table report using Microsoft Excel:
Open Microsoft Office Excel.
Select the Data tab from the ribbon.
Click on From Other Sources and select From Analysis Services, as shown in Figure 24-5.
That should bring up the Data Connection Wizard.
Provide the server name and credentials, and then click Next.
That will bring up the "Select Database and Table" dialog, as shown in Figure 24-6.
In the drop-down that reads, "Select the database that contains the data you want," select Tfs_Analysis. The interesting part is the list of perspectives and cube. As you see in Figure 24-6, the TFS_Analysis database has a cube named "TeamSystem." It is essentially a representation of the entire warehouse, and contains about 15 measure groups and 23 dimensions. That is one powerful (but complex) cube. If you must depend on the data from the various measure groups and dimensions for your report, then you must endure the complexity. On the other hand, if you are only interested in a small portion of the cube, you could turn your attention to one of the 5 available perspectives. Note that perspectives are only available with SQL Server Enterprise Edition. The other editions do not support perspectives, and, hence, you will have to use the "Team System" cube to create reports.
Note
Perspectives are subsets of cubes that provide application- or business-specific views into the cubes. In other words, perspectives provide a simplified view of the cube for specific purposes. In Tfs_Analysis, there are perspectives specific to build, test results, work items, code churn, and code coverage.
Choose the Work Item perspective from the list in Figure 24-6 and click Next.
In the next dialog, click Finish to get you to the Import Data dialog. Leave the selection as PivotTable Report and click OK.
You are now in the workbook with a list of fields from the Current Work Item perspective. You can now build a report using any of these fields in the work item.


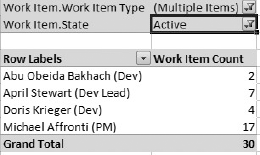
This example will show you how to create a report that answers the question, "How many active user story or task work items are there in my project?"
To do that, you must know the count of work items of type user story and task and with a state of Active. You can list that by the team member the work items are assigned to. To do that, start by adding Work Item Count to the Values area. Add WorkItem.WorkItemType and WorkItem.State to the Report Filter area and AssignedTo to the Row Labels area. Figure 24-7 shows the selection in the PivotTable Field List.

This results in a simple report that shows the active user story and task work items by team members, as shown in Figure 24-8.
This is not a particularly fancy report, but you get the point. By choosing the appropriate perspective or the "Team System" cube, as well as the fields that you need for the pivot table, you could create a report in a fairly simple manner. The focus should be on choosing the right source. So, it might be helpful for you to familiarize yourself with the perspectives provided in the warehouse.
You don't necessarily start with a brand new report every time. In many cases, you may simply modify an existing report to get the data that you are looking for. In Team Explorer, you will find existing Microsoft Excel reports in the team project under Documents

To customize a report, first choose the Microsoft Excel report that you want to modify. Open the report in Microsoft Excel by double-clicking on the report filename in Team Explorer.
Note
If you get a security warning in Microsoft Excel that says, "Data connections have been disabled," click the Options button to get the Microsoft Office Security Options window. You may have to change the selection from "Help protect me from unknown content (recommended)" to "Enable this content."
Once you have the report open in Microsoft Excel, click on the report cell to open the PivotTable Field List window (see Figure 24-7) and the toolbar. You will use this field list to make necessary changes to the report. After you are finished with changes, you can either save them locally, or publish them so others can see the updated report. You will learn about the different publishing options later in this chapter.
Work item queries provide an easy way to retrieve information about work items in Team Foundation Server 2010. The Team Queries folder contains queries shared by everyone. The My Queries folder contains queries that only you can use. Chapter 22 provides more detail on work item queries.
In Team Foundation Server 2010, you can now use these work item queries to create a Microsoft Excel report, and do so quickly. Not only can you create Microsoft Excel reports, but you can also share them with the team by publishing them. Creating reports using work item queries is a very popular feature in Visual Studio Team Foundation Server 2010. It provides a quick-and-easy way to turn work item queries into reports.
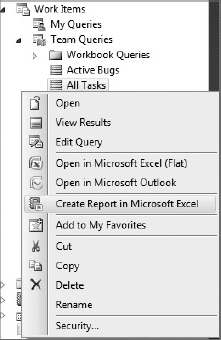
Let's look at how to create one. In Team Explorer, expand your Team Project node and the Work Items node. Let's create a report out of a team query. Expand the Team Query node. Right-click on the work item query and that will bring up the menu shown in Figure 24-10.
As you can see in Figure 24-10, you have the option called "Create Report in Microsoft Excel," and, you guessed it, that is the option you will be selecting. That should launch Microsoft Excel. The first thing that happens is that Microsoft Excel translates the work item query into data that Microsoft Excel can use to generate reports. After that, it presents a New Work Item Report window, as shown in Figure 24-11.

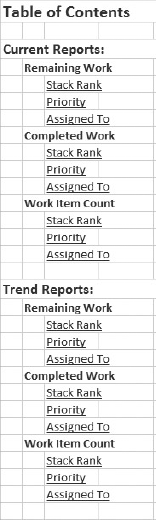
There are two buckets of reports, Current Reports and Trend Reports, with nine reports in each. To understand where these reports come from, let's look at the query and the results shown in Figure 24-12.

Obviously, because you are looking at the All Tasks query, the query clause is simple enough in listing every work item under the team project of work item type Task. The result of this query returns the following fields:
ID
Stack Rank
Priority
Assigned To
Remaining Work
Completed Work
Title
You get reports on the values that can be aggregated, such as Remaining Work, Completed Work, and the default Work Item count. Each of these reports also has variations based on attributes such as the Stack Rank, Priority, and Assigned To fields — hence, the nine reports that you see in Figure 24-11. The trend reports are based on the work item history data.
Now, let's get back to Microsoft Excel for generating the reports. From the New Work Item Report dialog (Figure 24-11), select the reports you want to see generated, or select them all. Click Finish and Microsoft Excel will begin working on the reports. When the report generation is completed, you will see a Microsoft Excel workbook with 19 worksheets — 1 worksheet with the table of contents (as shown in Figure 24-13) and 18 worksheets for each of the 18 reports.
Each of these reports is a pivot table report. You can customize these reports by modifying the fields using the PivotTable Field List dialog, as shown in Figure 24-7.
Now that you understand the basics of creating and customizing Microsoft Excel reports that are based on the data from Team Foundation Server OLAP cube and the work item queries, let's look at the options you have to publish them. Obviously, you do not have to worry about publishing if you don't have to share the reports you create. In that case, you can simply save them locally. But it is highly likely that you will be sharing reports with the rest of the team.
The publishing options for Microsoft Excel reports depend on whether you have Microsoft Office SharePoint Server (MOSS) Enterprise running your dashboard/portals, or Windows SharePoint Services (WSS) for your portals. Table 24-1 summarizes the capabilities for MOSS Enterprise users versus WSS users.
Table 24.1. MOSS Enterprise Versus WSS/SharePoint
MOSS ENTERPRISE | WSS/SHAREPOINT | |
|---|---|---|
Team site | Portal with six dashboards. | Portal with two dashboards. |
Reports | Dashboard uses Excel reports. | Dashboard uses Report Definition Language (RDL) Reports. |
Viewing Microsoft Excel reports | Viewable as Web parts. | |
Microsoft Excel reports are available in | Team Explorer under Documents | Team Explorer under Documents |
Creating new Microsoft Excel reports | From Microsoft Excel, create a new report and publish it to Excel Services. Make it available on the dashboard using the New Excel Report button from the dashboard. | From Microsoft Excel, create a new report and save it to the document library. |
Publishing Microsoft Excel reports | Publish to Excel Services and make the report available in the dashboard by using the Excel Web Access Web part. | Save the report to the document library and view it in Microsoft Excel. |
Dashboards | A set of dashboards (for example, Work Progress, Product quality, test progress, and so on) are created as part of the Team Project setup. | Excel reports are not available. RDL reports are presented in Web parts. |
You could publish a report to the shared documents from Team Explorer, or you could use the WSS portal site and upload the document.
To upload it from Team Explorer, get to the folder you want to upload the new report to. In this example, let's upload a new report, "Current Work Item count by state." To do that, first find the Excel Reports folder under Team Project
You can then select the Microsoft Excel report that you have saved locally and upload it. After you have done so, refresh the team project and voilá, the new report appears in the Team Explorer.
You could also upload the Microsoft Excel report from outside Team Explorer. To do that, open up the Team Project portal. Once in the project portal, click on Excel Reports link on the right navigation bar and upload the report to this folder, as shown in Figure 24-14.

A project portal is a SharePoint site. You will learn more about the portals and dashboards later in this chapter. If you are running MOSS 2007 Enterprise, then you have access to Excel Services. You can publish Microsoft Excel reports to Excel Services. Doing so provides the option to display the Microsoft Excel report using the Excel Web Access Web part in the dashboard. This allows you to easily and quickly create Microsoft Excel reports and share them broadly with the team using dashboards.
Figure 24-15 shows a portion of a dashboard with two Microsoft Excel reports displayed using Excel Web Access Web parts. Let's review the steps to publish a Microsoft Excel report and make it viewable in the dashboard.
First, start with a Microsoft Excel report. Create a Microsoft Excel report following the steps described earlier in this chapter, or open an already created Microsoft Excel report.
Click the Microsoft Office button and select Publish, as shown in Figure 24-16.

Select Excel Services from the Publish menu. That will bring up the familiar Save As dialog. Verify that the path information is correctly set to the Team Project path. If not, change it to the correct path. Then, click on the Excel Services Option button.
Now you will be in the Excel Services Option dialog.
In this window, there are two tabs: Show and Parameters. You will only be using the Show tab here. The Parameters tab is used to specify cells that you can provide value to while viewing the Microsoft Excel report.
In the Entire Workbook drop-down, select "Items in the Workbook" because you want to publish the Microsoft Excel report to Excel Services and have the chart show up in the dashboard using the Excel Web Access part. You don't want the entire spreadsheet to show up in the dashboard, but rather just the short version. Selecting "Items in the Workbook" changes the view in the box below the drop-down. Now you have the capability to select all charts or individual charts, as well as all pivot tables or individual pivot tables. In this example, you only have one chart and one pivot table. Select All Charts, as shown in Figure 24-17.

Click OK in this window and then Save to publish the Microsoft Excel report. Now you are finished with the publishing.
The next step is to add the report to the dashboard. To launch the dashboard, in Team Explorer, right-click on the team project name and select Show Project Portal. That will open the project portal in the browser. Select Excel Reports from the left navigation, as shown in Figure 24-14.
This will bring up the list of Microsoft Excel reports, including the new report you just published, as shown in Figure 24-18.
You now want to get this report onto the dashboard. From the Dashboards list, select the dashboard to which you want to add this report. As shown in Figure 24-14, you can choose between My Dashboard or the Project Dashboard. In this example, select the Project Dashboard.
To add the new report to this dashboard, click Site Actions on the top right-hand corner and select Edit Page.
If you have worked with SharePoint sites and Web parts, then the next few steps will be very familiar to you. You will add a new Web part to this page by clicking the Add Web Part button in the Footer section.
That will bring up the "Add Web Parts to Footer" window. You will use an Excel Web Access Web part, so select that Web part and click Add.
That adds the Excel Web Access Web part to the dashboard page. The next step is to select a workbook that you want to display in this Web part. In this example, that would be the "Remaining Work Items by Team Member" workbook (see Figure 24-14). So, select that workbook. You do that by specifying the details in the tool pane. There is obviously lots of information that you can provide in this tool pane. Following are the two fields that you will update here:
Workbook
Title
Click OK on the tool pane window and exit the edit mode to see this report displayed in the dashboard.
Microsoft Excel reports are truly going to make it easy for team members get the data and metrics that they want from Team Foundation Server. The capability to create report from a work item query is a great addition to the reporting capability in Team Foundation Server. Couple that with the Microsoft Excel services and dashboards, and now no one can complain about not having the right information at the right time.
This section briefly examines the tools available to create and customize Report Definition Language (RDL) reports. Team Foundation Server 2010 includes set of RDL reports out-of-the-box, and the reports vary by the type of process template you choose to use for your project. You'll learn about the list of these reports later in this chapter.
There are two tools available to work with RDL reports:
The Report Builder 2.0 tool has full support for SQL Reporting Services. It's designed for business analysts and developers who wish to create custom reports quickly and easily. You can download the tool from http://www.microsoft.com/downloads/details.aspx?FamilyID=9f783224-9871-4eea-b1d5-f3140a253db6&displaylang=en#filelist. With this tool, you can work with RDL files, make necessary changes, and save it as an RDL file. This file can then be used, for example, using the Report Designer.
Once you have the tool installed, launch the report builder and start by connecting the report server. (For example, http://<< Server instance name/reportserver >>.) It is probably easier to start with an existing report and customize it than it is to create one from scratch.
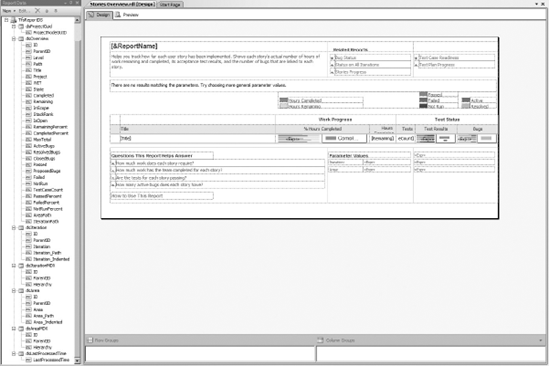
To edit an existing report, you start by selecting the reports folder in the report server, then the team project collection, followed by the actual team project. This will bring the up the folders with the reports, and you will choose the report for customization from one of these folders. Figure 24-19 shows the "Stories Overview" report in the Report Builder 2.0 tool.

The report data pane has the parameters, data set, and the built-in fields that you will work with to modify the report.
Note
SQL Server Developer Center on MSDN has several how-to topics on Report Builder 2.0. For more information, see http://msdn.microsoft.com/en-us/library/dd220513.aspx.
This is an add-on that is installed with SQL Server Client Tools.
Note
Note you also have the "Business Intelligence Development Studio" that you can use to create and work with reports.
After you install it, you will have access to a new project type called Business Intelligence Projects. This will have a template called Report Server Project. You will use this project to set up a report project in Visual Studio. Once you have the project set up, you can start adding new reports from within Visual Studio.
Follow these steps to work on an existing report:
Create a Report Server project as described previously.
In the Solution Explorer, you will see two folders named
Shared Data SourcesandReportscreated.Right-click on
Shared Data Sources, and select "Add a Data Source."In the Shared Data Source Properties window, provide a name for the data source and select Microsoft SQL Server Analysis Services as the type.
Click the Edit button to specify the connection information. In the Connection Properties dialog, specify the server name and select
Tfs_Analysisas the database name. You may want to test the connection to this database before proceeding.
Now that you have set the data source, the next thing to do is to get the report you want to modify. To do that, you must save the RDL file into this project. To do that, follow these steps:
Go to the team project report site. (From within Team Explorer, right-click on the
Reportsfolder under the team project, and select Show Report Site.)Select the report you want to edit.
Go to the Properties tab from the report page.
In the Properties page, select Edit and save the
.rdlfile.
With the report file saved, switch back to Visual Studio and to the Report Project. In Solution Explorer, right-click the Reports folder and select "Add an existing item." At this point, you want to add to this project the .rdl file you saved in the prior step.
Now, you will see the report file added to the Solution Explorer. Double-click the report file to open it in the designer, as shown in Figure 24-20. This probably looks familiar, because it is very similar to the view you saw in Figure 24-19, which was using the Report Builder 2.0 tool.
Note
Check out the MSDN article "Creating and Customizing TFS Reports," at http://msdn.microsoft.com/en-us/library/aa337239(SQL.90).aspx for detailed information on how to create and customize RDL reports using Report Designer.
Note
For the reports you have created for Team Foundation Server 2008, refer to the following blog posts to learn about the steps to upgrade them over to Team Foundation Server 2010.
http://www.socha.com/blogs/john/2009/05/upgrading-visual-studio-team-foundation.htmlhttp://www.socha.com/blogs/john/2009/10/upgrading-team-foundation-server-2008.html
As you learned in Chapter 23, Team Foundation Server includes two process templates — one for teams practicing agile techniques, and the other for teams requiring a more formal process in CMMI. This section takes a look at the reports included in each of these two templates.
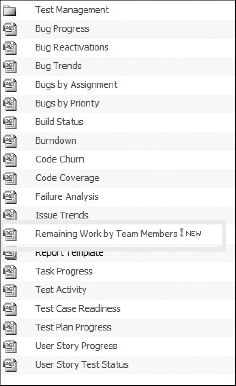
As discussed in Chapter 23, the MSF for Agile Software Development template has been significantly updated to get the terminologies and practices in line with mainstream agile methodologies. That applies to the reports as well. If you are a practitioner of agile methods, you are probably aware of reports such as a work burndown and remaining work. These two reports are among the 15 shipped with the MFS for Agile Software Development template.
MSF for CMMI Process Improvement template also includes a set of SQL Reporting Services reports and Excel reports. Obviously, the user story-related reports are based on the "Requirements work item" in the CMMI template.
In Team Foundation Server 2010, reports are logically grouped, and are available in specific folders. Table 24-2 shows the SQL Reporting Services reports available out-of-the-box in the Team Foundation Server process templates.
Table 24.2. SQL Reporting Services Reports
GROUP | REPORT NAME | DESCRIPTION |
|---|---|---|
BUGS | Bug Status | Helps you track the team's progress toward resolving bugs. Shows the number of bugs in each state over time, a breakdown of bugs by priority or severity, and the number of bugs that are assigned to each team member. |
Bug Trends | Helps you track the rate at which the team is discovering and resolving bugs. Shows a moving average of bugs discovered and resolved over time. | |
Reactivations | Helps you track how effectively the team is resolving bugs. Shows the number of bugs that the team resolved over time in relation to the number of bugs that the team resolved and later re-activated. | |
BUILDS | Build Quality Indicators | Helps you track how close the completed code is to release quality. Shows test coverage, code churn, and bug counts. |
Build Success Over Time | Helps you track changes in the quality of the code that the team has checked in. Shows test results for the last build of each day. | |
Build Summary | Helps you determine the status of each build. Shows a list of builds with test results, test coverage, code churn, and quality notes. | |
Burndown and Burn Rate | Helps you track the team's progress toward completing the work in iteration. Shows how many hours of work the team has completed, how many hours remain, the rate of progress, and the work assigned to each team member. | |
Remaining Work | Helps you track the team's progress. Shows the total number of hours of work in an iteration and the team's progress toward completing it. | |
Status on All Iterations | Helps you track the team's performance over successive iterations. Shows each iteration's original estimates for the number of hours of work, the actual numbers of hours of work that the team completed, the number of hours of work that remain, and the number of bugs. | |
Stories Overview (or Requirements Overview in the CMMI template) | Helps you track how far each user story has been implemented. Shows each story's actual number of hours of work remaining and completed, its acceptance test results, and the number of bugs that are linked to each story. | |
Stories Progress (or Requirements Progress in the CMMI template) | Helps you track recent progress for each user story. Shows each story's remaining, completed, and recently completed work. | |
TESTS | Test Case Readiness | Helps you track how many test cases are ready to be run. Shows the number of test cases in each state of preparation. |
Test Plan Progress | Helps you track the progress of your test plans. Shows the results of running the tests over time. |
The reports shown in Table 24-2 are all available as RDL reports. You can view them by going to the team project report site. By default, you will get to a page with the various report folders. Select the folder and click on the individual report to view it. Figure 24-21 shows the "Stories Progress" report under the Project Management folder.

If you are thinking the reports are looking different than what you are used to seeing in Team Foundation Server 2008, you would be right. The reports have undergone changes both on visual appeal and the information it provides.
Some of the reports are composite reports that show data from multiple reports. This helps to get a snapshot of the progress without having to view multiple reports. The "Burndown and Burn Rate" report under the "Project Management" report folder is one such composite report. There are also a couple of minor (but very useful) additions to the report:
On the top-right corner, you see the Related Reports section. It's a very handy list to reference in case you want to get additional information.
In the bottom left, the Questions This Report Helps Answer section should come in handy to aid in understanding the report and how to use the report in answering questions.
In addition to these RDL reports, there are also a set of Microsoft Excel reports that are available out-of-the-box. Some of the Microsoft Excel reports are the same as the RDL reports, but there are additional ones as well. You will find the Microsoft Excel reports under the Documents
One of the key features of Team Foundation Server is the capability to capture information, and, more importantly, make that information available to the team and the management with little or no overhead. Project portals and dashboards play a key role in disseminating information to the entire team.
Project portals should be familiar to the users of Team Foundation Server 2008. This has gone through a face lift in the 2010 version. However, dashboards are new in Team Foundation Server 2010. A project portal serves as the one-stop information portal for your project. In 2010, project portals include several new dashboards. The number of dashboards you get out-of-the-box and the type of reports displayed in these dashboards depend on whether you have MOSS Enterprise or WSS site associated with your team project. This section takes a quick look at the project portal and the dashboards.
Let's start with the portal. To access the portal, from within Team Explorer, right-click on the team project name and select Show Project Portal. That will launch the browser and load the project portal page.
This screen has changed quite a bit from its 2008 version, so let's take a quick tour of this page.
Let's start from the left navigation and look at significant features in the portal.
This is a link to the Team Foundation Server Web Access. Team Web Access provides a Web-based interface to connect to Team Foundation Server and manage a team project. Team Web Access is customizable, and provides many capabilities that are available through Team Explorer, including the following:
Dashboards are new in Team Foundation Server 2010. Out-of-the-box, Team Foundation Server includes the following six dashboards:
Burndown
Quality
Bugs
Test
Build
My Dashboard
These dashboards are only available if the team project portal is associated with a MOSS enterprise site. Dashboards use two kinds of SharePoint Web parts to display the information. It uses Excel Web Access Web part to display Excel reports and uses Team Web Access Web part to display work item query results. You will see examples of these later in this section.
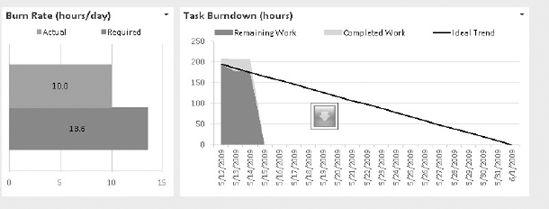
Each of these dashboards is essentially a collection of reports that provide relevant information particular to that dashboard. For example, Figure 24-22 shows the Burndown dashboard. This dashboard presents the following four reports:
Task Burndown
Task Progress
User Story Progress
Issue Trend
With the information from these four reports, Burndown dashboard helps you get a quick snapshot of how the project is coming along. By looking at the Task Burndown chart in Figure 24-22, you can get a sense for how the team is progressing against the ideal trend line. In this example, the team is on track to complete. This dashboard also shows the issues trend. You obviously don't want the active issues to trend high. In this example, the issues trend looks fine, with many resolved or closed issues, and the active issues line trending low. Don't you simply enjoy sample projects where all the metrics look just the way you want them to be?
Note that each of these dashboards is customizable based on your need, or you can add a new dashboard if you want to track a different set of information that does not fit into the existing dashboards. With the exception of My Dashboard, all other dashboards use Excel reports, and, hence, the Excel Web Access Web part.

My Dashboard uses the Team Web Access Web part to show results from various work item queries. This dashboard could serve as the view of your "TODO" list. It provides you with a view of the team bugs, tasks, and issues that are assigned to you, as shown in Figure 24-23.
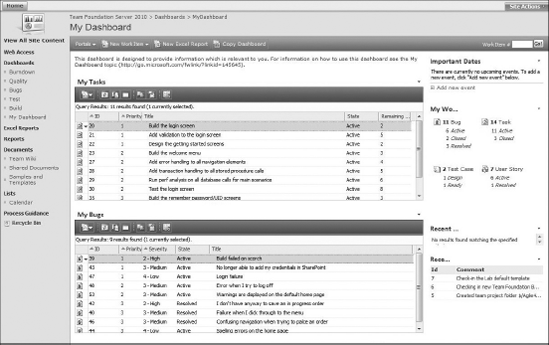
Obviously, you could edit the queries that are attached to these Web parts, or add additional Web parts to modify this dashboard to fit your need and the information that you would like to see in this dashboard.
If you do not have a MOSS Enterprise-based site associated with your team project, and instead have a WSS site associated with the project, you get the following two dashboards in the portal:
My Dashboard — This is the same as what has been previously described.
Project Dashboard — This dashboard contains the following three main sections:
Task Burndown RDL report presented in a Page Viewer Web part
Burn Rate RDL report presented in a Page Viewer Web part
Results of the Product Backlog query presented in the Team Web Access Web part
The next menu item on the left navigation is the "Excel Reports." Clicking on this link will load the list of Microsoft Excel reports that are available in this team project.
This links to the Report Manager page. In this page, you will see the folders that the various reports are grouped under.
This has three links:
Wiki page — Wiki page is a site to collaborate with your team by sharing information, design artifacts, a knowledge base, and so on. It is a simple wiki site that is set up as part of the portal-creation process that you can use to suit the needs of your team. Refer to the "How to use this wiki site" document in the wiki pages for more information on this.
Shared Documents — This is where you will find the Product Backlog and Iteration Backlog spreadsheets if you are using the agile template.
Samples and Templates — This section is where you will find a list of templates for personas, iteration retrospectives, test plans, and so on.
Now, let's look at the features available in the top horizontal menu.
This is a shortcut link to create a new work item in your team project. By clicking on the drop-down, you will have the option to pick the type of work item you want to create, as shown in Figure 24-24. After you pick a work item type, that opens a work item form to provide the details.

Earlier in this chapter, you learned about the steps used to create Microsoft Excel reports. This link automates a couple of the steps in the process by making the necessary data connection. The earlier section in this chapter, "Working with Microsoft Excel Reports," provides more information.
Earlier, you learned that you can add new dashboards. Using Copy Dashboards is a quick way to do that. From the dashboard you are in, click Copy Dashboard. This opens up the form shown in Figure 24-25.
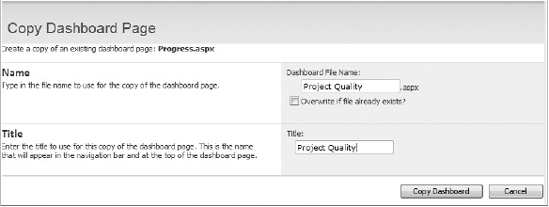
Fill out the details and click the Copy Dashboard button. This will create the new dashboard and add it to the Dashboard section in the left navigation as well. Now, you can edit this dashboard and include the reports that you want to see in this new dashboard.
In this chapter, you learned about the various data stores in Team Foundation Server that provide the data for the various reports. You also learned about the tools that are available to create reports. This chapter examined how to create and customize Microsoft Excel reports, and the tools available to create and customize RDL reports (that is, Report Builder and Report Designer), as well as the options available for publishing reports. Lastly, this chapter reviewed the portal and the new dashboards available in Team Foundation Server 2010.
Reporting is a powerful feature in Team Foundation Server. It breaks down the usual barrier within teams caused by a lack of information. Team Foundation Server provides a powerful set of reports out-of-the-box and provides the capability to add additional reports based on your needs. And that is coupled with the capability to quickly share the information using dashboards and portals.
Chapter 25 takes a look at the product planning workbook and the iteration backlog workbook, and how they can be used by agile teams to manage product backlog and iteration backlog.