IN THIS CHAPTER
Over time all systems begin to decrease in performance and increase in technical troubles. The reasons are simple. As you add more programs to your new OS, add files, and turn on more services, your computer begins a performance decline. There is typically a bottleneck that stands out above the rest, and so the tools provided within Windows 7 can help locate those bottlenecks and hopefully mitigate some of them. Troubles come with time as well due to hardware wear and tear, which you need to be made aware of to swiftly correct before a major problem appears. This chapter helps you to locate and utilize the performance and troubleshooting tools you need to keep your system plugging along speedily.
The Performance Information and Tools link in the Control Panel takes you to the Windows Experience Index (WEI), shown in Figure 9.1. You can get to this same location by clicking the System link and then clicking the Windows Experience Index link next to the rating provided for your system.

The rating is a number based on five different ratings that are given to your system in the categories Processor, RAM, Graphics, Gaming Graphics, and Primary Hard Disk. The final rating is not, as you might expect, a compilation of all the ratings, but is actually the lowest of the subcomponent scores.
The WEI scores can range from 1.0 to 7.9. (The highest was 5.9 in Windows Vista, and the adjustment is to account for faster hardware since Vista was released.) There are also some updates to the scoring rules that Vista used, based on experience and feedback comparing closely related devices.
The behind-the-scenes tool that creates your WEI is the Windows System Assessment Tool (WinSAT), which is designed to analyze your system’s performance through a series of tests.
For the most part, when you install an OS like XP, you are going to get XP in all its glory, regardless of the box you are running it on. So, although the underlying dynamic link libraries (DLLs) might differ, the OS options should be the same, right? Or should they? Does that really make sense that two systems, one of which is a $200 cheapo box with cheesy hardware, should be put in the same position to handle the OS features of a mega system? Well, Windows 7 has a little underlying tool that helps to differentiate between the two. It’s called WinSAT.
When you first install Windows 7, but before the first log in, WinSAT runs its testing process to see what your individual system can handle. It uses that information to determine which operating system features should be enabled or disabled by default. For example, if your system cannot handle Aero features, the settings on your OS will reduce itself to basic mode.
The WinSAT utility creates its output in the system directory: %systemroot%PerformanceWinSATDataStore. Each time you run WinSAT, a new XML file will be generated in this folder with the date of the assessment stuck at the beginning of the filename (for example, 2007-01-01 12.00.00.000 Assessment (Formal).WinSAT.xml). There is also a file in this directory with the word Initial inside the bracketed part of the filename.
From the Performance Information and Tools dialog, there is an Advanced Tools link (to the left). Clicking this option takes you to the dialog shown in Figure 9.2.
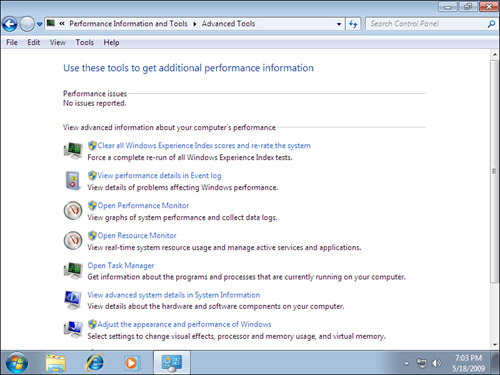
You will be shown if there are “performance issues” to be reported. You will also be shown a variety of tools to help you monitor/improve your performance. These include the following:
• Clear All Windows Experience Index Scores and Re-Rate the System: Force a complete rerun of all Windows Experience Index tests.
• View Performance Details in Event Log: View details of problems affecting Windows performance.
• Open Performance Monitor: View graphs of system performance and collect data logs.
• Open Resource Monitor: View real-time system resource usage and manage active services and applications.
• Open Task Manager: Get information about the programs and processes currently running on your computer.
• View Advanced System Details in System Information: View details about the hardware and software components on your computer.
• Adjust the Appearance and Performance of Windows: Select settings to change visual effects, processor, and memory usage and virtual memory.
• Open Disk Defragmenter: Modify the schedule used to automatically defragment your hard disk.
• Generate a System Health Report: View details about system health and performance.
Under Windows Vista, the Reliability Monitor and Performance Monitor were combined with the Resource Monitor. These have been split up in Windows 7 so that each one stands on its own. The overall functionality within each is the same, however; they just look a little different (and have a few new features) because they have been restructured to work alone.
To view your Reliability Monitor, you can type reliability in your Instant Search dialog from your Start menu. Choose View Reliability History, or you can click Control Panel, Action Center, and choose the View Reliability History link under the Maintenance settings.
What is your standard method for determining the reliability of your system? Most of us determine system reliability by how long it has been since it has blue screened on us or forced us to reboot. Not the most “technically sound” way to assess reliability.
The main goal of the Reliability Monitor is to keep track of “reliability events,” which have been defined as changes to your system that could alter the stability or other events and that might indicate system instability. Events monitored include the following:
• Windows updates
• Software installs and uninstalls
• Device driver installs, updates, rollbacks, and uninstalls
• Application hangs and crashes
• Device drivers that fail to load or unload
• Windows failures, including boot failures, system crashes, and sleep failures
The Stability Index gives you a visual about how reliable your system looks over time. You are given an overall Stability Index score (10 = perfect, 1 = lowest). The Reliability Monitor (shown in Figure 9.3) retains up to a year’s worth of data so that you can really see how your system has been performing.
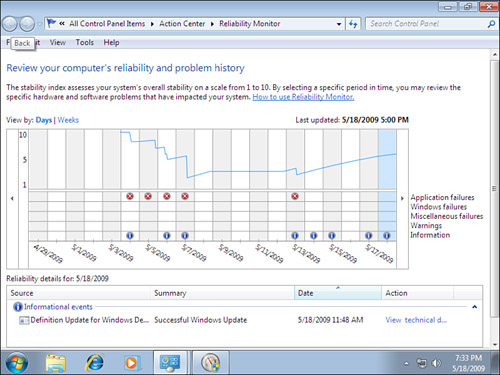
If you see a drop in the stability, you can check the date the drop began and then see whether one of the following caused the instability: application failures, Windows failures, miscellaneous failures, warnings, and information.
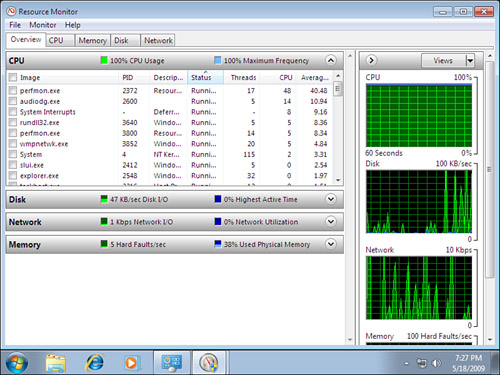
The Resource Monitor, shown in Figure 9.4, shows a real-time view of your system’s CPU, memory, disk, and network usage. As you can see in this figure, you can select items under CPU to have those stand out on the chart specifically to the right. In addition, you can use the Resource Monitor to stop processes, start and stop services, analyze process deadlocks, view thread wait chains, and identify processes locking files.
For many years, this tool stood alone. In Windows Vista, it was combined with the Resource Monitor and the Reliability Monitor. It was also given a new structure for collecting data. The Performance Monitor can show you performance data in either real time or from a log file. Data collector sets can be set to run immediately or on a schedule, with the goal of collecting and analyzing specific aspects of your system.
Under Monitoring Tools, Performance Monitor (see Figure 9.5), you can inspect a variety of system components, beyond what the Resource Monitor shows you. Initially, you won’t see more than the % Process Time displayed. You can add more performance metrics, called counters, by clicking the + sign.

When you first see the number of possible counters and instances, you will understand that the task of choosing which items to monitor can be overwhelming. There are roughly 100 different performance objects for any given system. (You can monitor the local system or a remote one.) Each object contains counters (too many to know them all). After you have all your counters set up, you can change the way they display. For example, you can change the line colors for each counter to make it easier to determine which line you are watching. You can change the format of the display from a graph to a histogram to a report (numeric display).
Data collector sets allow you to use either system-defined sets (there is one for System Diagnostics and one for System Performance) or you can use a user-defined set (which is empty to start with; you literally have to create your own). You can also look at event trace sessions and startup event trace sessions.
The goal is to use the data collector set to collect the data, and then use the Report sections to view the data collected. Figure 9.6 shows the results of running a System Diagnostics report and then viewing the results in the Reports section.

Note
The simplest way to run the diagnostic test is to open a command prompt (elevated or nonelevated; it will ask you for permission to proceed if it is nonelevated) and then enter perfmon /report. Note that if you want to run a different data collector set, you can enter perfmon /report name of data collector set to start it.
Task Manager, for many of us, is our “go-to” tool for problems. You have a problem, you go to Task Manager. It’s almost ingrained in us. You’ll immediately see information about your processes, CPU usage, memory, network, and so forth. So, any changes that can benefit us are noteworthy. To open Task Manager, you can use the shortcut keys (Ctrl+Shift+Esc) for the fastest approach. You can also hit Ctrl+Alt+Delete and choose Start Task Manager. Or, you can use the Instant Search off the Start menu and type Task Manager.
For one thing, the first time you start it, you’ll notice that you can view just your own user. However, you can choose to see processes from all the users of the system. Another thing you’ll notice right away is the description aspect to the Processes tab, which was added with Windows Vista.
One new feature of Task Manager is the ability to create a mini dump file of a running application. You can right-click a running application or process and choose Create Dump File (see Figure 9.7), which contains information about the line or area of memory that the system crashed at and can be used by experts to figure out what is causing the crash. A dialog will then display showing you where that file has been written. You can use this feature to discover why a particular application may be crashing so often; or if a process has already crashed and is no longer responding, you can try to discover the cause.
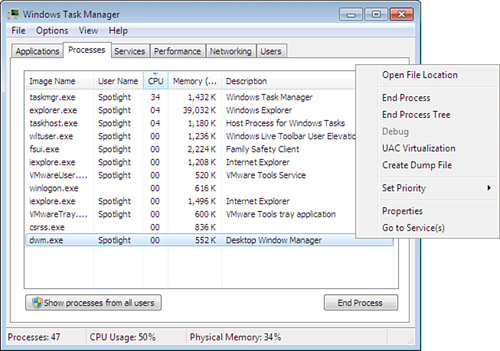
There is also a Services tab. From here, you can see all your services, some descriptive information about them (description and group information), and whether they are running. You can stop or start services from here. So, you don’t have to open up your Services console to simply stop and start a service. You still need to use that console if you want to do any permanent service adjustment (disabling a service, for example).
You can also right-click an application and choose Properties. Doing so takes you to the properties sheet of that particular executable, where you can change things such as the compatibility options or other aspects of the program.
Under the Performance tab, there is another new feature (although you might not have noticed it). Under Physical Memory, you used to have Total, Cached, and Free. Now there is another item, Available:
• Total is the amount of RAM installed on the system in MB.
• Cached is the amount of physical RAM used for system resources.
• Available is the total of standby and free memory for programs.
• Free is the amount of memory currently unused or that doesn’t contain useful information.
Backup and restore (or recovery) involve different approaches, because we might be referring to different aspects of restore. For example, you might want to recover an entire system, or just files that have been corrupted. You may want to just go back to a point in time and restore to that point in terms of system changes but not file changes.
From within the Control Panel, a new Backup and Restore applet enables you to perform the following:
• Create a schedule and turn it on or off
• Create a system image
• Create a system repair disc
• Create a new, full backup
• Restore all users files
• Restore your system
The backup features in Vista ask whether you want to back up files or the entire computer. Windows 7 provides a few more options if you select Let Me Choose when configuring your backup. You can determine if you want a library, a folder, a drive, or other items. You can even include a system image (a copy of the drives required for Windows to run and that be used to restore your computer if Windows stops working). If you select Let Windows Choose, every user will be backed up, and a system image will automatically be created.
For additional recovery methods, you can choose the Recovery applet in Control Panel. You will then be shown an option to go to the System Restore options we discussed in Chapter 8, “Management Options in Windows 7.” Or you can click the Advanced Recovery Methods link, which takes you to two options:
• Use a System Image You Created Earlier to Recover Your Computer: If you have created a system image, you can use it to replace everything on this computer, including Windows, your programs, and all your files, with the information saved on the system image.
• Reinstall Windows (requires Windows installation disc). This option reinstalls Windows on your computer. Afterward, you can restore your files from a backup. Any programs you’ve installed must be reinstalled using the original installation discs or files. Existing files might remain in the Windows.old folder on your hard disk after the reinstall completes.
The Troubleshooting applet in the Control Panel is more of a station that leads off to all the troubleshooting tools within Windows 7. Consider it an easy place to go if you are having a problem but don’t know where to begin. Notice in Figure 9.8 how diverse the different tools are. However, the troubleshooting packs you initially see are not every pack that exists. If you click the View All link, you are shown all your packs and their descriptions.
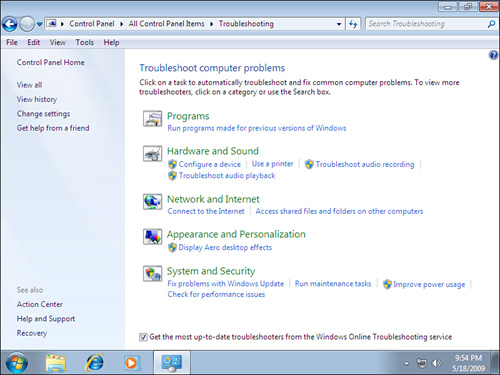
You can click the View History link to show which tools you have run and when. You can clear the history, view details, or search for help.
You can click Change Settings to alter settings that relate to computer maintenance. For example, you can turn off the System Maintenance troubleshooter if you like, which checks for routine maintenance issues and notifies you. You have other option check boxes, such as these:
• Allow Users to Browse for Troubleshooters Available from the Windows Online Troubleshooting Service
• Allow Troubleshooting to Begin Immediately When Started
Last but not least, you can click the Get Help from a Friend link. Doing so takes you to the Remote Assistance tools. From here, you can connect to another person who can help to fix your problem. There is also an Offer Remote Assistance to Someone link (see Figure 9.9).
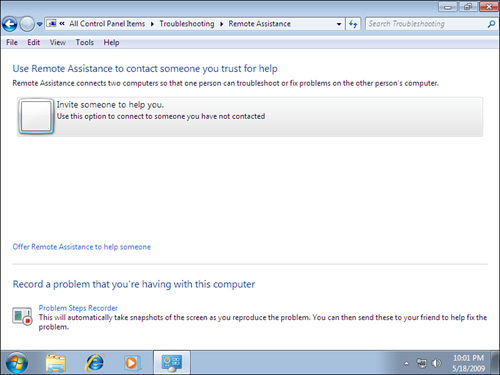
You might notice down at the bottom of the Remote Assistance options, out of nowhere, there is a link to the Problem Steps Recorder.
If you click your Start orb and type Recorder, and you will see two items. One is the Sound Recorder. The other is Record Steps to Reproduce a Problem, which leads to the Problem Steps Recorder (PSR). As you saw in the preceding section, you can also locate a link to it from Remote Assistance (which is logical, because the two do work hand in hand).
With the PSR, you click the Start Record button (see Figure 9.10), and then click through whatever issue you are having. When you have finished, click Stop Record. You can click Add Comment at any point to highlight the problem and to make notes.

When you click Stop Record, a Zip file is created. Inside is an MHTML document that you can open in Internet Explorer; it shows all the items you selected as screenshots with green boxes surrounding the items you clicked. You will also see any comments you added. In addition, the Additional Details section shows step-by-step what you were recording.
You can email this document to others for help troubleshooting the issue you are experiencing.