
MARKETS: CAN YOU TRUST THEM?
INTRODUCTION
How do managers know whether they are managing the company in the best interests of the owners? If financial markets are efficient, the answer is simple: Managers should monitor the share price of the company’s common stock to find out what public investors think about the company, its future prospects, and its management decisions. And what should managers do to maximize share price? Well, they need to understand how investors value common stock so that they can identify and implement value-maximizing operating and financing policies.
Let’s consider the notion of financial market efficiency first—perhaps the most critical requirement for relying on market prices for allocating resources and evaluating management. For if markets are not efficient, the case for a market-based governance system all but disappears. We’ll take up the valuation story in the next chapter.
FINANCIAL MARKET EFFICIENCY
Market prices must reflect the true value of a company and its economic prospects if a market-based corporate governance system based on shareholder wealth maximization is to work as intended. But what do we mean by the true value? How do we measure it? And how do we know that the markets (investors) are pricing the company properly?
Financial economists believe that the true value of a company is what investors will pay for that company based on all of its expected future returns to its owners. By all, we mean not only today’s and tomorrow’s returns, but also returns ten, twenty, or fifty years from now. What this definition means for stock prices is that in efficient financial markets, all information about the company that is presently available must be embedded in the price of the company’s common stock. Thus, financial markets are deemed efficient if all information about the company is reflected in its stock price, thereby eliminating any opportunities for investors to earn returns greater than a fair risk-adjusted return on investment. In other words, no money trees or free lunches exist. But how do you know whether all the information about the company is embedded in the stock’s price and, if it is, that the price reflects the true value? Well, with respect to the information question, financial market efficiency is typically divided into three categories: weak-form or informational efficiency, semistrong-form efficiency, and strong-form efficiency.
Weak-Form Efficiency (Past Prices)
Markets are weak-form (weakly) efficient when knowledge of past price changes does not help in predicting deviations from expected future price changes. Look at Figure 3-1, which is a scatter diagram of weekly percentage price changes for Ford Motor Company’s common stock in 1999 plotted against its previous week’s percentage price changes. Do you see any patterns? You shouldn’t, because the R-squared for the two series—a statistical measure of the amount of the variation in today’s price changes that can be explained by having knowledge of yesterday’s price changes—is 0.40 percent. In other words, less than 0.4 percent of this week’s change in Ford’s stock price can be predicted from knowledge of last week’s price change; the remaining 99.6 percent is due to other factors.
FIGURE 3-1 SCATTER DIAGRAM OF WEEKLY PERCENTAGE PRICE CHANGES IN FORD MOTOR COMMON STOCK VERSUS PREVIOUS WEEK PERCENTAGE PRICE CHANGES DURING 1999
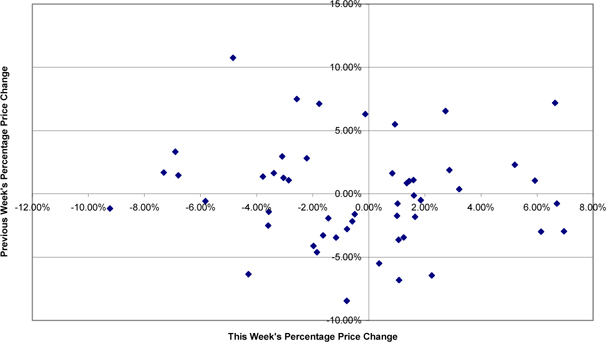
We conclude from this result that the market for Ford common stock is informationally efficient. The information contained in past price changes cannot be used to predict future price changes; there are no free lunches here!
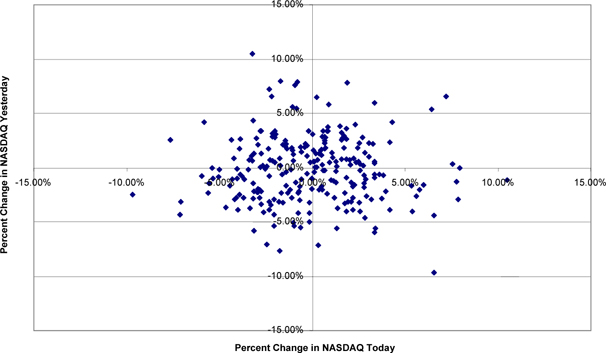
Figure 3-2 contains a graph of daily closing prices for the NASDAQ index for 2000. To the naked eye, it looks as if a downward trend may have existed throughout 2000, and, a trend line fitted to the data suggests this as well. But before you jump to any conclusions, look at Figure 3-3, which depicts a scatter diagram for the NASDAQ index daily returns (daily price changes) during 2000. Now, this diagram shows no relationship between one day’s price change and the previous day’s price change—something that you would have expected if a ‘‘real’’ downward trend existed. In fact, if we use the price changes from the previous two days, we still have no predictive value. Price changes for the previous two days explain less than two-tenths of a percent of today’s price change—a statistically insignificant relationship.
Does this mean that the level of NASDAQ prices reflected the true fundamental intrinsic value of technology stocks? Does it mean that the NASDAQ was ‘‘overvalued’’ at 5000 in March 2000? No, it means only that the previous day’s price changes cannot predict future price changes; the changes cannot tell you whether the stocks are over- or undervalued.
FIGURE 3-2 DAILY CLOSING PRICES FOR NASDAQ INDEX, 2000

FIGURE 3-3 DAILY NASDAQ RETURNS PLOTTED AGAINST PREVIOUS DAY’S RETURNS, 2000
Financial economists and countless numbers of Ph.D. candidates have done all sorts of statistical tests trying to find exceptions to these outcomes. After all, once you found one, you could become rich! But, of course, anyone who did find an exception would not publish it; that person would keep it to him- or herself. Only if it didn’t work would you try to sell it to the general public, which should tell you something about how much subscriptions to technical forecasting services are worth. Okay, anomalies do exist; we’ll come back to them later.
Semistrong-Form Efficiency (Public Information)
Security prices in semistrong-form-efficient markets incorporate all publicly available information. This information includes news releases about earnings, cash dividends, new product ventures, plant expansions, and so on. In other words, once you’ve read about the event in the papers, it’s too late to make money on the news; it’s already in the stock price.
An extensive body of empirical evidence supports the hypothesis of semistrong-form efficiency. Typically, these studies use a technique called event analysis, an analytical procedure that measures what is called a stock’s abnormal return around news announcement dates. An abnormal return is a return greater than (positive) or less than (negative) expected given what went on in the stock market that day.
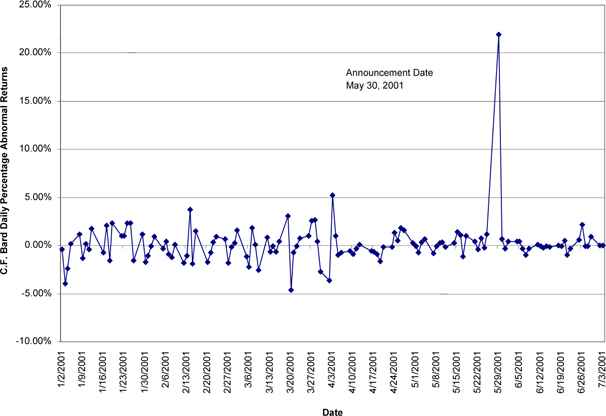
For example, on Wednesday, May 30, 2001, Tyco announced that it would buy C.R. Bard, a maker of health-care products, for $60.00 a share. On Tuesday, May 29, C.R. Bard stock closed at $46.00 a share. On Wednesday, the day of the announcement, the stock closed at $56.09 a share, so the total daily return was 21.93 percent. However, the overall market, as measured by the Standard & Poor’s 500 Stock Index, fell by 1.57 percent. Therefore, the abnormal return on C.R. Bard was 23.50 percent, calculated as the actual return on C.R. Bard minus the return on the S&P 500 index, or 21.93%–(–1.57%) = 23.50%.
We have plotted the abnormal returns for C.R. Bard in Figure 3-4. Observe that, except for the day of the merger announcement, they bounce around zero. But look at the spike for May 30, the day of the merger announcement; it is way outside the band. Also note that the day after the announcement, the abnormal returns fall back to within the normal band and stay there. In other words, no unusual (technically, statistically significant) daily returns precede or follow the announcement-day returns. This pattern is what we would expect in efficient markets.
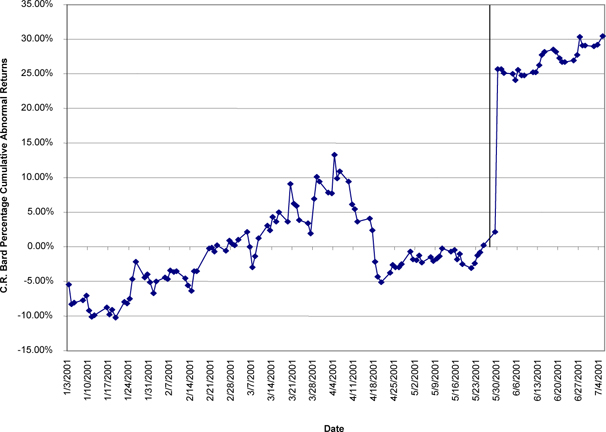
These daily abnormal returns can be summed together, in which case they are called cumulative abnormal returns. We have plotted these for C.F. Bard and for Tyco in Figures 3-5 and 3-6, beginning with January 3, 2001. For example, on January 3, the abnormal return for C.F. Bard was –5.42 percent; on January 4, it was –2.90 percent; and on January 5, 0.21 percent. The cumulative abnormal returns for C.F. Bard, starting from January 3, then are –5.42 percent, –8.32 percent, and –8.11 percent. Subsequent values are calculated by adding that day’s abnormal return to the previous day’s cumulative abnormal return.
FIGURE 3-4 DAILY ABNORMAL PERCENTAGE RETURNS OF C.R. BARD
In efficient markets, these cumulative abnormal returns should not exhibit any trend; they should bounce around zero, just as the daily abnormal returns do. Any major price changes due to news, such as a merger announcement, should be incorporated into the stock’s price and cumulative abnormal returns on the announcement date, with subsequent cumulative abnormal returns once again not exhibiting any trend.
FIGURE 3-5 C.R. BARD CUMULATIVE PERCENTAGE RETURNS AROUND MAY 30, 2001 ANNOUNCEMENT OF ACQUISITION BY TYCO
So, what would be some telltale signs of market inefficiencies with respect to stock price reactions to news? Well, Figures 3-7 and 3-8 contain two examples, one of underreaction and the other of overreaction. In the case of an underreaction, the stock price gradually adjusts to the news; in the case of an overreaction, the stock price increases (decreases) by an ‘‘excessive’’ amount and then falls back (rises) to the ‘‘appropriate’’ value. In both cases, a money tree exists because a trading rule can be used to capture profits. In the case of underreactions, buy (sell short) immediately on good (bad) news and watch the stock price adjust. In the case of overreactions, sell short (buy) on good (bad) news and buy (sell) after the correction has occurred.
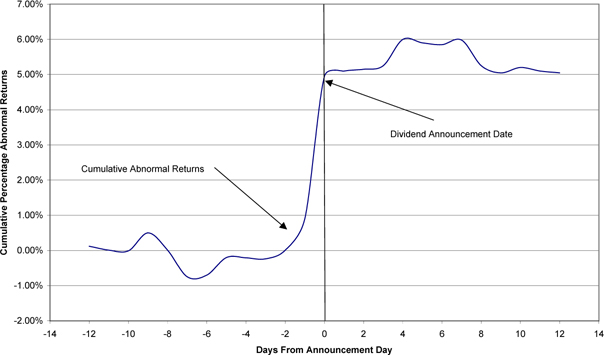
Figure 3-9 contains a plot of cumulative returns prior to and after announcements of initial dividend payments for over 200 companies. We can draw two conclusions from this graph: First, initial dividend payments were greeted as good news by investors, and second, investors immediately incorporated the news of the initial dividend payment into stock prices. No rise (or fall) in price persisted in the days following the announcement. No rise in stock prices occurred prior to the announcement. And stock prices did not over- or underreact to the announcement.
FIGURE 3-6 TYCO CUMULATIVE DAILY ABNORMAL RETURNS AROUND C.R. BARD MAY 30, 2001, ACQUISITION ANNOUNCEMENT
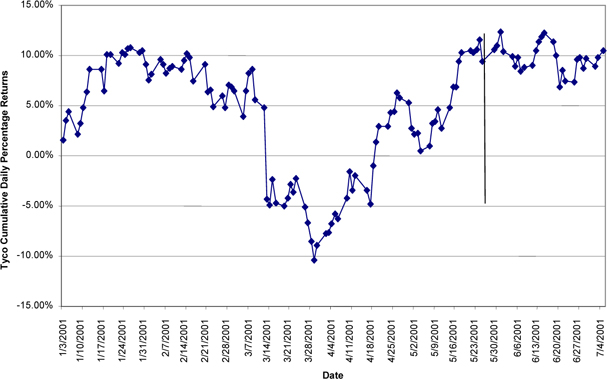
FIGURE 3-7 AN EXAMPLE OF UNDERREACTION TO NEWS ON DAY 0
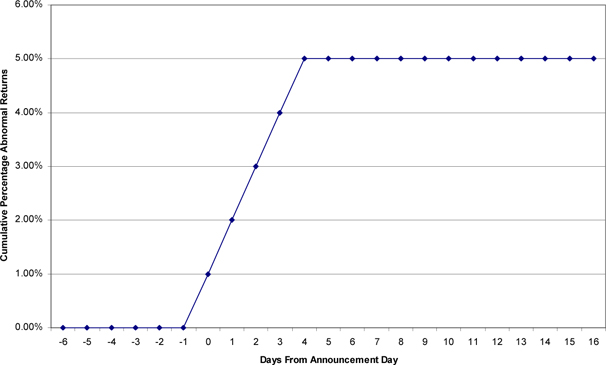
FIGURE 3-8 AN EXAMPLE OF PRICES OVERREACTING TO NEWS ON DAY 0
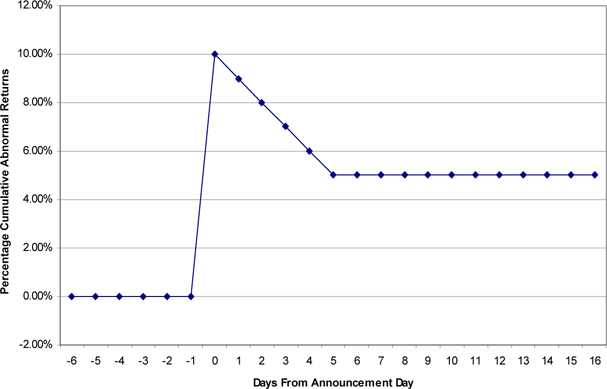
FIGURE 3-9 CUMULATIVE ABNORMAL RETURNS FOR INITIAL DIVIDEND ANNOUNCEMENTS
The evidence with regard to semistrong-form market efficiency is overwhelming. For all practical purposes, news about financing, investment, dividend, and organizational restructuring decisions (such as mergers and acquisitions) is immediately reflected in market prices. We will use the findings of many of these studies in subsequent chapters to explain the connections between managerial decisions and shareholder wealth maximization.
Strong-Form Efficiency
Strong-form-efficient markets incorporate private as well as public information in security prices. Obviously, managers and other insiders have information that they can trade on before the information becomes public. So, the potential exists for managers to make a small fortune by taking advantage of this informational asymmetry. This poses a serious problem for governance and for regulation of financial markets.
If public investors believe that managers and other insiders will take advantage of their privileged information, these investors will be reluctant to invest in the company or will do so only at a highly discounted price. In effect, if this happens, investors can no longer assume that market prices represent the true value of the company. To prevent such a breakdown in markets, a market-based governance structure requires insider-trading laws to maintain the public’s confidence. Therefore, as a manager, you are not permitted to act on inside information. You can try, but it is illegal, and you may end up in jail—especially if you are too greedy about it!
More to the point with regard to the question of whether financial markets are strong-form-efficient is the question of whether professional investors can consistently outperform or ‘‘beat’’ the market. This proposition has been tested by examining whether professional mutual fund managers can outperform randomly constructed stock portfolios or index funds. Time and again, the answer is no.
One of the most widely regarded studies of mutual fund performance was done by Burton Malkiel, who examined the returns from investing in mutual funds between 1971 and 1991. He concluded that
[his] study of mutual funds does not provide any reason to abandon a belief that securities markets are remarkably efficient. Most investors would be considerably better off by purchasing a low expense index fund, than by trying to select an active fund manager who appears to posses a ‘‘hot hand.’’ Since active management generally fails to provide excess returns and tends to generate greater tax burdens for investors, the advantage of passive management holds, a fortiori.1
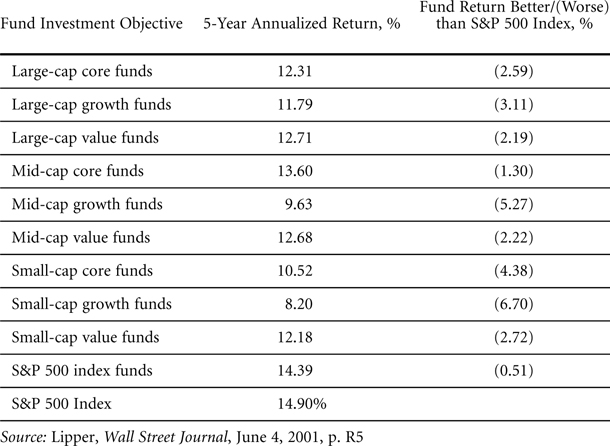
Figure 3-10 provides some less scientific evidence. This figure contains annualized five-year returns for various categories of general stock mutual funds for May 1996 through May 2001. Not a single group of funds was able to outperform the S&P 500 index. And the best-performing fund group was the one that followed the passive investment strategy recommended by Malkiel—that of indexing on the S&P 500.
FIGURE 3-10 5-YEAR ANNUALIZED PERFORMANCE OF GENERAL STOCK FUNDS VERSUS THE S&P 500 INDEX
MARKET INEFFICIENCIES AND ANOMALIES
Do market inefficiencies exist? A number of anomalies have been identified and remain largely unexplained. For managers, arguably the two most important anomalies are the price behavior of (1) initial public offerings (IPOs) and (2) earnings announcements.
IPOs
Perhaps because they remain an enigma, IPOs have fascinated financial economists and practitioners for years. Here’s why. The typical IPO is underpriced. By underpriced, we mean that the price at which its shares are offered to the public (something of a misnomer because institutions are often the initial buyers) is, on average, about 10 to 12 percent below the first trading price (the first secondary-market transaction price). In the 1990s, this underpricing was even greater, especially among high-tech and Internet IPOs. For example, on August 5, 1995, Netscape went public at an offering price of $28 a share. At the end of trading on the first day, the price was $54—almost double the offering price. In the jargon of finance, the founders of Netscape ‘‘left a lot of money on the table.’’ Why wasn’t the stock priced much higher?
How about this one? On March 31, 2000, ArrowPoint Communications Inc. went public at $34 a share on the NASDAQ. Late in the afternoon of March 31, the shares traded at $96, for an underpricing of $62 a share! Arrow-Point had about 34.2 million shares outstanding after the IPO, so the company left $2,120,400,000 on the table.
Here’s another puzzle: The stock price of the typical IPO does worse than the average stock (underperforms the market) during its first three years of trading. Why? Do investors overprice the stock initially? If so, why don’t investors learn from past experiences? We don’t know. We just know that both this underperformance and the aforementioned underpricing occur in just about every country.2
Earnings Announcements
Publicly owned corporations publish quarterly financial statements that include quarterly earnings. In efficient markets, any earnings ‘‘surprises’’ should be immediately incorporated into the company’s stock price. However, the evidence suggests that they are not.
The stock price of a company that announces a very negative earnings surprise (earnings are way below expectations) drifts downward for about ninety days after the announcement of the surprise. The stock price of a company that announces a very positive earnings surprise does just the opposite: The stock price of such a company drifts upward for about ninety days.3
Why? We don’t know.
The 2000 NASDAQ Crash
On March 10, 2000, the NASDAQ closed at 5048. By the end of the year, the index stood at 2470, for a loss of almost 50 percent. Is this drop consistent with notions of market efficiency? Or is it more consistent with some notion of an irrational speculative bubble and grounds for rejecting any assertions that market prices reflect true intrinsic fundamental values? After all, how can you explain why Cisco could be worth $137 a share on March 10, 2000, and only $38.25 a share at year-end? Well, here the advocates of financial market efficiency draw an important distinction between the absolute level of prices and relative prices.
Suppose investors accepted the proposition that the most recent price of a stock was the best estimate of its intrinsic value. In our example, on March 10, 2000, that would be $137 for Cisco. Then, as news arrived about the company, the most recent price would move up or down accordingly. But what if investors were to collectively decide that $137 was no longer the appropriate benchmark against which to price daily news because they had lost confidence in the prospects for all ‘‘new-economy’’ companies. Now we could have a major price drop or increase as investors revised their notion of what Cisco’s absolute price should be. Furthermore, other new-economy companies such as Altera Corporation and Intel Corporation would experience similar price drops. So, where are we?
Well, while we might question whether absolute stock prices are good indicators of intrinsic value, we remain on rather firm ground if we stick with relative price changes. For example, if Cisco’s earnings prospects improve substantially relative to those of other new-economy companies, we can be pretty sure that this will result in an increase in Cisco’s stock price relative to the prices of the other companies. And, for managers who want to know what investors think about their performance relative to that of their competitors, this is what is critical.
WHAT MARKET EFFICIENCY MEANS FOR MANAGERS AND GOVERNANCE
Arguably, the most important message of market efficiency for managers is that the company’s stock price is a reliable measure of whether managers are running the company in the long-run best interests of the shareholders. Also, changes in the stock price provide information about whether managerial investment and financing decisions are value-creating or value-destroying.
How Are We Doing?
For example, on February 21, 2001, Procter & Gamble and Coca-Cola announced a $4.25 billion joint venture to sell juice, juice-based drinks, and snacks. The venture was to be a limited-liability company with 50 percent owned by Procter & Gamble and 50 percent owned by Coca-Cola. Coca-Cola would transfer its entire Minute Maid juice line to the venture, and Procter & Gamble would transfer two brands: Sunny Delight Drinks and Pringles potato chips. Was this a good deal for both companies, a good deal for neither, or good for one and bad for the other? What about in total? To answer these questions, we can look at what happened to the stock prices and market values of these two companies on the announcement day. The data are contained in Figure 3-11.
On the day of the announcement, Procter & Gamble stock rose 1.44 percent, from $75.71 to $76.80 a share. However, the overall market, as measured by the S&P 500 index, fell by 0.98 percent. Thus, after taking the overall market into account, the abnormal return for Procter & Gamble was a positive 2.42 percent. With 1.3 billion shares outstanding, the dollar value of this joint venture to Procter & Gamble shareholders was $2.381 billion. P&G management can conclude that they have made an investment (adopted a strategy) that was good for the owners of P&G.
The same cannot be said for Coca-Cola (Coke). Coke’s stock price fell 5.99 percent, from $58.42 to $54.92, for a loss in total market value of $8.715 billion. Adjusted for the overall market, the abnormal dollar loss was $7.289 billion. Thus, when Coke’s managers looked to see what investors— including institutional investors—thought of their strategy, the answer is, ‘‘Not much.’’ Coke’s managers destroyed value.
FIGURE 3-11 VALUATION EFFECTS OF PROCTER & GAMBLE AND COCA-COLA JOINT VENTURE ANNOUNCEMENT, FEBRUARY 21, 2001
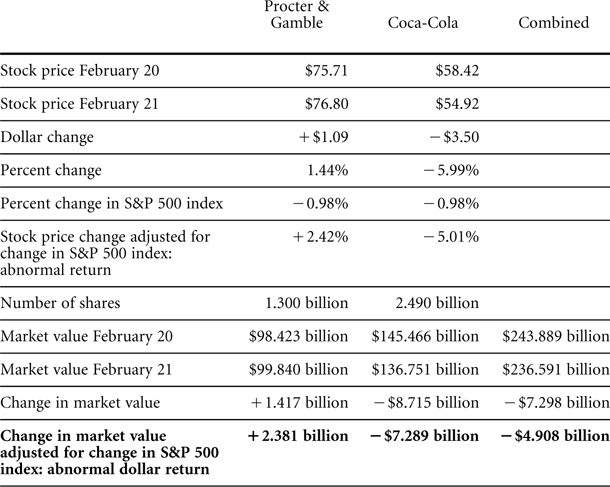
What about the overall value of this proposed joint venture? Did investors think the project would be value-creating or value-destroying on a combined basis? Well, investors didn’t like the overall project. The combined market value of both companies, adjusted for the market, fell by $4.908 billion. What this negative value means is that investors believed the project should never have been undertaken.
Interestingly, on July 5, 2001, the two companies jointly announced that they were rethinking the deal. Market analysts ascribed the rethinking to P&G’s getting the better of the deal. One analyst even recommended that Coke walk away entirely, while another analyst suggested that Coke start its own juice division.4
Don’t Try to Outguess or Beat the Market
Corporate managers, especially financial managers, must develop and implement plans for financing the company and managing its financial risks. The financing decisions involve choices about when to raise capital and whether to use debt or equity. The risk management decisions involve choices about whether to hedge exchange-rate, interest-rate, and commodity-price risks.
Let’s take the case of a manager who needs to raise $300 million to finance a major expansion program. The manager could sell either bonds or common stock. Should the manager make this decision on the basis of whether the stock has risen or fallen over the past year or whether interest rates are above or below some benchmark level? If financial markets are efficient, the answer to these questions is no. The current stock price is the best estimate of what the company is worth, and, as we showed earlier, past stock prices cannot be used to predict future stock prices. In effect, the manager is assuming that he can beat the market if he conditions the decision about selling stock on whether the stock has moved up or down in the last month, quarter, or year. Think of it this way: If professional mutual fund managers cannot predict what the market will do, why should the manager of a business firm be any more successful?
The same holds true for interest rates. Investors’ and borrowers’ expectations of interest rates are captured in the yield curve or term structure of interest rates and in the prices of interest-rate financial contracts. The manager, by taking a view on whether interest rates will be lower or higher in the future, is, in effect, trying to outguess the market. Again, the overwhelming evidence is that hardly anyone has been able to do so consistently.
What holds for stock prices and interest rates also holds for foreign exchange rates and commodity prices. Taking a position on exchange rates or commodity prices can be dangerous. The objective should be to stabilize cash flows and protect the firm from exchange-rate and commodity-price volatility through risk management strategies rather than trying to play the foreign exchange markets.
Don’t Try to Fool Investors
Managers who believe that investors are myopic and focus only on short-term financial results may try to manipulate earnings through creative accounting techniques—legal, illegal, and otherwise. Such measures include booking transfers of inventory as sales, writing up assets, selective booking of sales and expenses, and keeping debt off the balance sheet.
Don’t do it. Eventually, investors will see through legal ways of manipulating earnings. They may miss the illegal ones, but, should these methods come to light, the consequences for the managers could be severe, including criminal prosecution for fraud.
For example, the penalties paid by Enron for using aggressive accounting procedures such as keeping debt off its balance sheet and manipulating earnings have been enormous. The company was forced to file for bankruptcy, and its senior managers have suffered severe damage to their reputations and financial positions and face civil and criminal charges. Enron’s auditor, Arthur Andersen, has suffered similar consequences. The firm has lost numerous audit clients and now no longer exists as an independent firm.
Other companies have also paid a price for the Enron-Andersen fiasco. A new term, the ‘‘Enron premium,’’ has entered Wall Street’s vocabulary. The term refers to the drop in stock prices suffered by many firms as investors began looking around for other Enrons.
Some additional examples of the trouble managers get into when they pursue accounting policies that are aggressive at best include the following:5
![]() An ex-vice chairman of Coca-Cola pleaded guilty in September 2001 to concealing expenses at Aurora Foods.
An ex-vice chairman of Coca-Cola pleaded guilty in September 2001 to concealing expenses at Aurora Foods.
![]() A past CFO of Lesley Fay was sentenced in February 2002 to nine years in prison for a variety of sales-padding ploys.
A past CFO of Lesley Fay was sentenced in February 2002 to nine years in prison for a variety of sales-padding ploys.
![]() Two managers of Sirena Apparel pleaded guilty to revenue-inflating schemes.
Two managers of Sirena Apparel pleaded guilty to revenue-inflating schemes.
![]() David Thatcher, president of Critical Path, Incorporated, pleaded guilty to faking or backdating sales to meet quarterly revenue targets.
David Thatcher, president of Critical Path, Incorporated, pleaded guilty to faking or backdating sales to meet quarterly revenue targets.
We’ll have more to say about possible connections between these attempts to inflate earnings and stock prices when we consider management compensation schemes.
TRANSPARENCY AND MARKET EFFICIENCY
We cannot emphasize enough that if markets are to be efficient, investors must receive trustworthy financial information about companies. The public policy question is how to ensure that this happens.
In the United States, the financial reporting rules that companies must follow are established by a privately funded group called the Financial Accounting Standards Board, better known as FASB. Who funds FASB? The major accounting firms that audit the financial statements of publicly held corporations. Well, so far so good. But, what happens when the major accounting firms that fund and control FASB begin to do consulting for the same firms whose books they audit? And what happens when the auditors are effectively chosen by the management of the audited companies rather than by the shareholders (who, in theory, are doing the selecting through the board of directors)?
Well, at least two bad things can happen. One is that the accounting rules will be promulgated in such a way that they work to the advantage of the firms being audited, thereby encouraging the aggressive accounting that has become associated with Enron, Global Crossing, Tyco, Boston Chicken, and other firms that are now in the public limelight. The other is that the auditors, as they make more and more money from selling consulting services to their auditing clients, will conspire with management to make the company look good, or at least look the other way while the company engages in questionable financial reporting practices. Both outcomes are bad for public investors and bad for financial markets.
How important is the consulting business to the firms that audit the books of major corporations? Based on recent SEC filings (see Figure 3-12), almost every company in the Dow Jones Industrial Average paid its auditors more for consulting and other services than for auditing the books. Since 1970, auditing fees for the big accounting firms have fallen from 70 percent of total revenue to about 34 percent. Furthermore, the accounting firm partners who bring in the consulting fees are more highly paid than those that do just the auditing, thereby exacerbating an already potentially destructive conflict of interest between the auditor’s role of verifying the financial statements for the public shareholders and the profits of the firms that do the auditing.
What is the solution? The following have been proposed:
![]() Prohibit auditors from also selling consulting services to their clients. Either be an auditor or a consultant.
Prohibit auditors from also selling consulting services to their clients. Either be an auditor or a consultant.
![]() Have a government agency take over the role of FASB and set the accounting standards.
Have a government agency take over the role of FASB and set the accounting standards.
![]() Require corporations to change auditors every three or five years.
Require corporations to change auditors every three or five years.
![]() Require the CEO and the board of directors to personally certify the integrity of the financial statements.
Require the CEO and the board of directors to personally certify the integrity of the financial statements.
![]() Hold the CEO and the board of directors criminally liable if the company fails to comply with accounting rules and/or issues false or misleading information.
Hold the CEO and the board of directors criminally liable if the company fails to comply with accounting rules and/or issues false or misleading information.
FIGURE 3-12 AUDIT AND NONAUDIT FEES PAID BY THE COMPANIES IN THE DOW JONES INDUSTRIAL AVERAGE 2000 AND 2001 PROXY STATEMENTS
