Chapter 5
The Impact of Politics and Regulation on Investing
I don't make jokes. I just watch the government and report the facts.
– Will Rogers
If you have ten thousand regulations you destroy all respect for the law.
– Winston Churchill
Giving money and power to government is like giving whiskey and car keys to teenage boys.
– P.J. O'Rourke
Politics is the art of looking for trouble, finding it everywhere, diagnosing it incorrectly, and applying the wrong remedies.
– Groucho Marx
Successful investing requires keeping a close eye on government, yours and any other nation in which you invest or that trades with a region in which you invest. You've probably heard the phrase, “Don't fight the Fed” while watching the news. The phrase speaks to the ability of central banks and politicians to impact the economy, an industry, and the stock market. All the business fundamentals in the world won't save your investment if a politician manages to alter the tax code in some way that dramatically alters its industry's economics, such as the deduction on mortgage interest payments we discussed in the prior chapter. On the other hand, great fortunes have been made by accurately guessing which way the political wind is going to shift and how it will affect a particular industry, commodity, or company. Just look at how much wealthier many politicians are when they leave office relative to when they enter—it's not from salaries.
In Chapter 4, we showed how the political decision to increase home ownership rates contributed to the unprecedented rise in home prices and the explosion in mortgage-backed securities. Many of those that didn't see what was happening experienced painful losses. For those that did, such as Dr. Michael Burry of Scion Capital (featured in The Big Short by Michael Lewis, which we highly recommend), once-in-a-lifetime-type returns were possible.
In this chapter, we are going to focus further on how government actions and the prevailing narrative, what everyone simply knows to be true, affect investing. Government actions can have a tsunami effect on your investments, overwhelming a fundamentally sound ship by either drowning her or propelling her beyond that which she could do on her own.
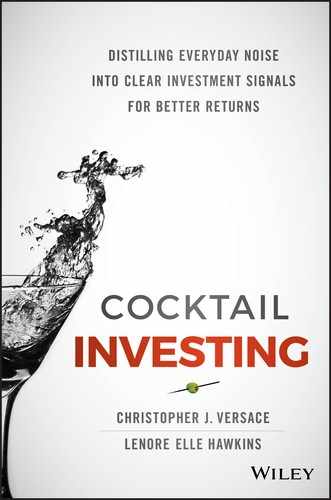
We hear a lot of talk about which government policies help or harm the economy from both sides of the aisle. How do these actions and beliefs in turn affect the investing landscape? We've already discussed the different schools of economic thought, so here is how those theories are implemented, at least in the United States. Just in case you weren't convinced that this is something you need to understand, Figure 5.1 shows the year-over-year percent change in the S&P 500 index. The shaded regions represent recessions according to the National Bureau of Economic Research.
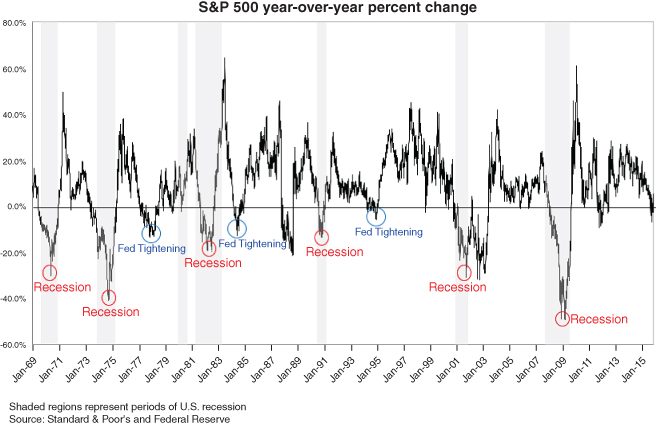
Figure 5.1 Percentage change in S&P 500 index, 1969–2015
You can see that declines in the index are not random; they occur either during a recession or when the Federal Reserve has tightened the money supply, thinking this will help to cool an overheated economy and stave off inflation.
Figure 5.2 shows the three primary levers that any government has to affect its economy: monetary, fiscal, and regulatory policy. When you hear monetary policy, think Federal Reserve, European Central Bank, Bank of Japan, or Bank of England. When you hear fiscal policy, think IRS and government spending. When you hear the term regulation, think antitrust, SEC (Securities and Exchange Commission), EPA (Environmental Protection Agency), and FDA (Food and Drug Administration), just to name a few.
Figure 5.2 Primary government policy levers
Monetary Policy
In the United States, monetary policy is under the control of the Federal Reserve, which has historically had two levers to affect the economy: the Federal Funds rate and the money supply.
The Federal Funds target rate is the interest rate at which private depository institutions, mostly banks, lend the funds they hold at the Federal Reserve to each other, generally overnight. It can be thought of as the rate banks charge each other. This target rate is identified in a meeting of the members of the Federal Open Market Committee (FOMC), which usually meets eight times a year. For years, Wall Street considered this a yawn-inducing event that was rarely even acknowledged in the media. When Alan Greenspan took over the Fed in 1987, ears started perking up. Under Greenspan, the Fed was much more active in trying to manage the economy and prevent downturns, which gave investors more confidence than they otherwise would have had that things were going to never get all that bad. They believed that if things got wobbly, the Fed would do everything it could to right the ship, which many have argued led to excessive risk-taking thanks to the perception that downside risk had been minimized.
These days, when the FOMC meeting notes are released, the analysis that each and every word receives from economists, analysts, and other pundits, ourselves included, is akin to E! Entertainment commentary of starlet attire on the red carpet. A few words here and there from this group are now able to materially move markets. That means the “Street's” interpretation of meeting notes can have a material impact on your portfolio, at least in the near to medium term.
The Federal Reserve historically has altered the money supply by increasing or decreasing required bank reserves. When the Fed increases the amount of reserves banks are required to hold it is referred to as tightening the money supply. This is typically done when the government is concerned that the economy is “overheating” (vector up and rapid velocity), which many believe leads to inflation. To understand how that works, you need to understand our banking system.
The United States, along with much of the world, has a fractional reserve banking system, the understanding of which is vital to appreciate the 2008 financial crisis. If you want to understand how fractional reserve banking works, which will undoubtedly make you the center of attention at your next dinner party, whiten your teeth, and take inches off your waist, we recommend reading this next section. You can skip it if you'd like, although you won't understand why is it that the money you deposit into your checking account is no longer yours! Got your attention, didn't we?
Fractional Reserve Banking
The earliest forms of banking consisted primarily of money warehouses, where a depositor received a “receipt” stating the amount of “money,” typically gold, that had been deposited. These receipts could be used as a form of currency. The bank could not touch the actual deposits. The money was simply stored like any other good, similar to the way today you store those itchy sweaters Aunt Betty knitted along with your 1970s record collection at a self-storage facility. Banks, like a storage facility, would charge a fee for holding the depositor's funds. However, some banks attempted to use the funds deposited with them for other purposes and proposed that the funds in fact belonged to the banks and were an implied loan rather than a deposit. The legal basis for this was established through a series of court cases in England from Can vs. Can in 1811 to Foley vs. Hill and Other in 1848 (we told you Lenore seriously geeks out on this).
In fractional reserve banking, the bank owns the depositors' funds. Yep, you read that right—funny what you find when you read the fine print when opening an account. Bank of America, Citibank, Wells Fargo, and U.S. Bank all own the money in your checking account. The money you deposited is a loan to the bank, which can then be loaned to another party, or invested, as long as the bank conforms to regulations. Banks generate revenue through the difference between the fee charged to the borrower and the interest paid to the depositor or through investment returns. The term fractional refers to the practice of keeping some fraction of the deposits in a “reserve” in order to meet any foreseeable demand for deposits.
In this form of banking, a bank is literally inherently bankrupt; the bank's short-term liabilities are in excess of its short-term assets. All depositors can demand immediate payment of their deposits; however, no bank under the fractional reserve system could actually honor this demand because it simply doesn't have that much cash available. Thus comes the term bank runs, whereby a bank is immediately bankrupt when a sufficient portion of its depositors attempt to withdraw their funds. This is partly why most countries have some form of depository insurance such as the FDIC (Federal Deposit Insurance Corporation) in the United States, which guarantees some portion of deposits in an attempt to prevent bank runs. And what about online and mobile banking? We'll talk about that in the next chapter.
The central bank (in the United States the Federal Reserve, in Europe the European Central Bank, and in Japan the Bank of Japan) defines the reserve requirement, which is the minimum fraction of the deposits that must be held in reserves. If the reserve requirement is 20 percent and the bank has $100 in deposits, it must place $20 in reserves.
The simplest explanation for the banking crisis in 2007 that precipitated the 2008 financial crisis is that the banks placed deposits in investments that declined significantly in value. In the previous example, the $80 that the bank was free to use was invested in activities that left it worth, say, $25. The bank has “loans” from depositors (your checking account balance) for $100 that can be called at a moment's notice, and only $45 to meet those demands ($20 reserves + $25 current value of investments). As of the beginning of 2015, the FDIC attempts to limit this risk by guaranteeing that up to $250,000 in deposits will be guaranteed by the FDIC.
According to a series of regulations and legislative acts, banks were given “extra bonus points” for holding government or quasi-government bonds, such as mortgage-backed securities issued by the government-sponsored enterprises Fannie Mae and Freddie Mac. These “extra special bonus points” meant that if they held these bonds, their reserve requirements were reduced. Using the example above with the 20 percent reserve requirement, this meant that if banks held these types of assets, rather than having to keep 20 percent in reserve, they could keep 10 percent. Please note that these aren't the exact numbers; we're using simplified math as it is the concept that is important here, not the actual figures. This meant that rather than only being able to loan out $80, they could now loan out $90, which meant they make more money! The same general system is in place in many other countries, including in Europe, where banks get “extra bonus points” for specified types of bonds, primarily those which are government or quasi-government issued.
Now you're probably scratching your head and asking yourself, “How does this relate to inflation?” Or perhaps we've lost your attention a bit and you're thinking about what to have for dinner tonight. Hang in there; you'll thank us later!
Using our first example where depositors put $100 into the bank, the bank can then lend $80 out to a business. There is now $180 in our simple economy. The original depositors can write checks against the $100 they deposited and the borrower can spend the $80 the bank loaned him. That means the supply of money increased by 80 percent. But we aren't done yet. The $80 that the first bank loaned out is then used to purchase a piece of equipment. The vendor deposits this $80 into his bank. This bank places $16 (20 percent of $80) in reserves and loans out the remaining $64. The supply of money has now increased to $244 ($100 + $80 + $64), which is a 144 percent increase. This process can continue again and again and is referred to as the “multiplier effect.” Under a 20 percent reserve requirement, the multiplier effect would cause the initial $100 money supply to increase to $500 ($100/0.20), a 5× effect.
The Monetary Control Act (MCA) of 1980 authorized the Fed to impose a reserve requirement of 8 to 14 percent. As of December 2006, the reserve requirement in the United States was 10 percent on transaction deposits over $55.2 million, 3 percent for $10.7 to 55.2 million, and 0 percent is required for the first $10.7 million in deposits, effective December 31, 2009. The resulting multiplier has, until recently, been estimated at 7.7× to 8.5× for M2.1 The Fed stopped publishing M3 in March 2006; thus, we are only able to estimate the multiplier effect on M3 at around 10×.
What happens when the supply of something go up? Prices go down.
For money, this means loss of purchasing power, which means that each dollar buys you less stuff. If the quantity of goods available for purchase remains constant, and the supply of money to purchase those goods increases, the price of the goods will rise. You need more dollars to buy the same amount of stuff. The supply of money available in the market then can be altered by increasing or decreasing the reserve requirements, by giving banks credit in their reserves, or by adjusting the interest rate paid to banks for the funds in their reserves.
When the money supply is increased, its impact is not felt immediately. Thus, the first to use these dollars created out of “thin air” get the benefit of pre-inflation prices. Over time, the prices of goods adjust upward from the increased supply of money. Typically, inflation most hurts those on fixed incomes (prices go up while their income stays the same) and least affects the government, whose income, namely tax receipts, is generated from personal and business income, which adjust quickly to inflationary pressures. Debt holders with fixed interest rates and incomes that adjust well to inflation will fare quite well during inflationary periods as the ratio of their loan payment to their current income drops.
For example, Bob borrows $400 at a flat 6 percent interest rate and his annual income is $80. His annual loan payment would be $24. His annual loan payment is 30 percent of his income. If inflation suddenly jumps to 8 percent annually and his income adjusts in line with inflation, by the fourth year his income would have increased to $109 and his loan payment would have dropped to 22 percent of his income. This is why we hear talk of countries using inflation to cope with their ballooning debt.
Now we're getting to the stuff that'll make you look oh-so-smart at your next cocktail party. So what's all this QE'ing?
After the financial crisis of 2008, the Federal Reserve implemented a new strategy for affecting both the money supply and interest rates called quantitative easing (QE), but to understand how that works, we first need to talk a little bit about a four-letter word that has gotten a whole lot of the world into trouble since the dawn of mankind: debt.
First, governments around the world typically spend more money than they take in every year through taxes. It is really just human nature. Desiring to keep their jobs, politicians want to get reelected, which means they have a vested interest in providing more to the electorate than they take in through taxes. This difference between tax receipts and government spending is referred to as the annual deficit. The national debt is the accumulation of all those years of deficits. In order to spend more money than it takes in, the government has to borrow. The U.S. government does this by issuing Treasury bills (loan of 1 year or less), Treasury notes (loan of 1 to 10 years), Treasury bonds (loan of 20 to 30 years), or Treasury inflation-protected securities (TIPS inflation-indexed borrowing for 5, 10, or 30 years).
The interest rate the federal government pays on the borrowed money depends on what the lenders are willing to accept. This rate changes over time and is based in part on expectations around inflation. (If you are willing to loan money at 5 percent for one year when you believe there will be no inflation, you will demand 8 percent if you think that there will be 3 percent inflation so as to still get the same effective interest rate on the loan.) Figure 5.3 shows how interest rates on Treasuries (a generic term for anything issued by the Treasury) for various lengths of borrowing from 1 month to 30 years have changed from November 10, 2006, to November 10, 2015.

Figure 5.3 Yield curve of Treasuries as of November 10, 2006, and November 10, 2015
Source: U.S. Department of Treasury
This is called the yield curve. An upward-sloping curve means that interest rates are less for short-term borrowing than long-term. An inverted yield curve means that interest rates for longer-term borrowing are lower than short-term, which is typically a sign that a recession is on its way. As you can see, in 2006, we had an inverted yield curve.
U.S. banks, as well as foreign governments, foreign banks, corporations, investment funds, and individuals, purchase Treasuries. Quantitative easing refers to the process shown in Figure 5.4 wherein the Treasury Department sells Treasuries to banks in return for cash to fund the annual deficit or to pay off Treasury bonds that are coming due (maturing). Banks then turn around and sell the Treasuries to the Federal Reserve in return for cash. This cash is typically in the form of a credit in the bank's reserve account with the Federal Reserve, but for all practical purposes it can be thought of as cash since these reserves can then be used to loan money to businesses and individuals, who then effectively have cash in hand.

Figure 5.4 Quantitative easing
So how much does monetary policy affect investing?
Well, for most of the history of the Federal Reserve there was very little relationship between the central bank and the stock market, but then Federal Reserve Chairman Alan Greenspan came along, and the concept of the Greenspan “put” evolved. The theory was that any time the economy or the markets got a bit wobbly, Chairman Greenspan would loosen monetary policy, which was viewed as stimulative to the economy—thus, the term Greenspan put, which referred to the belief that Greenspan could take actions that would successfully limit any downturn in the economy and the markets. (This is a reference to “put options,” which give the holder the right to sell at a specific price. Greenspan effectively had a put for the market, which meant there was a point at which he'd act so that the market would never go below that put price level.)
Then the financial crisis hit and we had the birth of quantitative easing. Figure 5.5, from the St. Louis Federal Reserve, shows the excess reserves held by banks at the Federal Reserve and the S&P 500 index from November 2008 to October 2014, which is the start of the first round of quantitative easing (QE 1) to the termination of the final round of quantitative easing (QE 3). During this time, the two have a correlation of 96.4 percent, when measured on a monthly basis. A correlation of 100 percent would mean they moved perfectly with each other. So yes, Fed policy impacts the stock market.

Figure 5.5 Excess reserves held by banks at the Federal Reserve and the S&P Index, November 1, 2008, to November 1, 2015
Source: U.S. Federal Reserve
Prior to the financial crisis the two were not related in any material way as is evident in Figure 5.6 using data from the Federal Reserve and Standard & Poor's.

Figure 5.6 Excess reserves held by banks at the Federal Reserve and the S&P Index, January 1, 1980, to November 1, 2015
Source: Federal Reserve
You can see how up until quantitative easing (QE) began after the financial crisis, there was no relationship between the two, yet from the inception of quantitative easing until it was terminated in October 2014, the S&P 500 index and the excess reserves at the Federal Reserve were almost perfectly correlated.
Fiscal Policy
Tax and spend—that about sums it up! Fiscal policy involves the level of taxation the government places on the private sector and the amount of money it spends. The government can affect companies and industries by either making it more expensive or less expensive for them to operate by increasing or decreasing taxes on an activity or by providing a subsidy (government spending) for it.
Fiscal Policy Example: Wind Energy
In the fourth quarter of 2014, the International Energy Agency cut its forecasts for oil demand growth. Meanwhile, production in North America was exploding, led by the shale oil boom. The United States had become the world's largest producer of oil and natural gas.
For products like oil and natural gas, excess production results in lower prices for consumers. Lower prices have their own consequences for the industry as well. Analysts at Sanford C. Bernstein & Co. released a report2 in late 2014 revealing that at the then-prevailing prices, which had fallen more than 20 percent since June, as much as one-third of U.S. shale oil production would be too expensive to harvest. Lower prices mean a reduction in production—makes sense, right?
For government-backed industries such as wind energy, the relationship is directly the opposite; the more they produce, the more it costs ratepayers and taxpayers because they have to pay to subsidize production. It's not exactly intuitive that as supply increases, the prices go up. But this is an industry that is driven not by market forces but by policy. Whenever you see that, be careful, because the normal rules don't apply. Remember how badly things ended in our example on the pre–financial-crisis housing boom.
In late 2014, analysis showed that states with the largest use of wind power had the highest electricity bills. Bet you didn't see that coming! This led private investors to largely bypass wind companies, leaving them heavily dependent on the government for their survival.
Looking at the International Journal of Sustainable Manufacturing, researchers concluded, “A wind turbine with a working life of 20 years will offer a net benefit within five to eight months of being brought online.” This raises the question as to why any tax credit for wind energy would span more than just a few years at most, let alone 10 years after the facility is up and running.
Congressional support for the Production Tax Credit (PTC) was in late 2014 largely split along party lines. Fifty-five members of the House of Representatives led by Mike Pompeo (R-Kan.) wrote a letter to the tax-writing committee demanding an end to the wind energy subsidies:
We offer our full support of the current process undertaken by the House Committee on Ways and Means that will allow the most anti-competitive and economically harmful tax provisions, specifically the wind energy production tax credit (PTC), to expire. Ensuring that our nation's patchwork tax code undergoes significant reform is a noble goal and, as part of this process, we believe Congress should stop picking winners and losers and finally end the wind PTC.
It was presumed that a GOP-controlled Congress would see the PTC on the chopping block in 2015 and a Democrat-controlled Congress would fight for renewal; thus, the outcome of the 2014 mid-term elections was incredibly important for wind energy producers. Government policy was having an enormous impact on the potential investment returns for the industry.
In an effort to help make sure that the PTC-friendly Harry Reid (D-Nev.), the Senate majority leader, remained in office, the wind industry turned the League of Conservation Voters (LCV) into their own personal Trojan horse. The organization bragged that it would spend over $25 million supporting pro-PTC candidates and attacking their opponents before November 2014 elections. If LCV's campaign were to fail, the loss of the PTC could prove fatal to some wind companies, something of which many investors in these companies may not have been aware.
During the run-up to the 2014 mid-term election, one of the most famous and successful investors in the world, Warren Buffett, told his clients, “I will do anything that is basically covered by the law to reduce Berkshire's tax rate. For example, on wind energy, we get a tax credit if we build a lot of wind farms. That's the only reason to build them. They don't make sense without the tax credit.” If that tax credit were to go away, Berkshire's investors would be hurt.
For investors, the power of cronyism should never be underestimated. Political decisions that are incredibly difficult to predict can seriously affect investing decisions. Investors need to always make sure they understand the political side of their investing choices.
Regulatory Policy
There are two types of regulation: economic and social. Economic regulation refers to those regulations concerning pricing, such as regulations affecting monopolies or potential monopolies in areas such as utilities, or to prohibit practices or mergers that would limit competition. Government may also use regulation to enforce social goals such as clean air and water.
Generally speaking, regulation is viewed as a positive, but it can also be burdensome. It all depends on how much is being layered on and whether the rules serve to improve the business landscape or hurt it. That's Chris's take on it and he has seen regulation mandates pull forward demand time and time again, which can be hugely profitable for the investor if he or she recognizes what's happening. Lenore, however, is a bit more wary of the entire concept of regulation for two reasons. First, regulation forces all players in an industry to behave in a similar manner, which is akin to having an entire population with similar genetic strengths and weaknesses. All it takes is some new threat, something unexpected, and the entire industry, much like a biological population, can be decimated.
Second, regulation assumes that those regulating are wiser and have more foresight than those within the industry, thus are better able to see what dangers are on the horizon and instruct industry players how to best behave. The history of regulation gives little evidence to support this assumption, with regulation typically addressing the crisis of the past with debatable ability to prevent future ones. Chris agrees with Lenore on this.
Investors ought to objectively look at how regulation impacts incentives and the cost structure of an industry, as well as assessing what systemic risks it might generate and invest accordingly. Remember our example in Chapter 3 concerning how regulation pushed banks to all behave in a similar manner, which made them all vulnerable to the same risks. When it turned out that the assumptions they all were instructed to abide by were faulty, the damage was widespread and brutal for the economy.
Regulatory Example: Banking
In 2013, we attended the Cato Institute's Monetary Policy conference and, as you can imagine, a lot was said about the Federal Reserve, stimulus tapering, the U.S. dollar, and more. There was no shortage of policy wonks both in the audience and at the podium, but the presentation that most caught our attention was from the retired chairman and CEO of BB&T Bank (BBT) and current president and CEO of Cato, John Allison.
During his watch at BB&T between 1989 and 2008, Allison grew the company from $4.5 billion to $152 billion in assets. That's an average increase of over $8 billion a year, or $682 million a month. With a track record like that, our ears perked up when he spoke, because it stands to reason that he knows at least a few things about banking and dealing with the Fed.
Allison spoke about the economy, issues with current monetary policy, and the risk to the dollar in the longer-term. However, what drew the most attention was his prediction about one aspect of Dodd-Frank. For anyone who's unfamiliar, the Dodd-Frank Wall Street Reform and Consumer Protection Act was signed into federal law by President Barack Obama on July 21, 2010. It brought the most significant changes to financial regulation in the United States since the regulatory reform that followed the Great Depression.
Dodd-Frank has produced a number of fallout effects, but the one that Allison highlighted was the impact on small- to medium-sized banks, as well as community banks, given the ballooning regulations. Dodd-Frank authorized more than 400 new bank rules and mandated the creation of the Consumer Financial Protection Bureau, which oversees more than 5,000 pages of regulations.
Large increases in regulation, such as the Dodd-Frank-mandated ones, result in increased costs that often place smaller companies at a significant disadvantage to larger firms.
Existing businesses are often in favor of regulations that increase costs to such an extent that they make it very difficult for new or small companies to compete. This can have a material effect on the nature of an industry, effectively reducing competition from new entrants, which can also slow the rate of innovation and reduce the rate at which companies are pressured to reduce costs and/or prices.
That was precisely Allison's point. According to the Kansas City Fed, 91 percent of the 322 small banks surveyed are laboring under higher training and software costs due to Dodd-Frank.3 That suggests to us that we are in for yet another wave of consolidation and potential bank failures. Over the last few years, hundreds of community and small banks closed up shop due to the financial crisis and the early stages of Dodd-Frank compliance.
According to a study by the St. Louis Federal Reserve,4 since at the least the 1980s, progressive consolidation has seen the overall number of banks continually decline while the size of banks has been increasing with the largest banks getting larger. A report issued at the end of 2014 by SNL Financial found that in the United States, the five largest banks controlled 44 percent of the industry's total assets.5 In 1990, the top five held just 9.67 percent. The cost of doing business has changed so much that by 2014, the median return on average assets for the top five institutions was nearly 50 percent higher than that of the overall industry. In 1990, the return for the largest trailed the sector by 0.33 percent. With such a discrepancy in cost structure, consolidation will likely continue, with some forecasts suggesting that, over the coming years, fewer than 5,000 banks will remain, as compared with 6,891 at the end of September 2014. Those too-big-to-fail banks? Well, they just keep getting bigger.
Regulatory Example: Music Industry
If that doesn't have you convinced, maybe this tune will do it for you. When it comes to the content industry, the world is a-changing. No matter what the industry—publishing, music, television, movies, comic books, and more—there has already been a significant shift in how and where people consume this content thanks to broadband, the Internet, and, more recently, mobile technologies.
According to Nielsen Soundscan6 numbers, total consumption of music rose 15 percent over 2014 levels, but that growth came more from streaming than from purchases of tracks or albums. Per Nielsen, more than 317 billion songs were streamed on-demand in 2015 through audio and video platforms, an increase of 93 percent compared with 2014. Album sales continued to fall, dropping 6 percent in 2015 to 241.4 million units following an 11 percent decline in 2014. Digital track sales fells 12 percent in 2015 to 964.8 million, while CD sales declined 10.8 percent to 125.6 million in 2015 from 140.8 million in 2014. Pandora's application has been among the most-downloaded free apps for iPhones and iPads, demonstrating that streaming is becoming a mainstream way to listen to music. At the end of September 2015 the company had 78.1 million active listeners and during the three months ending September 2015, those millions and millions of people listened to 5.14 billion hours of Pandora programming. Hammering the point home about Pandora's app, Pandora derived 82 percent of its revenue during those three months from the mobile and other connected devices, with the balance from computer-based usage.7
Even third-party research firm Nielsen, the company that measures the ratings of television shows, updated its ratings measurement system to capture data about television viewing not simply through broadcast, but through streaming. Given Nielsen's acquisition of radio ratings giant Arbitron, one has to wonder how long until Nielsen Audio expands its measuring scope to include services like Pandora, Spotify, Apple's recently acquired Beats service and subsequent Apple Music subscription service, and Amazon's Prime Music offering.
As these changes have taken place, copyright law has failed to keep pace. Recent tweaks have been specifically targeted and usually at the behest of one sector of the content industry seeking advantage. Current copyright laws have not seen a comprehensive review since long before the existence of Netflix, Hulu, Pandora, or Spotify, which means the system as a whole is geared toward the content industry of yesteryear.
There is little debate that the current copyright laws need to be comprehensively reviewed and updated to reflect current market realities. Congress is in the process of doing just that. In mid-2014, the House Judiciary Committee held hearings to examine music licensing specifically, which sounds like a really forward-looking approach, but as is always the case when we are talking about regulatory power, there are some that will seek to rig the system in their own favor. In this example, the future of steaming music services could be at stake.
As a result of copyright law, power is highly concentrated in the music licensing business. Songwriters rightly control their work product. However, when songwriters and music publishers collectively assign control to Performance Rights Organizations (PROs) like the American Society of Composers, Authors and Publishers, the aggregation of control becomes absolute. Three PROs effectively control 100 percent of all musical compositions. There is no competition or marketplace for those wishing to license and use compositions, much like the domination of the three ratings agencies, Standard & Poor's, Moody's, and Fitch.
In the past, these organizations abused their power by colluding to push up rates. As a result, ASCAP and Broadcast Music Inc. have been deemed a monopoly and forced to operate under a federal consent decree since 1941 that gives licensees the right to seek federal court intervention when PROs' demands begin to cross the line of propriety. The third organization, The Society of European Stage Authors and Composers, was, as of the writing of this book, in the midst of a federal antitrust suit.
In addition to Congress's review of copyright laws, the Department of Justice announced in mid-2014 that it would review the consent decrees for ASCAP and BMI with a view of updating them as well. Not surprisingly, the music publishers and PROs advocated for a full repeal.
Pandora was forced in 2014 to petition the federal court to intervene in negotiations between it and ASCAP. In the decision, it was revealed that the major publishers intentionally withheld vital information about the details of their catalogs, giving Pandora three choices: Pay whatever amount the publishers wanted, not pay and face infringement claims that would wreck its business, or stop playing music altogether. In what other market could a seller of a product legally not tell the buyer what it is purchasing and then sue the buyer to oblivion if it refused to pay the ransom?
In addition to ASCAP's antics with Pandora, a Pennsylvania court in 2014 found that SESAC, which controls approximately 5 percent of the market, likely exercises monopoly power, and thereby might be destined for antitrust constraints. The major publishers, currently under consent decree, control market shares multiple times greater than SESAC.
The manner in which Congress views the answers to these questions will have significant implications for the growing streaming marketplace. Removal of the only check on the publishers' vast power would leave publishers completely unimpeded to raise rates.
It is clear that the publishers' main goal is to drive up rates paid by licensees. In addition to ridding themselves of the consent decrees, they are seeking legislation that would reconfigure the formula federal courts currently use, thus requiring the court to set higher rates.
Either of these policy changes would be devastating to streaming music providers.
In mid-December 2015, the federal Copyright Royalty Board ruled to raise Internet radio royalty rates, meaning companies like Pandora and iHeartMedia that offer ad-supported services will have to pay out increased per-stream fees in 2016. These companies will pay what equates to 17 cents per 100 streams of a given song on free, ad-supported services and 22 cents per 100 listens logged by paying subscribers. By comparison, in 2015 Pandora paid out 14 cents for every 100 free listens, or a 25 percent slice revenue, whichever was greater. Despite services like Pandora paying over 55 percent of their revenue in licensing fees in 2015, SoundExchange, which collects royalties for labels and individual artists, was pushing for higher rates between 25 cents and 29 cents for every 100 plays, or 55 percent of a streaming service's revenue.8 With these new rates valid through 2020, profitability at Pandora and other streaming music services as well as their viability remain in question.
Cocktail Investing Bottom Line
Successful investing requires keeping a close eye on government and changes in its policies, be it your government or that of any other nation in which you invest or that trades with a region in which you invest. Changes in policies can alter, sometimes drastically, the industry playing field:
- Government impacts the economy through monetary policy, fiscal policy, and regulatory policy.
- Always be aware of the latest interest rate guidance from the Federal Reserve, as changes in guidance often have a material effect on markets.
- An inverted yield curve, one in which long-term rates are lower than short-term rates, is typically a sign of a recession, so keep an eye on changes in interest rates at various maturities.
- Be aware of central bank policy announcements from the four geographic horsemen we talked about in Chapter 4: the U.S. Federal Reserve, European Central Bank, Bank of China, and Bank of Japan. Commentary from these central banks and select others can have a material impact on the markets if it does not live up to Wall Street expectations. Be aware of what Wall Street expects from these organizations versus what was actually decided by their ruling bodies. Be prepared for overreactions from Wall Street, both good and bad, when these organizations or their officials publicly discuss their policies and views on their respective economies.
- Pay attention to discussions about changes in the tax code and regulation, as such changes can make previously attractive investments unattractive, and vice versa.
- Be aware of changing industry dynamics and which groups have control over delivery of products and/or services. Industry structures that worked in the past may no longer work and cause serious problems going forward as technological advancements change the way we buy or receive the goods and services we want.