
Chapter 9
Analytics and Personalization Builder
IN THIS CHAPTER
![]() Uncovering customer behavior
Uncovering customer behavior
![]() Making decisions based on customer insights
Making decisions based on customer insights
![]() Understanding the role of AI in online marketing
Understanding the role of AI in online marketing
Management guru Peter Drucker is famously quoted as saying, “you can't manage what you can't measure.” Your company has essential business goals that your online marketing campaigns need to address. Analytics are key to managing those campaigns and making sure that you're accomplishing those goals.
Whether it's to prove that your campaigns are reaching the right potential clients, to demonstrate that your work is driving new business, or just to help your higher-ups feel good about the money that your company is already putting into your projects, you need powerful analytic tools.
Salesforce Marketing Cloud has always provided a robust suite of reports you can use to measure and manage your efforts. Recently, it has also introduced an interactive reporting tool. We discuss both the interactive reporting tool and the traditional reports in this chapter. We also briefly touch on the predictive analytics capabilities of Marketing Cloud.
Discovering Discover
Discover is the feature name for the interactive reporting tool in Marketing Cloud. Essentially, it helps you easily modify existing reports or design your own reports to get at exactly the analytics you need.
To get to Discover, log in to your Salesforce Marketing Cloud account, pause your mouse pointer over Analytics Builder, and select Reports from the list that appears. Discover reports and Standard reports are available in the same catalog, but you can filter based on whether a report is a Discover report.
 If you've used other business intelligence tools, the design and functionality of the Discover interface will be familiar: You drag and drop combinations of data attributes and measures onto a table layout canvas. The data attributes can be things such as dates, device types, and segments; the measures are things such as counts, rates, and actions. Figure 9-1 shows a sample of the lists of fields you can use and the canvas where you drop them.

FIGURE 9-1: The Discover canvas.
Modifying an existing report
Adjusting an existing report template for your own needs is an easier way to begin using the Discover tool. Report templates are included in Discover that can help you get started. You can change the parameters that control how the report works and also the look and feel of the report to really make it your own.
To start getting to know the Discover feature, try practicing with the Discover version of a standard report that you already understand. The Recent Send Summary report is a good choice. This report displays detailed statistics about email sends over the last 30 days, and people use it to identify trends in audience behavior in response to their email sends.
You can find the Recent Send Summary report in the Report catalog. Click Catalog on the toolbar at the top of the screen. You can use the search field or the filters to help you find the right report. Make sure you open the version with the cube icon, which indicates that the report is a Discover report. Figure 9-2 shows the search field and filters in the Report catalog.

FIGURE 9-2: The Report Catalog screen.
Looking at a standard report like Recent Send Summary gives you an idea of how a report is structured. You can play with the various measures and attributes to manipulate the criteria and the design. Figure 9-3 shows the Recent Send Summary report in the Discover editor.
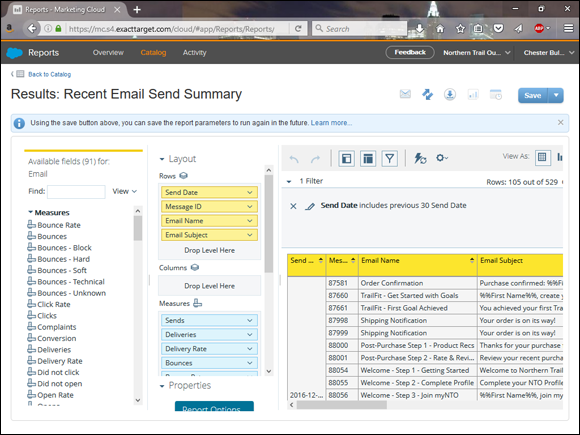
FIGURE 9-3: A standard report in the Discover canvas.
 To get an idea of the options available for filtering and manipulating data displays, right-click any data field in the Layout column. To apply a filter before you add a field to the report, right-click the field in the field list (on the left).
Creating a report from scratch
After you've experimented with modifying existing reports to make them do what you want, you can try creating a new report that is all your own.
The key to building your own report in Discover is the Blank Template for Email Sending Performance. As the name suggests, this template gives you an empty canvas.
In the very simple example in Figure 9-4, we created a report that shows how open rates (the percentage of the recipients who opened the email) on different days of the week have performed over the years.

FIGURE 9-4: A simple Discover report.
To create this report, we used the following steps:
- In the toolbar on the Reports screen, click Catalog.
- Click the Create button for the Blank Template for Email Sending Performance report.
- In the field list on the left, scroll to the Event Time Weekly section. Drag the Event Day of Week field to the Rows area (under Layout).
- In the field list, scroll to the Event Time section. Drag the Event Year field to the Columns area (under Layout).
- Again in the field list, scroll to the Measures section. Drag the Open Rate field to the Measures area (under Layout).
You can save the report you create in Discover so that you can come back later and run the report again.
Be aware of the following:
-
 By default Discover refreshes the report display every time you add or modify an element. All this refreshing can slow down or even time-out your report generation if you apply a bunch of filters while you're initially building the report. A quicker approach is to use broader criteria while designing the layout, and filter later.
 -
If the report is still slow to generate, click the Disable Auto Refresh button (lightning bolt icon) on the toolbar to toggle the function that refreshes the report as each change is made.
- You can't drill down in the data to the subscriber-level metrics. All data available in this tool is aggregated up to the send-level. For example, if you run a report about link behavior that shows that a particular link in the email send had 5,000 unique clicks, you can't determine the people who clicked each of those 5,000 times.
Using Standard Reporting
Discover was a pricey add-on when it was introduced a few years ago because its reports are more flexible and customizable than standard reports. Now that Discover is available out-of-the-box, you might think that standard reports would become obsolete.
However, many people depend on the standard reports for their day-to-day work, and the standard reports will remain available. Even for a new user, standard reporting can be a useful tool. Although not as flexible and customizable as Discover reports, the standard reports are a convenient way to quickly get to tried-and-true metrics that marketers have been using for years.
To get to the standard reports, log in to your Salesforce Marketing Cloud account, pause your mouse pointer over Analytics Builder, and select Reports from the list that appears. Standard reports and Discover reports are available in the same catalog, but you can filter based on whether a report is a standard report.
There are too many standard reports to list here, but a description of each report appears next to the report name in the report catalog. We describe some of the most commonly used reports in this section.
Running a report
You run the standard reports in the same way, regardless of the actual type of report:
For numbered lists, we have one action or one related group of actions per step. So, for example, Step 1 has two actions but there's no intervening text so we're okay. You also need to keep the steps linear, without having the reader jump over a step (as happens in Step 2).
- In the toolbar on the Reports screen, click Catalog, and then click the Create button for the report you want to run.
-
In the Create Report window, fill out the parameters of the report.
You usually indicate a date range and possibly other limits. All reports with dates ask you to specify the time zone and culture code. These fields control the display of dates on the report. Dates on the report appear converted to the time zone that you indicate and in the format used by the culture you indicate with the culture code. For example, in the United States, we use MM/DD/YYYY, but another country might use DD/MM/YYYY.
If the following message appears at the top of the Create Report window, the report is too large for your browser window or takes too long to generate:
This report cannot be viewed as a web page. You must choose another delivery option from the Results page after submitting these parameters.
You can get the report by email or FTP, as shown in Step 4.
-
Click Submit.
If you didn't receive the message in Step 2, the report appears in your browser window and you're finished. If you did receive the message, continue with Step 4.
- Decide whether you want to receive the report by email or by FTP:
- For email, click the Email Results button (envelope icon). The Email Report Results window appears. Complete the information in this window and click Save.
- For FTP, click the FTP Results button (two arrows icon). The FTP Report Results window appears. Complete the information in this window and click Save.
Subscriber Engagement report
The Subscriber Engagement report shows which subscribers are most engaged with your emails by listing the number of emails delivered to, opened by, and clicked by the subscriber. Figure 9-5 shows a sample Subscriber Engagement report.

FIGURE 9-5: A sample Subscriber Engagement report.
You tell the report the following:
- The date range for which you want to see data.
- The lists to which you want to limit the data. You can choose All Subscribers if you don't want to limit the report to a particular list.
- The percentage of the subscribers to include in the report.
- How many emails the subscriber must have received to be included in the report. (Subscribers who have received only a few emails can look like they have high engagement, but it is an anomaly from a small sample size.)
The report displays the subscribers, listed in high-to-low order by the click-to-sent ratio. Marketers use this report to identify their rock-star subscribers. This is a good group of subscribers to reward with exclusive special offers, for example.
Because of its size, this report can't be viewed in your browser window, so you need to send it to your email address or to an FTP site. (See the previous section, “Running a report,” for details.)
Recent Email Sending Summary report
The Recent Email Sending Summary report shows high-level information about your email sends over a certain period of time. Figure 9-6 shows a sample Recent Email Sending Summary report.

FIGURE 9-6: A sample Recent Email Sending Summary report.
For this report, you specify the following:
- What date range for which you want to see data.
- Whether to include single sends. A single send is the sending of an individual email by the API, such as a confirmation message after a person fills out a form on your website.
The report displays all your email jobs for the date range you specified. Marketers use this report periodically to establish a benchmark and to check progress against that benchmark over time. It's also a useful diagnostic tool if you suspect that your email sends are completing too slowly or not at all.
Account Send Summary report
The Account Send Summary report shows a count and a rate of every possible kind of response a subscriber can have to your emails. Figure 9-7 shows a sample Account Send Summary report.

FIGURE 9-7: A sample Account Send Summary report.
You tell the report the date range, whether to exclude single sends, and whether to exclude jobs in which tracking was suppressed.
The report displays 40-some fields of information about deliveries, bounces, opens, clicks, forwards, and more. Because of its size, this report can't be viewed in your browser window, so you need to send it to your email address or to an FTP site. (See the previous section, “Running a report,” for details.)
Email Performance for Domains report
The Email Performance for Domains report lets you evaluate email send results for each domain sent to in a single send. Figure 9-8 shows a sample Email Performance for Domains report.

FIGURE 9-8: A sample Email Performance for Domains report.
You tell the report which email send you want to evaluate. The report displays a circle graph that shows you to which domains the email was sent. You can also see the open, click, bounce, and unsubscribe rates for each of the domains.
Viewing Web and Mobile Analytics
The Web & Mobile Analytics screen in Marketing Cloud is beautiful, overflowing with colorful charts, maps, and diagrams about every aspect of how visitors are interacting with your website and mobile app. Figure 9-9 shows just one screen's worth of the analytics panels available in this tool.
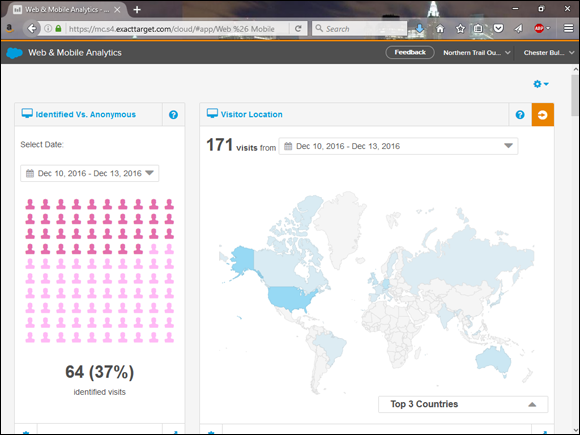
FIGURE 9-9: The Web & Mobile Analytics dashboard.
One panel displays a world map indicating which countries your visitors are from. Other panels (not shown in the figure) display a circle graph indicating which of your site pages are most popular and a line graph of the number and value of your abandoned shopping carts. The dashboard containing all these panels seems to scroll on and on.
There are far too many panels to list them all, but fortunately each panel has individual controls you can use to orient yourself:
- The What Am I Seeing? button (question mark icon) provides a rundown of what the current panel does.
- The What Can I Do with This? button (arrow icon) suggests how to proceed with your new insight and data.
- Date drop-down list enables you to choose the date range for the data shown in that panel.
Figure 9-10 shows the controls on each panel.
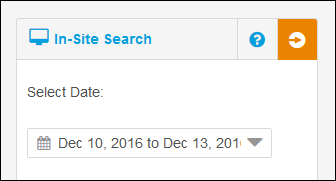
FIGURE 9-10: Helpful controls on the analytics panels.
To get to Web & Mobile Analytics, log in to your Salesforce Marketing Cloud account, pause your mouse pointer over Analytics Builder, and select Web & Mobile Analytics from the list that appears.
You can use the data you see in the Web & Mobile Analytics screen in your ongoing marketing efforts. The most obvious benefit of using this tool is being able to segment your audience and execute follow-up messaging based on subscriber behavior on your website.
Since the analytic breakdowns can be tied back to subscriber data in your account, the behavioral data is available to other tools in your Marketing Cloud account, such as Audience Builder, Email, Subscriber Lists, and Journey Builder. The Data Extensions feature must be enabled in your account to act on the behavioral data because Marketing Cloud uses data extensions to hold the data. For details on enabling the data extensions feature, see Chapter 6.
The tricky part, of course, is setting up your website and mobile applications to collect behavioral information and to send the information to the Web & Mobile Analytics app in the first place. You must install the code on every website and mobile app from which you want to collect behavioral information about its visitors. The basic installation of the code to gather data from your websites may be something you can do yourself, but more advanced tracking on websites plus tracking in your mobile app may require the help of a developer.
Setting up web analytics
Marketing Cloud uses a tool called Collect to gather behavioral data from your websites. By default, Collect monitors the following details, but you can enhance your configuration to collect more data:
- Browser type
- User location
- Session time and length
- Page URL and title of the page that the visitor is viewing
- Referrer URL of the page from which the visitor came
To get started with a basic implementation, you copy a snippet of JavaScript to your clipboard and paste it into the HTML of every individual page of your website where you want information to be collected. The process isn't difficult but can be tedious.
You can find the JavaScript snippet in the Web & Mobile Analytics interface:
- On the Web & Mobile Analytics screen, click the gear icon in the upper-right corner and select Configure Data Source.
- Click the Configure Collect button.
- Highlight the code snippet that appears on the screen and copy it to your clipboard.
Now you can paste the code into your HTML. You should paste the code immediately before the closing </body> tag of the page.
Setting up mobile analytics
The process for setting up Collect in your mobile app is conceptually similar to setting it up on your web pages, but it's more difficult. Getting into the source code of your mobile app is less straightforward than opening up the HTML of your website pages to drop in a little JavaScript snippet.
Without getting into detail, Marketing Cloud provides the Journey Builder for Apps SDK, which your mobile app developer can install in your iOS or Android app. By installing this SDK, your app can work with the Web & Mobile Analytics tool.
Using Predictive Intelligence
Of all the tools in the Marketing Cloud platform, the predictive intelligence tools are probably the least known. Recently, Salesforce has begun integrating AI tools in all its products in an effort called Einstein. We are beginning to see how features currently in development as well as some long-standing capabilities fit into this overall direction of the software.
The main tools that already exist in Marketing Cloud for predictive intelligence capabilities are the Personalization Builder tools for email and the web. These tools can dynamically select content in an email or a web page based on the subscriber's purchase history, items viewed, shopping cart, and more.
To get to Personalization Builder, log in to your Salesforce Marketing Cloud account, pause your mouse pointer over Personalization Builder, and select Predictive Web or Predictive Email from the list that appears.
Personalization Builder needs to know the following to make an intelligent decision about what content to use:
- Data about the subscriber's behaviors and preferences. Like Mobile & Web Analytics, Personalization Builder makes use of the Collect feature to monitor events on your website and gather this information.
- A catalog of content from which to select just the right piece for this particular subscriber. You can upload three kinds of catalogs:
- Product catalog with a list of your products
- Content catalog with articles, videos, or whatever content you have available to view
- Banner catalog with heroes, calls to action, and offers
- Rules that you define in Personalization Builder to decide what content to present to the subscriber in what circumstances.
Implementing Personalization Builder is not a casual task, and you might need to enlist the help of a developer. And you won't be able to do it quickly: Marketing Cloud's best practice is to observe your website behavior for at least 30 days before introducing content based on predictive intelligence.
However, these exciting tools will see continued emphasis and development from Salesforce. They are a powerful way to make your customers feel like you know them — even when you aren't available to talk to each one of them personally.