Chapter 6
Introducing Project Schedule Management
CERTIFICATION OBJECTIVES
6.01 Creating the Schedule Management Plan
6.02 Defining the Activities
6.03 Sequencing Activities
6.04 Estimating Activity Durations
6.05 Developing the Schedule
6.06 Controlling the Schedule
![]() Two-Minute Drill
Two-Minute Drill
Q&A Self Test
Here’s an old joke about project management schedules: “The first 90 percent of a project schedule takes 90 percent of the time. The last 10 percent takes the other 90 percent of the time.”
And isn’t that the way it goes? You always hope it won’t be like this, but far too often that’s precisely what happens. Projects, especially projects that are running behind schedule, fail at the beginning, not at the end. The importance of planning a project is never more evident than when you rush to reach completion. The final actions to complete a project are dependent on the plans and motivations set early on during the project planning processes.
Schedule management is an essential element on the PMP exam. You’ll need a solid understanding of the activities and methods required to predict and account for project time. Schedule management is crucial not only to passing the PMP exam, but also to managing projects successfully.
Exploring Project Schedule Management
Project schedule management used to be called “time management” in the PMBOK Guide. Time management, however, implies more of a personal management of how you spend your time, and you can’t you really manage and manipulate time like you can manage a schedule. Schedule management in project management is about completing the work of the project scope within a predicted amount of time. Lots of things affect the schedule and the project’s duration, and it’s the project manager’s role, or the role of an expert scheduler, to predict how long the project should take based on what the scope requires. This is tricky business, but fortunately, on your PMP exam the questions won’t have time or space to consider every nuanced situation, but it will test your understanding of the generally accepted principles of schedule management within a project.
To pass this portion of your exam, you’ll need to be familiar with the six processes of schedule management:
![]() Create the schedule management plan.
Create the schedule management plan.
![]() Define the activities.
Define the activities.
![]() Sequence the activities.
Sequence the activities.
![]() Estimate the activities duration.
Estimate the activities duration.
![]() Develop the schedule.
Develop the schedule.
![]() Control the schedule.
Control the schedule.
These six processes are very logical: plan how you’ll manage the schedule, define the work to be scheduled, sequence the activities, predict durations, massage the schedule, and control the schedule. I’ll follow this same approach to the six processes throughout this chapter. There’s a lot of information to cover in this chapter, but I’m confident that you can get it done.
Tailoring Project Schedule Management
Like all knowledge areas, project schedule management can be tailored to fit any organization’s needs. The uniqueness of each organization and each project means that there’s no one-size-fits-all approach to schedule management. For starters, the project manager will consider the size of the project and the chosen life cycle approach. Larger projects generally require a more detailed schedule because there’s more work to coordinate with the project team, vendors, and stakeholders. This means more planning and communication.
You’ll also have to consider the organizational structure. Matrix structures require more coordination with the resources you’ll utilize on the project. Project managers also need to consider physical resources in the schedule: materials, equipment, and facilities that will require thought and logistics to make certain these resources are available when the project team needs them. It’s a disappointment when human resources are available to do the work, but someone has forgotten to schedule the equipment, order materials, or ensure that other resources are available.
All projects will require some level of control. Complex projects need certainty in the schedule so everyone knows what’s in motion, what’s pending, and when activities should occur within the project. You’ll track the progress of the project through approaches such as earned value management, burnup or burndown charts based on percent complete, and perhaps red/yellow/green markers to show how activities are moving in the project. Whatever approach you take, you’ll document it in the schedule management plan and communicate the approach with the project team. Finally, it’s unlikely that you’ll do all this scheduling work with a pencil. Your favorite project management information system will likely help you plan and control the project schedule—but no software can take the place of a human project manager.
Considerations for Agile and Adaptive Environments
Projects embrace either the critical path method or the agile method when it comes to project scheduling. I’ll discuss the critical path in this chapter. On the agile side, you should be familiar with two emerging approaches to schedule management for your PMP exam: iterative scheduling with a backlog and on-demand scheduling.
Iterative scheduling uses a rolling wave planning method and a backlog of requirements in an agile environment. The backlog of requirements, called user stories, are prioritized at the start of each iteration. The team determines how many user stories they can develop, and then the iteration begins.
On-demand scheduling also uses a backlog of requirements, but as resources become available in the project, the next requirement is launched. This pull-based approach to scheduling stems from lean manufacturing and is used with a Kanban system. Kanban is Japanese for visual sign or card—as a “sign board” is used to show what’s being worked on (called the work in progress, or WIP), how many requirements are completed, and how many requirements remain to be worked on. The Kanban board is a table that shows all the requirements and phases until “done” is reached in a work process. For example, you’d start with requirements on the left, and then design, develop, test, deploy, and done (or other phases, as appropriate to your project). You’d pull the requirements from left to right as the project moves through the phases of production. Figure 6-1 shows a simple Kanban board for a video project.

FIGURE 6-1 Kanban boards show work in progress and completed requirements.
Agile approaches use shorter increments of project work versus longer phases you might enjoy in a predictive environment.
Although the flexible nature of agile is great, there are caveats to scheduling work and prioritizing requirements with the project team. The first few iterations in an agile environment can help the team establish a user-story baseline of what’s feasible to accomplish in each iteration. Though the PMP exam is likely to have a few questions on agile and adaptive environments, these are unique approaches to project management that require the project manager and the project team to understand fully the flow of the work and expectations of the methodology.
CERTIFICATION OBJECTIVE 6.01
Creating the Schedule Management Plan
As soon as you initiate the project, stakeholders will want to know when the project will be completed. On some projects, you, the project team, and experts will have to dig into the project scope, the work breakdown structure (WBS), and the technical details of the project to determine how long the project will take to complete. On other projects, you won’t have that luxury, as customers, management, and other stakeholders will have already created a deadline—a constraint—for the project. The process of creating the schedule management plan defines how the schedule will be created and includes the type of work to be completed, the resources, and other attributes to predict when the project will be completed. Creating the schedule management plan can happen once in a project, but it will likely be an iterative process based on the conditions within the project.
Two of the biggest factors in this process are the organizational process assets and enterprise environmental factors. If your organization is completing the same types of projects over and over, chances are that you and the key stakeholders will already have a rough estimate of how long the project will take. If the project work is unique and new, then more uncertainties and assumptions are made about the duration of the project, which means the estimates could be unreliable because you don’t know what you don’t know. Enterprise environmental factors can also affect the schedule management plan, as the organizational culture, limits on working hours, resource heuristics, work authorization systems, and other policies can directly influence how the schedule is planned and maintained.
Other inputs include the project charter, because it includes the summary milestone schedule to help you better plan the work and when the project will take place. You’ll also rely on the project management plan as an input to this process. Specifically, the scope management plan defines how the work will be determined and decomposed for scheduling. Also in the project management plan is the development approach for the project, which addresses how you’ll schedule the work in your organization, how the work will be estimated for duration, and what scheduling tools and techniques you’ll be required to use in the project.
Building the Schedule Management Plan
Imagine you’re a new project manager in your company and you’ve just been assigned a new project. One of your first tasks, assuming the project scope is defined, is to create a project schedule. It’s time to gather experts for a meeting to explore the project scope and understand the work it’ll take to make the scope a reality. You’ll also have to know the constraints of the work environment, who will be on your project team, the skill sets of the project team members, whether the project team is full-time or part-time, what time constraints exist (such as procurement details and working hours), bottlenecks within the work authorization system, and lots of other bits of information to help you predict how long the project will take to complete.
The schedule management plan is the foundation for all the activities that you, as a project manager, would undertake to create a schedule. The PMBOK Guide, in predictive environments, advises that you first create a schedule management plan for most projects, and then you can get into the gory details of creating duration estimates and a schedule for the project. To build the schedule management plan, you might rely on organizational process assets and just adapt a plan from a previous, similar project—nothing wrong with that. Or, if you must create a schedule management plan from scratch, you’ll use just three tools and techniques:
![]() Expert judgment Involve people who are closest to the project work and who know the organization and how the work may proceed. Experts can help with schedule development, methodologies, software, and scheduling concerns specific to your industry.
Expert judgment Involve people who are closest to the project work and who know the organization and how the work may proceed. Experts can help with schedule development, methodologies, software, and scheduling concerns specific to your industry.
![]() Data analysis techniques Decisions are made about the project approach, how the work will be scheduled, duration compression techniques, modeling approaches, analytical techniques, and software that can help create and control the project schedule.
Data analysis techniques Decisions are made about the project approach, how the work will be scheduled, duration compression techniques, modeling approaches, analytical techniques, and software that can help create and control the project schedule.
![]() Meetings You’ll attend lots of meetings regarding project management. Schedule management meetings bring the key stakeholders together to discuss the development and the contents of the schedule management plan.
Meetings You’ll attend lots of meetings regarding project management. Schedule management meetings bring the key stakeholders together to discuss the development and the contents of the schedule management plan.
Exploring the Schedule Management Plan
One of the goals of the schedule management plan is to define how the other processes in this knowledge area are performed. The schedule management plan considers the scope baseline, the project, organizational process assets, and the enterprise environmental factors, which enable the experts to create the content of the plan. The schedule management plan is part of the comprehensive project management plan, and it defines the following:
![]() Model for schedule development This includes the methodology for creating the schedule and any tools that will be used to facilitate the schedule development.
Model for schedule development This includes the methodology for creating the schedule and any tools that will be used to facilitate the schedule development.
![]() Release and iteration length If you’re using an adaptive life cycle, you’ll have segments of work iterations. These time-boxed durations are defined as part of the project approach, and they help control scope creep as the project team focuses on only the selected user stories for the current iteration of the project.
Release and iteration length If you’re using an adaptive life cycle, you’ll have segments of work iterations. These time-boxed durations are defined as part of the project approach, and they help control scope creep as the project team focuses on only the selected user stories for the current iteration of the project.
![]() Level of accuracy More information translates into a more accurate schedule. This component of the plan allows for a range of variance based on the project information, the size of the project, contingency for delays, and the demand for an accurate schedule.
Level of accuracy More information translates into a more accurate schedule. This component of the plan allows for a range of variance based on the project information, the size of the project, contingency for delays, and the demand for an accurate schedule.
![]() Units of measure This defines how the schedule will measure time (hours, days, weeks, or other units).
Units of measure This defines how the schedule will measure time (hours, days, weeks, or other units).
![]() Organizational procedures links These connect the schedule management to the components of the work breakdown structure for consistency.
Organizational procedures links These connect the schedule management to the components of the work breakdown structure for consistency.
![]() Project schedule model maintenance This defines how the schedule model will be updated based on work performed, work in progress, and work remaining in the project.
Project schedule model maintenance This defines how the schedule model will be updated based on work performed, work in progress, and work remaining in the project.
![]() Control thresholds These are predefined ranges of variances for tasks, milestones, and project completion, such as +/– 10 percent.
Control thresholds These are predefined ranges of variances for tasks, milestones, and project completion, such as +/– 10 percent.
![]() Rules of performance measurement These metrics will be used to measure the project performance regarding schedule. The most common approach is earned value management (EVM).
Rules of performance measurement These metrics will be used to measure the project performance regarding schedule. The most common approach is earned value management (EVM).
![]() Reporting formats These techniques, forms, templates, and metrics are used for reporting the completion of tasks.
Reporting formats These techniques, forms, templates, and metrics are used for reporting the completion of tasks.
![]() Process descriptions The schedule management plan defines the processes addressed in this knowledge area (activity definition, activity sequencing, activity resource estimating, activity duration estimating, schedule development, and schedule control).
Process descriptions The schedule management plan defines the processes addressed in this knowledge area (activity definition, activity sequencing, activity resource estimating, activity duration estimating, schedule development, and schedule control).
Planning, as you know, is an iterative activity in the project. As more information becomes available, you and the project team can revise the schedule management plan and the other processes in this knowledge area. For example, the project scope may be defined in high-level objectives, so the schedule estimate is also provided at a high level. As the project scope is more clearly defined, the WBS is created, and the activity list is generated, the duration estimate can become more accurate as well. This is an example of progressive elaboration and a good example of the iterative nature of project planning.
CERTIFICATION OBJECTIVE 6.02
Defining the Activities
Projects are temporary undertakings that create a unique product or service. The idea of time is inherent to the very definition of a project, in that all projects are temporary. Even though they might seem to last forever, sooner or later they must end. Adequate planning of the temporary project can predict when a project will end. Within this short and limited time, the project manager must create something: a product, a result, or a service. The creation is about change—and change, as you may know, takes time.
Creation of the product, result, or service comes about when the work the project team completes. The sum of the durations of the work equates to when the project is completed. In addition to the duration of activities, other factors of time must be considered, such as the following:
![]() Project management activities
Project management activities
![]() Planning processes
Planning processes
![]() The sequence of activities
The sequence of activities
![]() Procurement of resources
Procurement of resources
![]() Reliance on internal and external events
Reliance on internal and external events
![]() Known and unknown events affecting the project
Known and unknown events affecting the project
Project schedule management is based predominantly on planning, but it is also about control and execution. Planning for project schedules may stem from deadlines, customer demands, hard and soft logic, and a bit of prediction. You’ll use the schedule management plan, the scope baseline, enterprise environmental factors, and organizational process assets as inputs to this process.
Getting to Work: Defining the Activities
The activity list is an output of activity definition that includes all the activities to be performed within the project. The list must be in line with the project scope. Remember the project scope? It’s a description of all the required work, and only the required work, to complete the project. In a sense, the activity list is a further definition of the project scope, because it includes only those actions needed to complete the project scope.
Creating the activity list relies on knowledge, actions, and several completed documents. The creation of the activity list uses the following as inputs to the process:
![]() Schedule management plan This defines and directs the process of defining the project activities. This plan is part of the comprehensive project management plan.
Schedule management plan This defines and directs the process of defining the project activities. This plan is part of the comprehensive project management plan.
![]() Scope baseline This comprises the WBS, the WBS dictionary, the project scope statement, constraints, and assumptions. You’ll need these elements to define the project activities.
Scope baseline This comprises the WBS, the WBS dictionary, the project scope statement, constraints, and assumptions. You’ll need these elements to define the project activities.
![]() Enterprise environmental factors This is all the stuff an organization and external entities can offer the project manager to assist with or constrain the activity definition. In particular, it’s the project management information system and scheduling software. Also included are any commercial databases to help predict duration for project work in your industry. (Think manufacturing and construction, for instance.)
Enterprise environmental factors This is all the stuff an organization and external entities can offer the project manager to assist with or constrain the activity definition. In particular, it’s the project management information system and scheduling software. Also included are any commercial databases to help predict duration for project work in your industry. (Think manufacturing and construction, for instance.)
![]() Organizational process assets Organizations have a way of getting things done. The process assets are the methods and procedures an organization must follow to create the activity list. This also includes historical information from past projects that can help the project team define activities on the current project.
Organizational process assets Organizations have a way of getting things done. The process assets are the methods and procedures an organization must follow to create the activity list. This also includes historical information from past projects that can help the project team define activities on the current project.
Relying on Templates
Why reinvent the wheel? If similar projects have been completed in the past, you can rely on the WBS and activity lists from this historical information to serve as a template for the current project. Even if a portion of a project is similar, a project manager can use the activity list and focus on the similarities of the current project.
A template can include several elements that make a project manager’s life easier and the new project more successful:
![]() Required actions to complete the project scope
Required actions to complete the project scope
![]() Required resources and skills
Required resources and skills
![]() Required hours of efforts for activities
Required hours of efforts for activities
![]() Known risks
Known risks
![]() Outputs of the work
Outputs of the work
![]() Descriptions of the work packages
Descriptions of the work packages
![]() Supporting details
Supporting details
Decomposing the Project Work Packages
The WBS, the collection of deliverable-orientated components, must now be broken down into activities. Specifically, the work packages within the WBS must be decomposed into manageable work elements. What’s the difference between decomposing the project deliverables and the project work? The elements in the WBS are deliverables; this process is concerned with the actions needed to create the deliverables.
It’s quite possible to create the WBS and the activity list in tandem. Don’t get too caught up in the timing of the activity list definition and the WBS. Simply put, the WBS describes the components of the deliverables, and the activity list defines the actions needed to create the deliverables. Typically, the project manager and the project team work together to decompose the work packages. In some instances, you’ll find it ideal to use expert judgment to help with the decomposition.

The creation of the WBS and the activity list is not a solo activity. You’ll create the WBS and the activity list along with the project team.
Using Rolling Wave Planning
Have you ever stood in the ocean? Wave after wave knocks up against you. And way out in the distance, you can see a crest of water that glides along the surface until it crashes at your knees. In project management, the concept of a rolling wave plan is similar to your ocean visit.
Work that is imminent is planned in detail, while work that is way off in the future is planned at a high level. As the work in the future approaches, more detail is allotted to planning for it. Rolling wave planning enables the project team to focus planning on pressing matters as the project moves toward completion. This is a form of progressive elaboration.
Project teams that subscribe to the agile project management methodology use a form of the rolling wave plan. In the agile approach, you’ll create deliverables through shorter cycles of work, with lots of evidence of quick planning, quick bursts of execution, and a deliverable to show for the work, before the team starts the cycle again.
Using Planning Components
Sometimes the project scope doesn’t include enough detail to help you decompose everything to the smallest level: the work package level in the WBS. This isn’t a problem, but it should be acknowledged during planning. For example, a project to build a home may have defined the room dimensions, lighting needs, and windows, but the specifics on paint color, flooring choices, and exact light fixtures haven’t been defined. You can still plan for these elements with a to-be-determined-later characteristic.
When there isn’t enough information in the project scope to decompose the work to the work packages, the project team can use two planning components:
![]() Management control account This account is a marker that indicates that additional decisions and planning for the work exist below the control account in the WBS. All work and effort for the associated deliverables is documented through a control account plan.
Management control account This account is a marker that indicates that additional decisions and planning for the work exist below the control account in the WBS. All work and effort for the associated deliverables is documented through a control account plan.
![]() Planning packages These allow the project team to position planning activities below the control account but still above the work packages. A planning package is the planning time and activities to determine what should exist within the control account. You could say that the planning package is a visual marker of planning that’s yet to come. This acknowledges the need for future planning while not delaying immediate work on the project.
Planning packages These allow the project team to position planning activities below the control account but still above the work packages. A planning package is the planning time and activities to determine what should exist within the control account. You could say that the planning package is a visual marker of planning that’s yet to come. This acknowledges the need for future planning while not delaying immediate work on the project.
Compiling the Activity List
Ta-da! The primary output of decomposing the work is the activity list, which is a collection of all the work elements required to complete the project. The activity list is not the same as the WBS, but it does correlate to the work packages of the WBS and will serve as a fundamental tool in creating the project schedule. The activity list is needed to ensure that all the deliverables of the WBS are accounted for and that the necessary work is mapped to each deliverable, as shown in Figure 6-2.

FIGURE 6-2 The activity list is created based on the work packages of the WBS.
The activity list also ensures that no extra work is included in the project. Extra work costs time and money—and it defeats the project scope. The WBS comprises all the components the project will create, while the activity list is made up of all the work required to create the components within the WBS.
In addition, the work on the activity list includes attributes of each identified activity. This accomplishes four things:
![]() It ensures that each activity has an identifier.
It ensures that each activity has an identifier.
![]() It ensures that the team members agree on what the work package accomplishes.
It ensures that the team members agree on what the work package accomplishes.
![]() It ensures that the work supports and creates the WBS deliverables.
It ensures that the work supports and creates the WBS deliverables.
![]() It ensures that the work is within the project scope.
It ensures that the work is within the project scope.
Documenting the Activity Attributes
You’ll need to do more than create a shopping list of activities for the project to plan, execute, and control the project work effectively. By documenting the activity attributes, you’re communicating the intent of the project work, the supporting detail of the project decisions, and more. As information becomes available, the activity attributes should be updated to include the following:
![]() Activity name and description Each activity should have its name and description recorded.
Activity name and description Each activity should have its name and description recorded.
![]() Activity ID This is a unique number for each activity in the activity list. It’s especially useful when there are repetitions in the project work, similar activities, or similar activities throughout the project life cycle.
Activity ID This is a unique number for each activity in the activity list. It’s especially useful when there are repetitions in the project work, similar activities, or similar activities throughout the project life cycle.
![]() WBS identifier Each activity is linked to a corresponding WBS package through the WBS code of accounts. This helps link the work to a specific project deliverable.
WBS identifier Each activity is linked to a corresponding WBS package through the WBS code of accounts. This helps link the work to a specific project deliverable.
![]() Relationships The predecessor and successor tasks of each activity may be identified to help with planning and monitoring and controlling processes.
Relationships The predecessor and successor tasks of each activity may be identified to help with planning and monitoring and controlling processes.
![]() Leads and lags If any leads or lags have been added to the activity, this information should be documented as part of the activity attributes.
Leads and lags If any leads or lags have been added to the activity, this information should be documented as part of the activity attributes.
![]() Resource requirements The people, materials, facilities, tools, equipment, and any other resources required to complete the activity should be documented for each activity.
Resource requirements The people, materials, facilities, tools, equipment, and any other resources required to complete the activity should be documented for each activity.
![]() Imposed dates Any constraints, such as must-start-on dates or other deadlines attached to the project activities should be documented.
Imposed dates Any constraints, such as must-start-on dates or other deadlines attached to the project activities should be documented.
![]() Constraints and assumptions All activity-based constraints and assumptions should be documented.
Constraints and assumptions All activity-based constraints and assumptions should be documented.
![]() Activity attributes Activities may have attributes that affect the schedule. Consider geographical locations for the work, specific project team members to complete the activity, required materials and equipment, and other factors.
Activity attributes Activities may have attributes that affect the schedule. Consider geographical locations for the work, specific project team members to complete the activity, required materials and equipment, and other factors.
![]() Additional information Additional information may be unique to the discipline and application area of the project for the project activities.
Additional information Additional information may be unique to the discipline and application area of the project for the project activities.
Project managers should also consider the effort associated with the activities. Level of effort (LOE) activities are support activities that must be done throughout the project, such as reporting and budgeting. Activities that are considered discrete efforts indicate that this work is tied directly to the activities required to complete the project scope (most activities are discrete effort activities). Finally, the project manager must consider apportioned effort. Apportioned effort describes tasks that are more of an umbrella for the entire project, such as quality assurance or even the project management processes.
Finalizing Activity Definition
Activity definition will happen throughout the project, and you’ll revisit the activity list frequently to track activities, predict work that needs to be done, and to track the activities and their completion information. When you create the activities list, there are three additional outputs of this process:
![]() Milestone list A milestone is a timeless event that shows progress. The milestone list documents all the milestones in the project. Milestones can be optional, based on historical information from other projects, or mandatory due to contractual obligations.
Milestone list A milestone is a timeless event that shows progress. The milestone list documents all the milestones in the project. Milestones can be optional, based on historical information from other projects, or mandatory due to contractual obligations.
![]() Change requests As you might expect, defining activities for the project can result in change requests for the project. By defining the activities, you and the team may uncover scope items that need to be added, changes to the predetermined deadline for the project, or any number of changes that must flow through integrated change control.
Change requests As you might expect, defining activities for the project can result in change requests for the project. By defining the activities, you and the team may uncover scope items that need to be added, changes to the predetermined deadline for the project, or any number of changes that must flow through integrated change control.
![]() Project management plan updates Updates to the project management plan will also flow through integrated change control. In this process, you may be updating the schedule and cost baselines as you’re identifying the activities and associated resources needed to complete the activities.
Project management plan updates Updates to the project management plan will also flow through integrated change control. In this process, you may be updating the schedule and cost baselines as you’re identifying the activities and associated resources needed to complete the activities.
CERTIFICATION OBJECTIVE 6.03
Sequencing Activities
After you’ve created the activity list, you need to arrange the activities in a logical sequence. This process calls on the project manager and the project team to identify the logical and preferred relationships among activities. This can be accomplished in a few different ways:
![]() Computer-driven Many different scheduling and project management software packages are available. These programs can help the project manager and the project team determine which actions need to happen and in what order.
Computer-driven Many different scheduling and project management software packages are available. These programs can help the project manager and the project team determine which actions need to happen and in what order.
![]() Manual process On smaller projects, and on larger projects in the early phases, manual sequencing may be preferred. An advantage of manual sequencing is that it can be easier to move around dependencies and activities than it is in some programs.
Manual process On smaller projects, and on larger projects in the early phases, manual sequencing may be preferred. An advantage of manual sequencing is that it can be easier to move around dependencies and activities than it is in some programs.
![]() Blended approach A combination of manual and computer-driven scheduling methods is fine. It’s important to determine the finality of the activity sequence, however. Sometimes a blended approach can be more complex than relying on just one or another.
Blended approach A combination of manual and computer-driven scheduling methods is fine. It’s important to determine the finality of the activity sequence, however. Sometimes a blended approach can be more complex than relying on just one or another.

Using “sticky notes” can help you sequence events. Put your activities on sticky notes and then plot them out on a white board. Draw arrows to show the relationships between activities. Want to make a change? It’s easy to rearrange the notes and the relationships.
Considering the Inputs to Activity Sequencing
There are many approaches to completing the activity sequencing. Perhaps the best approach, however, is to sequence activities with the project team, rather than as a solo activity. The project manager must rely on the project team and the inputs to activity sequencing:
![]() The schedule management plan The schedule management plan defines and directs the process of sequencing the project’s activities.
The schedule management plan The schedule management plan defines and directs the process of sequencing the project’s activities.
![]() Scope baseline The scope baseline is required because it may influence the sequence of events. For example, in construction, technology, or community planning (among other project types), the scope statement may include requirements, constraints, and assumptions that will logically affect the planning of activity sequencing.
Scope baseline The scope baseline is required because it may influence the sequence of events. For example, in construction, technology, or community planning (among other project types), the scope statement may include requirements, constraints, and assumptions that will logically affect the planning of activity sequencing.
![]() The activity list This list shows the actions needed to complete the project deliverables.
The activity list This list shows the actions needed to complete the project deliverables.
![]() Activity attributes Each scheduled activity includes attributes that need to be documented. For example, the successor and predecessor of each activity, the lead and lag information, and the person responsible for completing the activity should all be documented. This information is important when it comes to schedule development and project control.
Activity attributes Each scheduled activity includes attributes that need to be documented. For example, the successor and predecessor of each activity, the lead and lag information, and the person responsible for completing the activity should all be documented. This information is important when it comes to schedule development and project control.
![]() Milestone list Milestones must be considered and evaluated when sequencing events to ensure that all the work needed to complete the milestones is included.
Milestone list Milestones must be considered and evaluated when sequencing events to ensure that all the work needed to complete the milestones is included.
![]() Enterprise environmental factors Enterprise environmental factors can include government and industry standards you must adhere to, your organization’s PMIS and scheduling tool, and a work authorization system.
Enterprise environmental factors Enterprise environmental factors can include government and industry standards you must adhere to, your organization’s PMIS and scheduling tool, and a work authorization system.
![]() Organizational process assets When you consider how most organizations repeat the same type of projects, it’s easy to see why project managers rely on historical information as much as they do. After all, historical information and lessons learned are proven information that can be adapted to the current project. It is part of your organizational process assets. Organizational process assets can also vary if you’re part of a program or have portfolio interdependencies.
Organizational process assets When you consider how most organizations repeat the same type of projects, it’s easy to see why project managers rely on historical information as much as they do. After all, historical information and lessons learned are proven information that can be adapted to the current project. It is part of your organizational process assets. Organizational process assets can also vary if you’re part of a program or have portfolio interdependencies.
Creating Network Diagrams
Network diagrams visualize the project work and show the relationship of the work activities and how they will progress from start to completion. They can be extremely complex or easy to create and configure. Most network diagrams in today’s project management environment use the activity-on-node (AON) approach to illustrate the activities and the relationship between those activities.
Using the Precedence Diagramming Method
The precedence diagramming method (PDM) is the most commonly used method for arranging the project work visually. The PDM puts the activities in boxes or circles, called nodes, and connects the nodes with arrows. The arrows represent the relationship and the dependencies of the work packages. The following illustration shows a simple network diagram using PDM.

PDM is also known as AON—activity-on-node. It’s the most common approach to network diagramming because it’s used by most project management information systems, but it can also be done manually.
Relationships between activities in a PDM constitute one of four different types (as shown in Figure 6-3):

FIGURE 6-3 Task relationships can vary, but finish-to-start is the most common.
![]() Finish-to-start (FS) In this relationship, Task A must be completed before Task B can begin. This is the most common type of relationship. In construction, for example, the foundation must be set before the framing can begin. This is most common type of relationship in the PDM.
Finish-to-start (FS) In this relationship, Task A must be completed before Task B can begin. This is the most common type of relationship. In construction, for example, the foundation must be set before the framing can begin. This is most common type of relationship in the PDM.
![]() Start-to-start (SS) In this relationship, Task A must start before Task B can start. Then both activities can happen in tandem. For example, a crew of painters is painting a house. Task A is to scrape the flaking paint off the house, and Task B is to prime the house. The workers scraping the house must start before the other workers can begin priming the house. All the scraping doesn’t have to be completed before the priming can start—just some of it.
Start-to-start (SS) In this relationship, Task A must start before Task B can start. Then both activities can happen in tandem. For example, a crew of painters is painting a house. Task A is to scrape the flaking paint off the house, and Task B is to prime the house. The workers scraping the house must start before the other workers can begin priming the house. All the scraping doesn’t have to be completed before the priming can start—just some of it.
![]() Finish-to-finish (FF) In this relationship, Task A must finish before Task B does. Ideally, the two tasks should finish at exactly the same time, but this is not always the case. For example, two teams of electricians may be working together to install new telephone cables throughout a building by Monday morning. Team A is pulling the cable to each office. Team B, meanwhile, is connecting the cables to wall jacks and connecting the telephones. Team A must pull the cable to the office so Team B can complete their activity. The activities need to complete at nearly the same time, by Monday morning, so that the new phones are functional when office workers return to work.
Finish-to-finish (FF) In this relationship, Task A must finish before Task B does. Ideally, the two tasks should finish at exactly the same time, but this is not always the case. For example, two teams of electricians may be working together to install new telephone cables throughout a building by Monday morning. Team A is pulling the cable to each office. Team B, meanwhile, is connecting the cables to wall jacks and connecting the telephones. Team A must pull the cable to the office so Team B can complete their activity. The activities need to complete at nearly the same time, by Monday morning, so that the new phones are functional when office workers return to work.
![]() Start-to-finish (SF) This relationship is unusual and is rarely used. It requires Task A to start so that Task B may finish. Such relationships may be encountered in construction and manufacturing. It is also known as just-in-time (JIT) scheduling. An example is a construction of a shoe store. The end of the construction is soon, but an exact date is not known. The owner of the shoe store doesn’t want to order the shoe inventory until the construction is nearly complete. The start of the construction tasks dictates when the shoe inventory is ordered.
Start-to-finish (SF) This relationship is unusual and is rarely used. It requires Task A to start so that Task B may finish. Such relationships may be encountered in construction and manufacturing. It is also known as just-in-time (JIT) scheduling. An example is a construction of a shoe store. The end of the construction is soon, but an exact date is not known. The owner of the shoe store doesn’t want to order the shoe inventory until the construction is nearly complete. The start of the construction tasks dictates when the shoe inventory is ordered.
Determining the Activity Dependencies
The progression of the project is built on the sequence of activities. Activities are dependent on their predecessor activities completing before successor activities may begin. The following are the dependencies you should know for your PMP exam:
![]() Mandatory dependencies These dependencies are the natural order of activities. For example, you can’t begin building your house until its foundation is in place. These relationships are called hard logic.
Mandatory dependencies These dependencies are the natural order of activities. For example, you can’t begin building your house until its foundation is in place. These relationships are called hard logic.
![]() Discretionary dependencies These dependencies are the preferred order of activities. Project managers should use these relationships at their discretion and document the logic behind the decision. Discretionary dependencies allow activities to happen in a preferred order because of best practices, conditions unique to the project work, or external events. For example, a painting project typically allows the paint to be applied within hours of applying the primer. Due to expected high humidity during the project, however, all the building will be completely primed before the paint can be applied. These relationships are also known as soft logic, preferred logic, or preferential logic.
Discretionary dependencies These dependencies are the preferred order of activities. Project managers should use these relationships at their discretion and document the logic behind the decision. Discretionary dependencies allow activities to happen in a preferred order because of best practices, conditions unique to the project work, or external events. For example, a painting project typically allows the paint to be applied within hours of applying the primer. Due to expected high humidity during the project, however, all the building will be completely primed before the paint can be applied. These relationships are also known as soft logic, preferred logic, or preferential logic.
![]() External dependencies As its name implies, these dependencies are outside of the project’s control. Examples include the delivery of equipment from a vendor, the deliverable of another project, or the decision of a committee, lawsuit, or expected new law.
External dependencies As its name implies, these dependencies are outside of the project’s control. Examples include the delivery of equipment from a vendor, the deliverable of another project, or the decision of a committee, lawsuit, or expected new law.
![]() Internal dependencies These dependencies are internal to the organization or even to the project. For example, the project members who are responsible for testing the software can’t test it until the developers complete the software. The project manager can schedule testers, but the start of their activity depends on the completion of the software development by other project team members.
Internal dependencies These dependencies are internal to the organization or even to the project. For example, the project members who are responsible for testing the software can’t test it until the developers complete the software. The project manager can schedule testers, but the start of their activity depends on the completion of the software development by other project team members.
Considering Leads and Lags
Leads and lags are values added to work packages to slightly alter the relationship between two or more work packages. For example, a finish-to-start relationship may exist between applying primer to a warehouse and applying the paint. The project manager in this scenario has decided to add one day of lead time to the work package for painting the warehouse. Now the painting can begin one day before the priming is scheduled to end. Lead time is considered a negative value, because time is subtracted from the downstream activity to bring successor activities closer to the start of the project.
Lag time is waiting time. Imagine a project to install wood floors in an office building. Currently, there is a finish-to-start relationship between staining the floors and adding a layer of shellac to seal the wood floors. The project manager has elected, because of the humidity in the building, to add two days of lag time to the downstream activity of sealing the floors. Now the shellac cannot be applied immediately after the stain but must wait two additional days. Lag is considered a positive value, since time is added to the project schedule.

How is your lead time? You should be thinking about scheduling your PMP exam soon (if you’ve not done so already). You’ll need lead time to complete the application, get PMI’s approval, and find an open slot at the testing center. You don’t want to complete all your studying and then schedule to pass your exam. Be a good project manager and look for opportunities to save time by completing activities in tandem.
The following illustration shows the difference between lead and lag:

Leads and lags must be considered in the project schedule, since an abundance of lag time can increase the project duration. An abundance of lead time, while decreasing duration, may increase risks. When a project is using an abundance of lead time, it’s often in a rush to meet a deadline. Rushing the project can lead to a rush in the execution, quality control, and inspections, and ultimately to rejection from the stakeholders. Too much lead can also cause some wonky scheduling issues, as a resource may be needed on two overlapping tasks due to the added lead time. It’s okay to use lead time, but always consider the risks that too much lead can have on the project.
In a project network diagram, lag time is shown as positive time and lead is shown as negative time. For example, Activities C and D could be a start-to-start, but D could lag three days after activity C. That’d be represented as C SS +3.
Utilizing Network Templates
Just as a project manager can rely on WBS templates, network templates may be available to help streamline the planning process or to conform to a predetermined standard. Network templates can represent an entire project if appropriate, though portions of a network template, such as the required project management activities, are common.
The portions of a network template are also known as subnets, or fragnets. Subnets are often associated with repetitive actions within a network diagram. For example, each floor in a high-rise apartment building may undergo the same or similar actions during construction. Rather than complete the network diagram for each floor, a subnet can be implemented.
Examining the Sequencing Outputs
There are many approaches to using activity sequencing: a project manager and the project team can use software programs, the approach can be done manually, or the team can manually do the scheduling and then transfer the schedule into a project management information system (PMIS). Whichever method is selected, the project manager must remember four things:
![]() Only the required work should be scheduled.
Only the required work should be scheduled.
![]() Finish-to-start relationships are the most common and preferred.
Finish-to-start relationships are the most common and preferred.
![]() Activity sequencing is not the same thing as a schedule.
Activity sequencing is not the same thing as a schedule.
![]() Scheduling comes after activity sequencing.
Scheduling comes after activity sequencing.
Using a Project Network Diagram
Once the activity list has been put into sequential order, the flow of the project work can be visualized. A project network diagram (PND) illustrates the flow of the project work and the relationship between the work packages. PNDs are typically AON, and most PMIS packages use the PDM method. The following illustration is a typical example of a network diagram.

Network diagrams may include summary activities, also known as hammock activities. Accompanying the network diagram should be an explanation of the workflow, why decisions were made, and details on any preferred logic the project manager may have used. A network diagram is just a flow chart: it shows how the project work should flow from its launch to its conclusion. Should changes enter the project scope, the WBS will need to be updated, which will likely cause the activity list to be updated, which will, in turn, cause the network diagram to be updated to reflect the new project requirements.
Risks in the project can affect the project schedule, too. Rushed work, unrealistic deadlines, and a lack of resources are all common risks that affect the project completion.
Updating the Project Documents
When sequencing the project work, the project team and the project manager may discover discrepancies or inadequacies in the existing WBS. Updates to the WBS enable the project manager to ensure that all the needed project deliverables are included in the WBS, and then she can map the discovered deliverables to the identified work in the activity list. Updates to the WBS are called refinements. As the project moves toward completion, refinements ensure that all the deliverables are accounted for within the WBS. They may also indirectly call for updates to the activity list.
Four project documents may be updated as a result of this process:
![]() Activity attributes Any information regarding a required sequence, leads, or lags should be included as part of the attributes.
Activity attributes Any information regarding a required sequence, leads, or lags should be included as part of the attributes.
![]() Activity list Relationships among activities that have changed during the sequencing activities should be updated.
Activity list Relationships among activities that have changed during the sequencing activities should be updated.
![]() Assumption log Any assumptions and constraints in the assumptions log that affect the activity sequencing should be updated.
Assumption log Any assumptions and constraints in the assumptions log that affect the activity sequencing should be updated.
![]() Milestone list Any target or imposed dates for milestones may need to be updated based on the activities sequenced.
Milestone list Any target or imposed dates for milestones may need to be updated based on the activities sequenced.
CERTIFICATION OBJECTIVE 6.04
Estimating Activity Durations
Ready for a loaded question? “Now how long will all of this take?” Project managers hear this one all the time, right? And maybe right after that, “How much will all of this cost?” We’ll talk about cost estimates in Chapter 7. For now, let’s talk about time.
The answer to the question “How long will it take?” depends on the accuracy of the estimates, the consistency of the work, and other variables within the project. The best a project manager can do is create honest estimates based on the information he’s been provided. Until the schedule is finalized, and the project is complete, no one will know the duration of the project.
Usually, the tasks are first identified, the sequencing of the activities takes place, resources are defined, and then durations are estimated. However, it’s perfectly normal for the sequencing of activities to be created apart from resource definition and even the duration estimating. These activities are required to complete the project schedule and the estimated project duration. These four activities are iterated as more information becomes available. If the proposed schedule is acceptable, the project can move forward. If the proposed schedule takes too long, the scheduler can use a few strategies to compress the project. We’ll discuss the art of scheduling shortly.
Activity duration estimates, like the activity list and the WBS, don’t come from the project manager—they come from the people completing the work. They may also undergo progressive elaboration. In this section, we’ll examine the approach to completing activity duration estimates, the basis of estimates, and the allowance for activity list updates.
Considering the Activity Duration Estimates Inputs
The importance of accurate estimates is paramount. The activity estimates will be used to create the project schedule and predict when the project should end. Inaccurate estimates could cost the performing organization thousands of dollars in fines, lost opportunities, lost customers, or worse. To create accurate estimates, the project manager and the project team will rely on several inputs:
![]() Schedule management plan The schedule management plan defines the approved approach for estimating the duration of project activities.
Schedule management plan The schedule management plan defines the approved approach for estimating the duration of project activities.
![]() Scope baseline Identification of the project constraints and assumptions is needed, since they may influence the estimates. The project scope statement provides this information.
Scope baseline Identification of the project constraints and assumptions is needed, since they may influence the estimates. The project scope statement provides this information.
![]() Activity attributes Effort is the amount of labor applied to a task. Duration, on the other hand, is how long the task is expected to take with the given amount of labor. For example, a task to unload a freight truck may take eight hours with two people assigned to the task. If the effort is increased by adding more labor to the task (in this instance, more people), then the duration of the task is decreased. Some activities, however, have a fixed duration and are not affected by the amount of labor assigned to the task. For example, installing a piece of software on a computer will take the same amount of time if one computer administrator is completing the work or if two computer administrators are doing it.
Activity attributes Effort is the amount of labor applied to a task. Duration, on the other hand, is how long the task is expected to take with the given amount of labor. For example, a task to unload a freight truck may take eight hours with two people assigned to the task. If the effort is increased by adding more labor to the task (in this instance, more people), then the duration of the task is decreased. Some activities, however, have a fixed duration and are not affected by the amount of labor assigned to the task. For example, installing a piece of software on a computer will take the same amount of time if one computer administrator is completing the work or if two computer administrators are doing it.
![]() Activity list You know this, right? The activity list is the work elements necessary to create the deliverables.
Activity list You know this, right? The activity list is the work elements necessary to create the deliverables.
![]() Assumption log This log lists all assumptions and constraints that can affect the activities to be schedule and estimated in the project.
Assumption log This log lists all assumptions and constraints that can affect the activities to be schedule and estimated in the project.
![]() Lessons learned register Lessons learned can help the project manager and team better create estimates for the current project.
Lessons learned register Lessons learned can help the project manager and team better create estimates for the current project.
![]() Milestone list The milestones give an ordering of activities, to a degree, and they’ll help you plan the work in order to hit the high-level milestone dates.
Milestone list The milestones give an ordering of activities, to a degree, and they’ll help you plan the work in order to hit the high-level milestone dates.
![]() Project team assignments Work assignments will help the project manager plan for when work can happen, make certain there aren’t resource shortages, and plan for who’ll be doing what work when.
Project team assignments Work assignments will help the project manager plan for when work can happen, make certain there aren’t resource shortages, and plan for who’ll be doing what work when.
![]() Resource breakdown structure The breakdown of the project scope and the needed resources for the activities helps the project manager and the project team visualize when resources will be needed and for what duration.
Resource breakdown structure The breakdown of the project scope and the needed resources for the activities helps the project manager and the project team visualize when resources will be needed and for what duration.
![]() Resource calendars Resource calendars are needed to predict when people, equipment, and facilities are available for scheduling. The total labor may not change on a task, but the duration could be affected by other commitments of project team members, facilities, and equipment.
Resource calendars Resource calendars are needed to predict when people, equipment, and facilities are available for scheduling. The total labor may not change on a task, but the duration could be affected by other commitments of project team members, facilities, and equipment.
![]() Activity resource requirements Activity resource requirements define the resources that are needed to complete an activity. For example, a project to build a home will require lots of different resources: plumbers, electricians, architects, framers, and landscapers. The project manager would not, however, assign all the different resources to every task, but only to the tasks that the resource was qualified to complete. Remember that resources also include equipment and materials, so those are identified as part of the activity resource requirements as well.
Activity resource requirements Activity resource requirements define the resources that are needed to complete an activity. For example, a project to build a home will require lots of different resources: plumbers, electricians, architects, framers, and landscapers. The project manager would not, however, assign all the different resources to every task, but only to the tasks that the resource was qualified to complete. Remember that resources also include equipment and materials, so those are identified as part of the activity resource requirements as well.
![]() Risk register The risk register is considered because the risk’s probability and impact may affect the predicted duration of an activity. A risk response may require additional work in the project that could cause activity durations to increase.
Risk register The risk register is considered because the risk’s probability and impact may affect the predicted duration of an activity. A risk response may require additional work in the project that could cause activity durations to increase.
![]() Enterprise environmental factors Organizational policies can affect the duration estimating techniques the project manager uses. For example, the organization may limit the number of hours employees can contribute to a project, or agreements with unions could affect the duration of the activities in the project.
Enterprise environmental factors Organizational policies can affect the duration estimating techniques the project manager uses. For example, the organization may limit the number of hours employees can contribute to a project, or agreements with unions could affect the duration of the activities in the project.
![]() Commercial duration estimating database Commercial duration estimating databases can offer information on how long industry-specific activities should take. These databases should take into consideration the materials and the experience of the resources and define the assumptions the predicted work duration is based upon.
Commercial duration estimating database Commercial duration estimating databases can offer information on how long industry-specific activities should take. These databases should take into consideration the materials and the experience of the resources and define the assumptions the predicted work duration is based upon.
![]() Organizational process assets Okay, the big one here is historical information. Historical information is always an excellent source for information on activity duration estimates. It can come from several sources, such as the following:
Organizational process assets Okay, the big one here is historical information. Historical information is always an excellent source for information on activity duration estimates. It can come from several sources, such as the following:
![]() Historical information can come from project files of other projects within the organization.
Historical information can come from project files of other projects within the organization.
![]() Project team members may recollect information regarding the expected duration of activities. While these inputs are valuable, they are generally less valuable than documented sources such as project files from other projects or the commercial databases.
Project team members may recollect information regarding the expected duration of activities. While these inputs are valuable, they are generally less valuable than documented sources such as project files from other projects or the commercial databases.
The project manager and the project team should evaluate the project risks when it comes to project duration. We’ll discuss risk in detail in Chapter 11. Risks, good or bad, can influence the estimated duration of activities. The risks on each activity should be identified, analyzed, and then predicted as to their probability and impact. If risk mitigation tasks are added to the schedule, the mitigation activities will need their durations estimated and then sequenced into the schedule in the proper order. The project activity cost estimates, if they exist yet, should also be referenced during activity duration estimates to determine the most cost-effective amount of labor or resources to apply to any given activity.
Estimating the Project Work Considerations
The identified resource requirements will affect the project schedule. Remember the difference between duration and effort? Duration is how long the activity will take, and effort is the labor applied to the task. For example, painting a building may take 80 hours to complete with two workers assigned to the job. Add two more workers, and now the work will take only 40 hours. The duration to complete the painting is 40 hours, but there will still be 160 hours of effort expended on the activity. At some point in the work, the “duration to effort ratio” becomes saturated, and adding laborers will become counterproductive. This is the law of diminishing returns. The following illustration demonstrates the example.

In agile projects, you’ll host planning meetings at the beginning of iterations, called sprints, to determine how many user stories the team will be able to create in each time-boxed sprint session. Recall that user stories are prioritized requirements from the product backlog. A sprint planning session is held on the first day of the iteration, and the product owner, the person that helps prioritize the backlog, the project manager, and the project team will work together to determine how many user stories the team can realistically accomplish in the current iteration. The meeting’s goal is also to create an iteration backlog for the current sprint; to identify any assumptions, risks, and activity dependencies for ordering; and to assign actions to the project team.
Considering Resource Availability
In a perfect world, all the needed resources for a project would be available whenever the project manager says so. In the real world, however (and on your PMP exam), the availability of project resources fluctuates due to the demands of other projects, the demands of ongoing operations, personal lives, vacations, sick days, and more. Organizational process assets and enterprise environmental factors can also guide the project manager and project team as to when certain resources may be needed, or allowed, in a project.
The availability of the project pool must be evaluated. If certain activities require a worker with a highly specialized skill, these activities are resource-dependent. Should the worker not be available for the time frame of the required activity, one of several things must happen:
![]() The project manager must negotiate to make the resource available for the activity in the project schedule.
The project manager must negotiate to make the resource available for the activity in the project schedule.
![]() The activity must be moved in the schedule to when the resource is available.
The activity must be moved in the schedule to when the resource is available.
![]() The activity, and possibly the project, must wait for the resource to become available.
The activity, and possibly the project, must wait for the resource to become available.
![]() The project may incur additional costs in finding other resources to complete the scheduled work.
The project may incur additional costs in finding other resources to complete the scheduled work.
Resources mean more than just people. The project manager must also consider physical resources such as equipment, facilities, software, and other materials. With each nonhuman resource, the project manager must consider the cost and procurement procedures needed to acquire it. We’ll discuss procurement in more detail in Chapter 12.
When a resource is needed but is not available, the project manager must negotiate to secure the resource. This may involve tradeoffs between projects or additional expenses as the activity is outsourced to a vendor to complete the work. The project manager does not want to delay the project because of having to wait on a resource.
Considering the Calendars
Two calendar types will affect the project:
![]() The project calendar This calendar shows when work is allowed on the project. For example, a project may require the project team to work nights and weekends so as not to disturb the ongoing operations of the organization during working hours. In addition, the project calendar accounts for holidays, working hours, and work shifts that the project will cover.
The project calendar This calendar shows when work is allowed on the project. For example, a project may require the project team to work nights and weekends so as not to disturb the ongoing operations of the organization during working hours. In addition, the project calendar accounts for holidays, working hours, and work shifts that the project will cover.
![]() The resource calendar The resource calendar controls when resources such as project team members, consultants, and SMEs are available to work on the project. It considers vacations, other commitments within the organization, or restrictions on contracted work, overtime issues, and so on.
The resource calendar The resource calendar controls when resources such as project team members, consultants, and SMEs are available to work on the project. It considers vacations, other commitments within the organization, or restrictions on contracted work, overtime issues, and so on.
The consideration of the project calendar and the resource calendar is mandatory to predict when a project may realistically begin and end. Figure 6-4 shows the project calendar setting from Microsoft Project. Keep in mind that the PMP exam is not concerned with which PMIS system is used, only that you understand the role of the PMIS.

FIGURE 6-4 Project calendars determine when the project work may take place.
Creating a Resource Breakdown Structure
A resource breakdown structure, like the work breakdown structure, is a decomposition of the utilization of the project resources by category, phases, or types of resources. It’s a visual mapping of the types of resources the project requires, organized by logical groupings. In a construction project, the project manager may create a resource breakdown structure using the construction phases, whereas in an IT project, the project manager may use hardware, software, network, and data as the categories. In either instance, the project manager would include all resources needed—both people and things.
Updating the Activity List
During the creation of the network diagram, assumptions about the activity sequence may reveal missing activities in the activity list. Just as the creation of the activity list may prompt the project team and the project manager to update the WBS, the creation of the network diagram may prompt the project team to update the activity list.
While this may seem redundant—updating the activity list illustrated in the project network diagram—it is essential documentation. A reflection of the WBS, the activity list and the network diagram should both support the project scope. A key stakeholder should thus be able to follow the logic of the WBS to the activity list, and from the activity list, find all the activities mapped in order.
Applying Expert Judgment
The project manager and the project team should utilize expert judgment, if possible, to predict the duration of project activities. Expert judgment can come from SMEs, project team members, and other resources, internal or external to the performing organization, who are familiar with the activities the project demands.
Estimating durations is not easy, as many variables can influence an activity’s duration. Consider the amount of resources that can be applied to the activities, the experience of the resources completing this type of work, and their competence with the work packages.
A big dose of reality is also needed with activity duration estimates. Imagine an activity that has been estimated to take 40 hours. Although on paper that looks like a typical workweek, it’s unlikely the task will be completed within one week. Why? Consider all the phone calls, impromptu meetings, e-mail, and other interruptions throughout the day. These slivers of time chip away at the actual productive hours within a workday. The project manager should find a base of actual productive hours per day based on typical interruptions, meetings, and so on—for example, 6 productive hours out of 8 working hours is typical. Based on this assumption, a task slated to last 40 hours will take nearly seven working days to complete.
Creating an Analogy
Analogous estimating relies on historical information to predict what current activity durations should be. Analogous estimating, also known as top-down estimating, is a form of expert judgment. In analogous estimating, the durations of activities from a historical project that are similar in nature are used to predict the durations of similar activities in the current project.
A project manager must consider whether the work has ever been done before and, if so, what help the historical information will provide. The project manager must consider the resources, project team members, and equipment that completed the activities in the previous project compared to the resources available for the current project. Ideally, the activities should be more than similar; they should be identical. And the resources that completed the work in the past should be the same resources used in completing the current work.
When the only source of activity duration estimates is the project team members instead of expert judgment and historical information, your estimates will be uncertain and inherently risky.
Analogous estimating uses historical information and is more reliable than recollections from project team members. It’s a fast method to duration estimating, but it’s also less accurate than other estimating approaches.
Applying Parametric Estimates
Quantitatively based durations use mathematical formulas to predict how long an activity will take based on the “quantities” of work to be completed. For example, a commercial printer needs to print 100,000 brochures. The workers include two pressmen and two bindery experts to fold and package the brochures. The duration is how long the activity will take to complete, and the effort is the total number of hours (labor) invested because of the resources involved. The decomposed work, with quantitative factors, is shown in Table 6-1.
TABLE 6-1 Decomposed Work with Quantitative Factors

Duration is how long an activity takes, while effort is the billable time for the labor to complete the activity. Consider an activity that is scheduled to last 40 hours. The project manager must consider the cost of the person’s time assigned to complete the project work—for example, a senior full-time engineer versus a part-time person at a lower cost. The senior engineer may be able to complete the activity in 40 consecutive work hours, but the cost of this employee’s time may be more than the value of the activity. The part-time employee may be able to complete the task in two segments of 25 hours, but his time is billed at a substantially lower rate.
Creating a Three-Point Estimate
How confident can a project manager be when it comes to estimating? If the project work has been done in past projects, the level of confidence in the duration estimate is probably high. But if the work has never been done before, there are lots of unknowns—and with that comes risk. To mitigate the risk, the project manager can use a three-point estimate, which requires that for each activity, optimistic, most likely, and pessimistic time estimates are created. Based on these three time estimates, the project manager can create an average to predict how long the activity should take (see Figure 6-5).

FIGURE 6-5 Three-point estimates rely on averages to predict duration.
If you’re thinking this sounds a lot like the program evaluation and review technique (PERT), you’re correct. The formula for PERT is similar to a three-point estimate but differs slightly: (Optimistic time + (4 × Most likely time) + Pessimistic time)/6. It’s six factors instead of three, because you’re using six factors in the numerator. PERT, as you can tell from the formula, uses a weighted average, because the “most likely” estimate is overrepresented in the calculation. The three-point estimate is an average of all the equal factors.
A three-point estimate using the average of optimistic, most likely, and pessimistic is also known as triangular distribution. The PERT approach, using (Optimistic time + (4 × Most likely time) + Pessimistic time)/6 is also known as beta distribution.
Creating a Bottom-Up Estimate
Bottom-up estimating is usually a term associated with cost estimates, but you can use this for resource estimating, too. The approach requires you to have a fully decomposed WBS for each work package, and then you estimate how many and what type of resources you’ll need to create that work package. Each work package can have multiple activities associated with it, so the duration of each work package is estimated for its duration based on the number of resources you’ll assign to do the work. This approach takes longer than other approaches, but it’s also the most accurate. It’s called bottom-up because you’re starting at the bottom and working your way up to predict the total duration for the project.
Using the Delphi Technique
The Delphi Technique uses rounds of anonymous surveys to build consensus on project decisions. In activity duration estimating, this approach could be utilized to predict how long an activity should take the project team to complete. For example, consider an activity to create a web site as part of the project deliverable. On the project team, there may be six people who are qualified to predict how long the web site creation would take, and each web designer may give a different estimate of the duration for that task. Or the designers may create some conformance based on what others say for the duration.
Using the Delphi Technique, the six designers would submit an anonymous prediction of how long the task would take to complete. Then the project manager would create a second survey so each designer could comment, consider, and even repredict their estimate based on what others have said. The project manager would continue to create rounds of surveys for this task to build a consensus among the designers regarding how long the task is likely to take to complete.
Using the Fist-to-Five Approach
This decision-making technique calls for the project team members and experts participating in the estimating planning sessions to vote on the decision. Participants will show their level of support for a decision by showing their fist, which means zero support, or any number of fingers from one to five, where one is low and five is high. Though you’ll usually see this approach in agile projects, you can use it in predictive approaches, too, for a quick understanding of the participants’ confidence in a duration estimate decision.
When an individual holds up less than three fingers, that person can explain their reasoning for the low score. A conversation follows to support, or debunk, the opinion and the participants can revote. The process continues until there is a consensus on what the duration of the activity should be.
Factoring in Reserve Time
Parkinson’s Law states, “Work expands to fill the time available for its completion.” This little nugget of wisdom is oh-so-true. Consider a project team member who knows an activity should last 24 hours. The team member decides, in his own wisdom, to say the activity will last 32 hours. This extra 8 hours, he figures, will allow plenty of time for the work to be completed should any unforeseen incidents pop up. The trouble is, however, that the task will magically expand to require the complete 32 hours. Why does this happen? Consider the following:
![]() Hidden time Hidden time, the time factored in by the project team member, is secret. No one, especially the project manager, knows why the extra time has been factored into the activity. The team member can then “enjoy” the extra time to complete the task at her leisure.
Hidden time Hidden time, the time factored in by the project team member, is secret. No one, especially the project manager, knows why the extra time has been factored into the activity. The team member can then “enjoy” the extra time to complete the task at her leisure.
![]() Procrastination Most people put off starting a task until the last possible minute. The trouble with bloated, hidden time is that people may wait through the additional time they’ve secretly factored into the activity. Unfortunately, if something does go awry in completing the activity, the work result is later than predicted.
Procrastination Most people put off starting a task until the last possible minute. The trouble with bloated, hidden time is that people may wait through the additional time they’ve secretly factored into the activity. Unfortunately, if something does go awry in completing the activity, the work result is later than predicted.
![]() Demands Project team members may be assigned to multiple projects with multiple demands. The requirement to move from project to project can shift focus, result in a loss of concentration, and require additional ramp-up time as workers shift from activity to activity. The demand for multitasking enables project team members to take advantage of hidden time.
Demands Project team members may be assigned to multiple projects with multiple demands. The requirement to move from project to project can shift focus, result in a loss of concentration, and require additional ramp-up time as workers shift from activity to activity. The demand for multitasking enables project team members to take advantage of hidden time.
![]() On schedule Activities are typically completed on schedule or late, but rarely early. A user who has bloated the activity duration estimates may finish his task ahead of what he promised, but he may tend to hold onto those results until the activity’s due date. This is because workers aren’t usually rewarded for completing work early. In addition, workers don’t want to reveal the inaccuracies in their time estimates. Workers may believe future estimates may be based on actual work durations, rather than estimates, so they’ll “sandbag” the results to protect themselves—and finish “on schedule.”
On schedule Activities are typically completed on schedule or late, but rarely early. A user who has bloated the activity duration estimates may finish his task ahead of what he promised, but he may tend to hold onto those results until the activity’s due date. This is because workers aren’t usually rewarded for completing work early. In addition, workers don’t want to reveal the inaccuracies in their time estimates. Workers may believe future estimates may be based on actual work durations, rather than estimates, so they’ll “sandbag” the results to protect themselves—and finish “on schedule.”
Contingency reserve is time, usually in the form of money to pay for the labor usage, built into the project schedule for known-unknowns, which are risk events. Contingency reserve can be quickly created with an overall percentage of the project schedule or assigned to activities. Contingency reserve is calculated through quantitative risk analysis, something I’ll discuss in more detail in Chapter 11 on project risk management.
Another reserve type is management reserve. Management reserve time is a percentage of the project duration or a preset number of work periods and is usually added to the end of the project schedule. Management reserve time may also be added to individual activity durations based on risks or uncertainties in the activity durations. When an activity is completed late, the additional time for the activity is subtracted from the reserve time. As the project moves forward, the reserve time can be reduced or eliminated as the project manager sees fit. Management reserve is for unknown-unknowns, also risk events, but are specific to activities. Management reserve is not part of the schedule baseline, because you don’t know for certain where, or if, the reserve will be utilized in the project. Management reserves are included as part of the overall project duration, however.
Evaluating the Estimates
The result of estimating activities provides the following three things:
![]() Activity duration estimates Activity duration estimates reflect how long each work package will take to complete. A duration estimate should include an acknowledgment of the range of variance. For example, an activity whose duration is expected to be one week may have a range of variance of one week ± three days. This means the work can take up to eight days or as little as two days. This is assuming a week is five days. You might also add a degree of confidence to the activity estimates, such as being 90 percent certain the task duration estimates are accurate.
Activity duration estimates Activity duration estimates reflect how long each work package will take to complete. A duration estimate should include an acknowledgment of the range of variance. For example, an activity whose duration is expected to be one week may have a range of variance of one week ± three days. This means the work can take up to eight days or as little as two days. This is assuming a week is five days. You might also add a degree of confidence to the activity estimates, such as being 90 percent certain the task duration estimates are accurate.
![]() Basis of estimates Documentation of how you and the team arrived at the duration estimates is also important. You’ll define how an estimate was created, assumptions made about the estimate, and known constraints, and you’ll identify any risks associated with the activity that could affect the project schedule.
Basis of estimates Documentation of how you and the team arrived at the duration estimates is also important. You’ll define how an estimate was created, assumptions made about the estimate, and known constraints, and you’ll identify any risks associated with the activity that could affect the project schedule.
![]() Project document updates Estimating the duration of the project activities may prompt the project manager to update the project documents. Any assumptions made during the activity estimating process should be identified. In addition, any historical information, SMEs, or commercial estimating databases that were used should also be documented for future reference. The project manager may also need to update the activity attributes to describe the nature of the work, specific directions for the work, timing concerns, and other relevant information. You’ll update the activity attributes, assumption log, and lessons learned register as needed.
Project document updates Estimating the duration of the project activities may prompt the project manager to update the project documents. Any assumptions made during the activity estimating process should be identified. In addition, any historical information, SMEs, or commercial estimating databases that were used should also be documented for future reference. The project manager may also need to update the activity attributes to describe the nature of the work, specific directions for the work, timing concerns, and other relevant information. You’ll update the activity attributes, assumption log, and lessons learned register as needed.
CERTIFICATION OBJECTIVE 6.05
Developing the Schedule
Now that the estimates for the activities are completed, it’s time to work some magic and see how long the entire project will take by putting the activities in the order they should, and can, happen. The project manager specifically pursues the start date and, more importantly, the completion date. Projects that don’t provide realistic schedules aren’t likely to get approved. Or worse, the projects will get approved, but they will most likely fail, as the project team will not be able to meet the unrealistic schedule.
The creation of the project schedule model is iterative. It’s rare for a schedule to get created, approved, and implemented without some iterative examination, arrangement, and management input—though on smaller projects it may be possible. When activity list updates, constraints, assumptions, and other inputs are considered, it’s easy to see why scheduling can become complex.
There are five inputs to the schedule development process:
![]() Project management plan This plan specifies schedule management plan and the scope baseline.
Project management plan This plan specifies schedule management plan and the scope baseline.
![]() Project documents You’ll reference the activity list and attributes, assumption log, basis of estimates, duration estimates, lessons learned register, milestone list, project schedule network diagram, team assignments, resource calendars, resource requirements, and risk register.
Project documents You’ll reference the activity list and attributes, assumption log, basis of estimates, duration estimates, lessons learned register, milestone list, project schedule network diagram, team assignments, resource calendars, resource requirements, and risk register.
![]() Agreements The contracts with vendors and agreements with other departments or organizations can affect your schedule development.
Agreements The contracts with vendors and agreements with other departments or organizations can affect your schedule development.
![]() Enterprise environmental factors This is where rules and policies are referenced.
Enterprise environmental factors This is where rules and policies are referenced.
![]() Organizational process assets Historical information, templates, and other historical information can be an input.
Organizational process assets Historical information, templates, and other historical information can be an input.
Revisiting the Project Network Diagram
The PND illustrates the project. Recall that the PND shows the sequence of activities and the relationship between activities. It is important during schedule creation, because it allows the project manager and the project team to evaluate the decisions, constraints, and assumptions that were made earlier in the process to determine why certain activities must occur in a particular order.
Hard logic and soft logic must be evaluated to confirm that the decisions and logic are feasible and accurate, and that they fit within the expected completion of the project. The following illustration shows a simple PND for a small project.

Relying on Activity Duration Estimates
Another key input to schedule creation is the activity duration estimates and the basis of estimates. Makes sense, right? The project manager needs to know how long the whole project will take, so the activity duration estimates will help calculate that. Recall, however, the range of variances for each activity—these possible variances need to be accounted for in the actual project schedule creation. We’ll discuss the schedule creation shortly.
Evaluating the Project Constraints
Constraints will restrict when and how the project may be implemented. They are added to a project for a purpose, not just to rush the work to completion. It’s important to understand why a constraint has been imposed. The following offers a few common examples as to why constraints exist:
![]() To take advantage of an opportunity to profit from a market window for a product or service
To take advantage of an opportunity to profit from a market window for a product or service
![]() To work within the parameters of expected weather conditions (for seasonal or outdoor projects)
To work within the parameters of expected weather conditions (for seasonal or outdoor projects)
![]() To adhere to government requirements
To adhere to government requirements
![]() To adhere to industry regulations, best practices, or guidelines
To adhere to industry regulations, best practices, or guidelines
![]() To work within time frames that incorporate the expected delivery of materials from vendors or other projects
To work within time frames that incorporate the expected delivery of materials from vendors or other projects
Perhaps one of the biggest constraints is the predetermined project deadline. Imagine a company creating a product to take to a trade show. If the creation of the product is running late, the trade show isn’t going to move its date back so the product has enough time to be completed for the show.
There are four time constraints to consider:
![]() Start no earlier than (SNET) This constraint requires that the project or activity not start earlier than the predetermined date. Consider an activity to add software to an existing network server in a IT project. The project manager adds a “start no earlier than” constraint to the activity to ensure the activity begins on a Saturday when the server is not in use by the organization. The activity can begin any time after the preset date, but not before it.
Start no earlier than (SNET) This constraint requires that the project or activity not start earlier than the predetermined date. Consider an activity to add software to an existing network server in a IT project. The project manager adds a “start no earlier than” constraint to the activity to ensure the activity begins on a Saturday when the server is not in use by the organization. The activity can begin any time after the preset date, but not before it.
![]() Start no later than (SNLT) This constraint requires the activity to begin by a predetermined date. For example, the creation of a community flower garden must “start no later than” May 15. The creation of the garden may, weather permitting, begin earlier than the preset date, but it must start by that date.
Start no later than (SNLT) This constraint requires the activity to begin by a predetermined date. For example, the creation of a community flower garden must “start no later than” May 15. The creation of the garden may, weather permitting, begin earlier than the preset date, but it must start by that date.
![]() Finish no later than (FNLT) This constraint requires that the project or activity finish by a predetermined date. For example, the installation of flooring tile in a restaurant must be finished by October 25 so the kitchen equipment can be installed. The constraint “finish no later than” is tied to the date of October 25. The activity can end sooner than October 25, but not after that date.
Finish no later than (FNLT) This constraint requires that the project or activity finish by a predetermined date. For example, the installation of flooring tile in a restaurant must be finished by October 25 so the kitchen equipment can be installed. The constraint “finish no later than” is tied to the date of October 25. The activity can end sooner than October 25, but not after that date.
![]() Finish no earlier than (FNET) This somewhat unusual constraint requires the activity to be in motion up until the predetermined date. Consider a project to create a special blend of wine. The wine must be aged a specific amount of time before the winemaking process can continue. Thus, the process requires a set amount of time so it may “finish no earlier than” the determined time. The activity can end any time after the preset date, but not before it.
Finish no earlier than (FNET) This somewhat unusual constraint requires the activity to be in motion up until the predetermined date. Consider a project to create a special blend of wine. The wine must be aged a specific amount of time before the winemaking process can continue. Thus, the process requires a set amount of time so it may “finish no earlier than” the determined time. The activity can end any time after the preset date, but not before it.
Project constraints can also include milestones. The project sponsor may request, for example, a milestone for a deliverable within the project on April 28. Based on this milestone, all the work needed to create a deliverable must be scheduled against the expected due date. In addition, once these milestones are set, it’s darn tough to change them.
Milestone constraints can also be tied to activities outside of the project. Consider a scheduled walkthrough with a customer on a construction project. Or consider the demands of a project to create a product or service by a scheduled milestone that another project within the performing organization is expecting.
The “start no earlier than” and “finish no later than” constraints are your best bets for exam answers, since these are the most common constraints. Remember that constraints can be tied to individual activities within the project or to the entire project.
Reevaluating the Assumptions
Assumptions are beliefs that are held to be true but that may not necessarily be so. Assumptions—such as being able to have access to a building 24 hours a day, seven days a week—can wreak havoc on the project schedule if they are proved false. Consider a schedule that plans on working three shifts during the remodeling of an office building only to discover late in the project planning that the customer will not allow the work to happen during daytime hours. Assumptions factored into the project should be documented and accounted for.
Evaluating the Risk Management Register
Risk and risk management are discussed completely in Chapter 11. For now, know that risks can alter the project schedule—for better or for worse. This isn’t difficult to see. A risk in the project may be identified as delays from the vendor for the equipment needed to complete the project. The response to this risk, should it happen, may be to secure an alternative vendor that charges slightly more for the same equipment but has it in stock. The delay of the equipment with the original vendor may throw the project off schedule, and the additional time to find, purchase, and ship the needed equipment could also add extra time to the project. This is why the risk register is an input to developing the project schedule.
Examining the Activity Attributes
The activity attributes can have a direct impact on the project schedule. Some activities are effort-driven, which means more effort can reduce the duration. Other activities are of fixed duration—that is, additional effort does nothing to reduce their expected duration. Activity attributes are the characteristics of the work to be completed, including the following:
![]() The person(s) responsible for completing each work package
The person(s) responsible for completing each work package
![]() Where the work will take place (building, city, outdoors)
Where the work will take place (building, city, outdoors)
![]() The type of activity (electrical, technical, supervised, and so on)
The type of activity (electrical, technical, supervised, and so on)
![]() When the activity must take place (business hours, off-hours, more unusual times)
When the activity must take place (business hours, off-hours, more unusual times)
Defining the Project Timeline
The project manager, the project team, and possibly even the key stakeholders will examine the inputs previously discussed and apply the techniques discussed in this section to create a feasible schedule for the project. The point of the project schedule is to complete the project scope in the shortest amount of time possible without incurring exceptional costs or risks, or a loss of quality.
Creating the project schedule is part of the planning process group. It is calendar based and relies on both the project network diagram and the accuracy of time estimates.

See the video “Calculating Float.”
Performing Schedule Network Analysis
Schedule network analysis is the process of factoring theoretical early and late start dates and theoretical early and late finish dates for each activity within the PND. The early and late dates are not the expected schedule, but rather a potential schedule based on the project constraints, the likelihood of success, the availability of resources, and other constraints.
The most common approach to calculating when a project may finish is by using the critical path method (CPM). It uses “forward” and “backward” passes to reveal which activities are considered critical. Activities on the critical path may not be delayed; otherwise, the project end date will be delayed. The critical path is the path with the longest duration to completion. To find the critical path, just add up the duration of path from the project start to finish. The longest path is the critical path. Activities not on the critical path have some float (also called slack) that allows some amount of delay without delaying the project end date. In the following illustration, the path EGH is the longest path, with 14 days of duration, so it’s the critical path.

The critical path is used to determine which activities have the least amount of float—typically zero float. You can also use the critical path to determine the earliest date for when the project may be completed. There can be more than one critical path in a project, and it’s possible for the critical path to change as the project proceeds. Technically, the critical path is the minimum project duration; it is the latest time at which a project can complete. The critical path will also reveal the earliest possible day that the project can be completed by.
Calculating Float in a PND
Float, or slack, is the amount of time a task can be delayed without delaying the project’s completion time. Technically, there are four different types of float:
![]() Free float This is the total time a single activity can be delayed without delaying the early start of any successor activities.
Free float This is the total time a single activity can be delayed without delaying the early start of any successor activities.
![]() Total float This is the total time an activity can be delayed without delaying project completion. It’s possible to have positive total float when the project will take less time to complete than the imposed deadline for the project.
Total float This is the total time an activity can be delayed without delaying project completion. It’s possible to have positive total float when the project will take less time to complete than the imposed deadline for the project.
![]() Negative total float A constraint on an activity, such as “the activity must start on a specific date,” or a deadline for the project completion, can cause negative float. This means the activities on the critical path don’t have enough time to meet the defined finish date for the project or the constrained activity.
Negative total float A constraint on an activity, such as “the activity must start on a specific date,” or a deadline for the project completion, can cause negative float. This means the activities on the critical path don’t have enough time to meet the defined finish date for the project or the constrained activity.
![]() Project float This is the total time the project can be delayed without passing the customer-expected completion date.
Project float This is the total time the project can be delayed without passing the customer-expected completion date.
Most project management software will automatically calculate float. Project management software can also help you identify near-critical paths, try what-if scenarios by adding labor, or quickly rearranging the order of tasks to see the effect on the project. On the PMP exam, however, candidates will be expected to calculate float manually. Don’t worry; it’s not too tough. Give it a try:
Follow along with the PND illustrations to find the critical path. The critical path is typically the path with the longest duration and will usually have zero float. The critical path is technically found once you complete the forward and backward passes. Start with the forward pass. After the backward pass, you can identify the critical and near-critical paths, as well as float. In all the illustrations that follow, the activity duration is centered above each node.
1. The early start (ES) and early finish (EF) dates are calculated first by completing the forward pass. The ES of the first task is 1. The EF for the first task is its ES, plus the task duration, minus 1. Don’t let the “minus 1 value” throw you. If Task A is scheduled to last one day, it would only take one day to complete, right? The ES would be 1, the duration is 1, and the EF would also be 1, because the activity would finish within one day, not two days. The following illustration shows the start of the forward pass.

2. The ES of the next task(s) will be the EF for the previous activity, plus 1. In other words, if Task A finishes on day eight, Task B will begin on day nine.
3. The EF for the next task(s) equals its ES, plus the task duration, minus 1. Sound familiar?
4. Now each task moves forward with the forward pass. Use caution when there are predecessor activities; the EF with the largest value is carried forward. The following illustration shows the completed forward pass.

5. After the forward pass is completed, the backward pass starts at the end of the PND. The backward pass is concerned with the late finish (LF) and the late start (LS) of each activity. The LF for the last activity in the PND equals its EF value. The LS is calculated by subtracting the duration of the activity from its LF, plus 1. The 1 is added to accommodate the full day’s work; it’s just the opposite of subtracting the one day in the forward pass. Here’s a tip: The last activity is on the critical path, so its LS will equal its ES.
6. The next predecessor activity’s LF equals the LS of the successor activity, minus 1. In other words, if Task Z has an LS of 107, Task Y will have an LF of 106. The following illustration shows the process of the backward pass.

7. The LS is again calculated by subtracting the task’s duration from the task’s LF, plus 1. The following shows the completed backward pass.

8. To calculate float officially, the LS is subtracted from the ES and the LF is subtracted from the EF. Recall the total float is the amount of time a task can be delayed without delaying the project completion date. The next illustration shows the completed PND with the float exposed.


I bet you’re wishing you could try this one out for yourself, right? You’re in luck! Included with this book is an Adobe PDF document titled “Chapter Six Float Exercise.” This document has a project network diagram that you can print and use to test your float-ability. You can also just create your own diagrams and practice finding float.
See the video “Float Exercise Explained” once you’ve completed the exercise.
Encountering Scheduling on the PMP Exam
You’ll encounter float, scheduling, and critical path activities on the PMP exam. You should count these questions as “gimmies” if you remember a few important rules:
![]() Always draw out the network diagram presented on your scratch paper. It may be used in several questions.
Always draw out the network diagram presented on your scratch paper. It may be used in several questions.
![]() Know how to calculate float. (The complete process was shown earlier in the “Calculating Float in a PND” section.)
Know how to calculate float. (The complete process was shown earlier in the “Calculating Float in a PND” section.)
![]() You may encounter questions that ask on what day of the week a project will end if no weekends or holidays are worked. No problem. Add up the critical path, divide by 5 (Monday through Friday), and then figure out on which day of the week the activity will end.
You may encounter questions that ask on what day of the week a project will end if no weekends or holidays are worked. No problem. Add up the critical path, divide by 5 (Monday through Friday), and then figure out on which day of the week the activity will end.
![]() You may see something like Figure 6-6 when it comes to scheduling. When three numbers are presented, think three-point estimate. Optimistic is the smallest number, pessimistic is the largest, so most likely it’s somewhere between the two. When a number is positioned directly over the tasks, it is the task duration. When a number is positioned to the upper-right corner of a task, this represents the early finish date.
You may see something like Figure 6-6 when it comes to scheduling. When three numbers are presented, think three-point estimate. Optimistic is the smallest number, pessimistic is the largest, so most likely it’s somewhere between the two. When a number is positioned directly over the tasks, it is the task duration. When a number is positioned to the upper-right corner of a task, this represents the early finish date.

FIGURE 6-6 Scheduling follows many rules to arrive at project completion.
Optimizing Resource Utilization
Resource leveling is a method to flatten the schedule when resources are overallocated. Resource leveling can be applied using different methods to accomplish different goals. One of the most common methods is to ensure that workers are not overextended on activities. Figure 6-7 shows a Microsoft Project screen, which shows where resource leveling has been applied.

FIGURE 6-7 Resource leveling flattens the project schedule and will likely extend the project duration.
For example, Sarah is assigned to Task C and Task H, which are planned to happen concurrently. Sarah cannot be in two places at once, so resource leveling changes the timing of the activities so Sarah can complete Task C and then move on to Task H. As expected, however, resource leveling often extends the project end date.
Another method for resource leveling is to take resources from noncritical path activities and apply them to critical path activities to ensure that the project end date is met. This method takes advantage of available slack and balances the expected duration of the noncritical path with the expected duration of the critical path.
Resource leveling also provides for changing the project schedule to allow for long work hours to complete the project work—such as weekends and evenings, or even a second or third shift to bring the project back in alignment. Another approach, also part of resource leveling, is to change the resources, tools, or equipment used to complete the project work faster. For example, a project manager could request that the printer use a different, faster printing press to complete the printing activity than what was originally planned for. Of course, these approaches often increase cost.
Some resources may be scarce to the project. Consider a highly skilled technician or consultant who is available only on a particular date to contribute to the project. These resources are scheduled from the project end date, rather than the start date. This is known as reverse resource allocation scheduling.
Often in project management, you don’t want to change anything dealing with the activities on the critical path. Resource smoothing is a technique that allows you to do resource leveling, but only on noncritical path activities. This approach levels resource utilization by taking advantage of activities that have available float. For those activities with no float, the resource utilization will not be edited.
Applying Duration Compression
Duration compression is also a mathematical approach to scheduling. The trick with duration compression, as its name implies, is calculating ways the project can be completed sooner than expected. Consider a construction project. The project may be slated to last eight months, but due to the expected cold and nasty weather typical of month seven, the project manager needs to rearrange activities where possible to end the project as soon as possible.
In some instances, the relationship between activities cannot be changed due to hard or soft logic. The relationships must remain as scheduled. Now consider the same construction company that is promised a bonus if they can complete the work by the end of month seven. Now there’s incentive to complete the work, but there’s also the fixed relationship between activities.
To apply duration compression, the performing organization can rely on two different methods, which can be used independently or together and are applied to activities or the entire project based on need, risk, and cost:
![]() Crashing This approach adds more resources to activities on the critical path to complete the project earlier. When crashing a project, costs are added as the labor expenses increase. Crashing doesn’t always work. Consider activities that have a fixed duration and won’t be finished faster with additional resources. The project manager must also consider the expenses in relation to the gains of completing on time. For example, a construction company may have been promised a bonus to complete the work by a preset date, but the cost incurred to hit the targeted date is more than what the bonus offers.
Crashing This approach adds more resources to activities on the critical path to complete the project earlier. When crashing a project, costs are added as the labor expenses increase. Crashing doesn’t always work. Consider activities that have a fixed duration and won’t be finished faster with additional resources. The project manager must also consider the expenses in relation to the gains of completing on time. For example, a construction company may have been promised a bonus to complete the work by a preset date, but the cost incurred to hit the targeted date is more than what the bonus offers.
![]() Fast tracking This method changes the relationship of activities. With fast tracking, activities that would normally be done in sequence can be done in parallel or with some overlap. Fast tracking can be accomplished by changing the relationship of activities from FS to SS or by adding lead time to downstream activities. For example, a construction company could change the relationship between painting the rooms and installing the carpet by adding lead time to the carpet installation task. Before the change, all the rooms had to be painted before the carpet installers could begin. With the added lead time, the carpet can be installed hours after a room is painted. Fast tracking increases risk and may cause rework in the project. Can’t you just imagine those workers getting fresh paint on the new carpet? However, it’s often ideal to fast track the project. When it’s done properly and with qualified resources, it’s a huge timesaver.
Fast tracking This method changes the relationship of activities. With fast tracking, activities that would normally be done in sequence can be done in parallel or with some overlap. Fast tracking can be accomplished by changing the relationship of activities from FS to SS or by adding lead time to downstream activities. For example, a construction company could change the relationship between painting the rooms and installing the carpet by adding lead time to the carpet installation task. Before the change, all the rooms had to be painted before the carpet installers could begin. With the added lead time, the carpet can be installed hours after a room is painted. Fast tracking increases risk and may cause rework in the project. Can’t you just imagine those workers getting fresh paint on the new carpet? However, it’s often ideal to fast track the project. When it’s done properly and with qualified resources, it’s a huge timesaver.
It’s easy to remember the difference between these two actions. Crashing and cost both begin with C—we’re adding resources, and too many people will “crash” into each other. Fast tracking is about speeding things up: Haste makes waste—risky.
Using a Project Simulation
Project simulation is a data analysis technique that enables a project manager to examine the feasibility of the project schedule under different conditions, variables, and events. For example, the project manager can see what would happen to a project if activities were delayed, a vendor missed a shipment date, or external events affected the project.
Simulations are often completed with the Monte Carlo analysis, which predicts how scenarios may work out given any number of variables. The process doesn’t churn out a specific answer, but a range of possible answers. When Monte Carlo is applied to a schedule, it can examine, for example, the optimistic completion date, the pessimistic completion date, and the most likely completion date for each activity in the project.
As you can imagine, in a typical network diagram, there are likely thousands, if not millions, of combinations of tasks that complete early, late, or as expected. The Monte Carlo analysis shuffles these combinations, usually through computer software, and offers a range of possible end dates coupled with an expected probability for achieving each end date.
The Monte Carlo analysis can be applied to more than just scheduling. It can be applied to cost, project variables, and, most often, risk analysis.
In other words, the Monte Carlo analysis is an odds-maker. The project manager chooses, or is at least influenced by, the end date with the highest odds of completion relative to the demands for completion by an expected time. The project manager can then predict with some certainty that the project has, for example, an 85 percent chance of completion by a specific date. The Monte Carlo analysis can help predict the probability of reaching a project completion date, milestones, or a specific activity based on current project status or what-if scenarios.
Simulations also provide time to factor in what-if questions, worst-case scenarios, and potential disasters. The result of simulations is to create responses to the feasible situations. Then, should the situations come into play, the project team is ready with a planned response.
Using Project Management Software
When it comes to project management software, take your pick: the market is full of options. Project management applications are tools, not replacements, for the project management process. Many of the software titles today automate the processes of scheduling, activity sequencing, work authorization, and other activities. The performing organization must weigh the cost of the PMIS against the benefits the project manager will gain.
Relying on a Project Coding Structure
The coding structure identifies the work packages within the WBS and is then applied to the PND. This enables the project manager, the project team, experts, and even key stakeholders to extract areas of the project to examine, evaluate, and inspect. For example, a project to create a catalog for a parts distributor may follow multiple paths to completion. Each path to completion has its own “family” of numbers that relate to each activity on the path (see Table 6-2).
TABLE 6-2 Possible Paths in Creating a Catalog

Examining the Project Schedule
The project schedule includes, at a minimum, a date when the project begins and a date when the project is expected to end. The project schedule is considered proposed until the resources needed to complete the project work are ascertained. In addition to including the schedule, the project manager should include all the supporting details. Project schedules can be presented in many different formats, such as the following:
![]() Project network diagram Illustrates the flow of work, the relationship between activities, the critical path, and the expected project end date. PNDs, when used as the project schedule, should have dates associated with each project activity to show when the activity is expected to start and end.
Project network diagram Illustrates the flow of work, the relationship between activities, the critical path, and the expected project end date. PNDs, when used as the project schedule, should have dates associated with each project activity to show when the activity is expected to start and end.
![]() Bar charts Show the start and end dates for the project and the activity duration against a calendar. They are easy to read. Scheduling bar charts are also called Gantt charts.
Bar charts Show the start and end dates for the project and the activity duration against a calendar. They are easy to read. Scheduling bar charts are also called Gantt charts.
![]() Milestone charts Plot out the high-level deliverables and external interfaces, such as a customer walkthrough, against a calendar. Milestone charts are like Gantt charts, but with less detail regarding individual activities. The following is an example of a milestone chart.
Milestone charts Plot out the high-level deliverables and external interfaces, such as a customer walkthrough, against a calendar. Milestone charts are like Gantt charts, but with less detail regarding individual activities. The following is an example of a milestone chart.
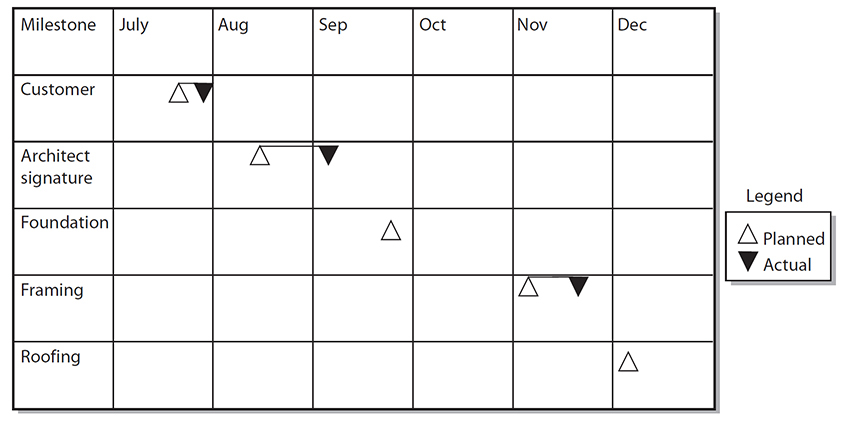
![]() Schedule baseline The agreed-upon project schedule based on your project network diagram. It’s part of the project management plan, and your project progress is compared against the schedule baseline.
Schedule baseline The agreed-upon project schedule based on your project network diagram. It’s part of the project management plan, and your project progress is compared against the schedule baseline.
![]() Schedule data The supporting detail and relevant information for the project schedule. It includes details about the project milestones, project activities and their attributes, and relevant assumptions and constraints.
Schedule data The supporting detail and relevant information for the project schedule. It includes details about the project milestones, project activities and their attributes, and relevant assumptions and constraints.
Utilizing the Schedule Management Plan
The schedule management plan is a subsidiary plan of the overall project plan. It is used to control changes to the schedule. A formal schedule management plan has procedures that control how changes to the project plan can be proposed, accounted for, and then implemented. An informal schedule management plan may consider changes on an instance-by-instance basis.
Updating the Resource Requirements
Due to resource leveling, resources may need to be added to the project. For example, a proposed leveling may extend the project beyond an acceptable completion date. To reach the project end date, the project manager elects to add resources to the critical path activities. The resources the project manager adds should be documented, and the associated costs should be accounted for and approved.
Planning the Schedule in Agile Environments
Agile relies on a product roadmap, sometimes called the product vision, to help the project manager, product owner, and project team see the expectations for the project. Agile planning takes a high-level approach to project schedule planning, usually a three- to six-month view, to predict how the project will move forward. The time-boxed iterations, or sprints, are predetermined durations of project work. Based on how long the project is expected to take and the duration of the sprints, it’s easy to work backward and see how many sprints the project is likely to have. For example, a high-level schedule of six months with four-week sprints will offer a total of six sprints to map to the six-month anticipated schedule for the project work.
A clear understanding of the number of sprints helps the product owner and the team quickly and accurately prioritize the product backlog based on value to be delivered at the start of each iteration. At each iteration, a group of user stories, based on their values, is selected to tackle first. User stories are assigned story points based on their degree of difficulty to create; the more story points a user story has, the more hours of labor it will take to create the requirement.
Reviewing the Results of Developing the Schedule
There are seven outputs of developing the project schedule. Two of the most important outputs are the schedule baseline and the project schedule. The schedule baseline is an approved version of the schedule model. Once the baseline is created and approved, it can be changed only through the project’s integrated change control. The baseline represents what you believe will happen in the project; what actually happens in the project is compared to the baseline. When there is a difference between what was expected and what the baseline predicts, it is called a schedule variance.
The project schedule is the actual schedule of when the work will happen, the relationship between activities, the flow of the activities, the duration of activities, the milestones, and the resources you’ll utilize to complete the project. In almost all cases, the project schedule is presented in a chart or diagram to be most effective. Typical charts include the following:
![]() Gantt charts Bar charts that show the duration of tasks against a calendar. This is the default view you’ve probably seen in Microsoft Project when creating and linking tasks.
Gantt charts Bar charts that show the duration of tasks against a calendar. This is the default view you’ve probably seen in Microsoft Project when creating and linking tasks.
![]() Milestone charts Bar charts that show the target and actual dates for milestone completion.
Milestone charts Bar charts that show the target and actual dates for milestone completion.
![]() Project schedule network diagram Shows the flow of the project work and relationship between activities. Project schedule network diagrams can also show a time scale for the nodes, activity dates, and other information. These schedule network diagrams are called time-scaled logic diagrams.
Project schedule network diagram Shows the flow of the project work and relationship between activities. Project schedule network diagrams can also show a time scale for the nodes, activity dates, and other information. These schedule network diagrams are called time-scaled logic diagrams.
The schedule development process will also create schedule data, such as resource requirements, alternative schedules for best- and worst-case scenarios, consumption of schedule reserves, and possibly resource histograms, cash-flow forecasting, and other scheduling information unique to your organization and project.
Recall the two calendars—the project calendar and the resource calendar. These two calendars will be updated as needed to reflect the scheduling of project work, considerations for project hours, and other data that affects when the project work can take place and when resources are available. You’ll also update the project management plan and documents as needed: schedule management plan, cost baseline, activity attributes, assumption log, duration estimates, lessons learned register, resource requirements, and risk register.
CERTIFICATION OBJECTIVE 6.06
Controlling the Schedule
Throughout a typical project, events will happen that may require updates to the project schedule. Schedule control is concerned with four factors:
![]() It documents the status of the project schedule and manages the schedule baseline.
It documents the status of the project schedule and manages the schedule baseline.
![]() The project manager works with the factors that can cause schedule changes to confirm that the changes are needed, may have already happened, and cannot be avoided, and that the changes are agreed upon. Factors can include project team members, stakeholders, management, customers, and project conditions.
The project manager works with the factors that can cause schedule changes to confirm that the changes are needed, may have already happened, and cannot be avoided, and that the changes are agreed upon. Factors can include project team members, stakeholders, management, customers, and project conditions.
![]() The project manager examines the work results and conditions to determine whether the schedule has changed.
The project manager examines the work results and conditions to determine whether the schedule has changed.
![]() The project manager manages the actual change in the schedule.
The project manager manages the actual change in the schedule.
Projects in agile environments have specific schedule control concerns: comparing the time elapsed to the work delivered, completing lessons learned for work performed, prioritization of remaining work, and managing the rate of delivery for the project deliverables.
Managing the Inputs to Schedule Control
Schedule slippage can be caused by several things: scope creep, underestimating the project work, risks, decisions, and much more. The project manager needs to communicate with the resources and factors that can affect the project schedule throughout the project. This is one area where the project manager can’t assume that everything’s going to work out just fine. Schedule control, the process of managing changes to the project schedule, is based on several inputs:
![]() Project management plan
Project management plan
![]() Schedule management plan
Schedule management plan
![]() Schedule baseline
Schedule baseline
![]() Performance measurement baseline
Performance measurement baseline
![]() Project documents (lessons learned register, project and resource calendars, schedule, schedule data)
Project documents (lessons learned register, project and resource calendars, schedule, schedule data)
![]() Work performance data
Work performance data
![]() Organizational process assets
Organizational process assets
All changes to the schedule baseline must follow the integrated change control process. Schedule control is a formal approach to managing changes to the project schedule. It considers the conditions, reasons, requests, costs, and risks of making changes. It includes methods of tracking changes, approval levels based on thresholds, and the documentation of approved or declined changes. Schedule control is part of integrated change management.
Measuring Project Performance
Data analysis is needed to gain insight into project schedule performance. Poor performance may result in schedule changes. Consider a project team that is completing its work on time, but all the work results are unacceptable. The project team members may be rushing through their assignments to meet their deadlines. To compensate for this, the project may be changed to allow for additional quality inspections and more time for activity completion.
Though a burndown chart is typically used in agile projects, you can implement one to illustrate the amount of work left to do in the project or iteration. A burndown chart, such as the one shown in Figure 6-8, starts in the upper-right corner and predicts the amount of remaining work distributed over the timeline. As work is completed a second line representing the actual work is added to the chart to show any variances between what is happening and what was predicted. Based on current completion of tasks, you can add a third line to represent a trend and offer a new prediction of when the project will be done.

FIGURE 6-8 Burndown charts show the balance of activities, the predicted completion of activities, and the forecast for when activities are likely to be finished.
Examining the Schedule Variance
The project manager must actively monitor the variances between when activities are scheduled to end and when they actually end. An accumulation of differences between schedule baseline and actual dates may result in a schedule variance.
The project manager must also pay attention to the completion of activities on paths with float, not just on the critical path. Consider a project that has eight different paths to completion. The project manager should first identify the critical path, but he should also identify the float on each path. The paths should be arranged and monitored in a hierarchy from the path with the smallest float to the path with the largest float. As activities are completed, the float of each path should be monitored to identify any paths that may be slipping from the scheduled end dates.
Updating the Project Schedule
So what happens when a schedule change occurs? The project manager must ensure that the project schedule is updated to reflect the change, document the change, and follow the guidelines within the schedule management plan. Any formal processes, such as notifying stakeholders or management, should be followed.
Revisions are a special type of project schedule change that cause the project start date and, more likely, the project end date to be changed. They typically stem from project scope changes. Because of the additional work the new scope requires, additional time is needed to complete the project.
Schedule delays, for whatever reason, may be so drastic that the entire project must be rebaselined. Rebaselining is a worst-case scenario and should occur only when adjusting for drastic, long delays. When rebaselining happens, all the historical information up to the point of the rebaseline is eliminated. Schedule revision is the preferred, and most common, approach to changing the project end date.
Applying Corrective Action
Corrective action is any method applied to bring the project schedule back into alignment with the original dates and goals for the project end date. Corrective actions are efforts to ensure that future performance meets the expected performance levels. It includes the following:
![]() Extraordinary measures to ensure that work packages complete as scheduled
Extraordinary measures to ensure that work packages complete as scheduled
![]() Extraordinary measures to ensure that work packages complete with as little delay as possible
Extraordinary measures to ensure that work packages complete with as little delay as possible
![]() Root-cause analysis of schedule variances
Root-cause analysis of schedule variances
![]() Measures to recover from schedule delays
Measures to recover from schedule delays
Writing the Lessons Learned
Lessons learned on creating the schedule, changes to the project schedule, and responses to variances are needed as part of the project’s historical information. Recall that lessons learned documentation happens throughout the project plan, not just at the conclusion of the project.
CERTIFICATION SUMMARY
Projects cannot last forever—thankfully. To finish and manage a project effectively, a project manager must be able to manage time effectively. Within a project, many factors can affect the project length: activity duration, project calendars, resource calendars, vendors, activity sequencing, and more. Schedule management begins with the constraints of the product schedule, the project calendar, and the resource calendars, as well as the activities and their expected duration.
Many projects can rely on project templates that were created for prior successful and similar projects. Other projects, including new and never-attempted technologies, require that a project schedule be created from scratch. The WBS contributes to the activity list, which, in turn, enables the project manager and the project team to begin activity sequencing.
Activities to be sequenced must be estimated. The project manager and the project team must evaluate the required time to complete the work packages. The project manager can rely on several estimating methods to arrive at a predicted duration for activities. For example, a project manager may use analogous estimation of historical data to provide the needed estimate. Or the project manager may use parametric estimating to predict the amount of time required for the activities. The important aspects of estimating are that each work package is considered and its duration calculated.
Within the process of activity sequencing will be hard logic and soft logic. Hard logic is the mandatory relationships between activities: the foundation must be in place before the house framing can begin. Soft logic allows the relationship and order of activities to be determined based on conditions, preferences, or other factors: the landscaping will happen before the house is painted so that dirt and dust won’t ruin the fresh paint.
The relationships of activities are illustrated within a network diagram. Network diagrams show the path from start to completion and identify which activities are on the critical path. Of course, the critical path is the path with the longest duration and typically has zero slack or float. Activities on the noncritical paths may be delayed to the extent that they do not delay activities on the critical path.
Finally, project team members may tend to bloat their duration estimates. Bloating the work to allow for “wiggle room” on assignments can cause durations to swell way beyond the practical completion date of the project. In lieu of bloated estimates, project team members and the project manager should use a percentage of the project time as management reserve. Management reserve is a percentage of the overall project duration estimate, and it is set aside just for schedule slippage. When activities are late, the tardiness of the work is borrowed from management reserve rather than tacked on to the conclusion of the project.
KEY TERMS
To pass the PMP exam, you will need to memorize these terms and their definitions. For maximum value, create your own flashcards based on these definitions and review them daily. The definitions can be found within this chapter and in the glossary.
activity list A listing of all the project activities required to complete each project phase or the entire project.
activity-on-node A network diagramming approach that places the activities on a node in the project network diagram.
activity sequencing The process of mapping the project activities in the order in which the work should be completed.
analogous estimating A duration-estimating technique that bases the current project duration estimate on historical information from similar projects.
crashing A duration-compression technique that adds project resources to the project in an effort to reduce the amount of time allotted for effort-driven activities.
critical path method A network diagramming approach that identifies the minimum project duration. This includes project activities that cannot be delayed or the project completion date will be late.
discretionary dependencies These project activities do not have to be completed in a particular order; instead, these tasks can be completed in the order determined by the project manager or at the project team’s discretion.
fast tracking A duration-compression technique that allows entire phases of a project to overlap other phases.
finish no earlier than (FNET) A project constraint that requires an activity to finish no earlier than a specific date.
finish-to-finish A relationship between project activities whereby the predecessor activities must finish before successor activities may finish.
finish-to-start A relationship between project activities whereby the predecessor activities must finish before the successor activities may start; this is the most common network diagramming relationship type.
fist-to-five voting Team members vote on the accuracy of an activity duration estimate by showing their fists, which represent low confidence, or up to five fingers, which show highest confidence. Votes of three fingers or lower are discussed to gain consensus.
float A generic term that describes the amount of time an activity may be delayed without delaying any subsequent activities’ start dates.
Gantt chart A bar chart against a calendar to show the duration of activities and the sequence of activities in a project.
hard logic The project activities must be completed in a particular order; this is also known as mandatory dependencies.
internal dependencies Dependencies that are internal to the project that are often related to the nature of the work that’s being completed.
Kanban A sign board to show work in progress as requirements move through the predefined stages of a project. Most often used in lean and agile environments.
lag Time added to a project activity to delay its start time; lag time is considered positive time and is sometimes called waiting time.
lead Time added to an activity to allow its start time to begin earlier than scheduled; lead time is negative time, as it moves the activities closer to the project’s start date.
mandatory dependencies Project activities must happen in a particular order due to the nature of the work; also known as hard logic.
milestone chart Shows when milestones are expected to be reached in the project schedule and when the milestones were achieved.
Monte Carlo analysis A “what-if” scenario tool to determine how scenarios may work out, given any number of variables. The process doesn’t create a specific answer, but a range of possible answers. When Monte Carlo is applied to a schedule, it can present, for example, the optimistic completion date, the pessimistic completion date, and the most likely completion date for each activity in the project.
negative total float When a project or task is running late on its implementation, or if there’s a predefined deadline for the project, you may experience negative float. This means the activities on the critical path are allotted enough time to meet the defined late finish date for the project.
network template A network diagram based on previous similar projects that is adapted for the current project work.
parametric estimating Ideal for projects with repetitive work, in which a parameter, such as five hours per unit, is used to estimate the project duration.
Parkinson’s Law Work expands to fill the amount of time allotted to it.
precedence diagramming method The most common method of arranging the project work visually. The PDM puts the activities in boxes, called nodes, and connects the boxes with arrows. The arrows represent the relationship and the dependencies of the work packages.
project calendar A calendar that defines the working times for the project. For example, a project may require the project team to work nights and weekends so as not to disturb the ongoing operations of the organization during working hours. In addition, the project calendar accounts for holidays, working hours, and work shifts the project will cover.
resource calendar Shows when resources, such as project team members, consultants, and SMEs, are available to work on the project. It considers vacations, other commitments within the organization, restrictions on contracted work, overtime issues, and so on.
resource leveling A method to reduce resources overallocated or allocated unevenly, also known as flattening. Resource leveling can be applied in different methods to accomplish different goals. One of the most common methods is to ensure that workers are not overextended on activities.
resource smoothing A technique that enables you to do resource leveling, but only on noncritical path activities. This approach levels resource utilization by taking advantage of activities that have available float. For those activities with no float, the resource utilization will not be edited.
schedule control Schedule control is concerned with three processes: the project manager confirms that any schedule changes are agreed upon, the project manager examines the work results and conditions to know if the schedule has changed, and the project manager manages the actual change in the schedule. The schedule baseline cannot be changed without using the integrated change control process.
schedule management plan A subsidiary plan of the overall project plan, used to develop, manage, and control the schedule. A formal schedule management plan has procedures that control how changes to the project plan can be proposed, accounted for, and then implemented.
schedule variance The difference between the schedule baseline and the performance to schedule.
soft logic The preferred order of activities. Project managers should use these relationships at their discretion and document the logic behind making soft logic decisions. Also known as discretionary dependencies, soft logic allows activities to happen in a preferred order because of best practices, conditions unique to the project work, or external events.
sprint Time-boxed duration, typically two-to-four weeks, of project execution in an agile environment. Sprints are iterations of executing the prioritized list of product backlog requirements.
Start no earlier than (SNET) A project constraint that demands that a project activity start no earlier than a specific date.
start-to-finish A relationship that requires an activity to start so that a successor activity may finish; it is unusual and is rarely used.
start-to-start A relationship structure that requires a task to start before a successor task activity may start. This relationship allows both activities to happen in tandem.
three-point estimate An estimate that uses optimistic, most likely, and pessimistic values to determine the cost or duration of a project component. Also called triangular distribution.
user stories A backlog of prioritized requirements. User stories are prioritized by value with the product owner and project team in an agile environment. User stories are assigned story points to predict the difficulty of creating the requirement. Only so many story points are allowed per iteration.
 TWO-MINUTE DRILL
Creating the Schedule Management Plan
![]() The schedule management plan is part of the overall project management plan. It defines how the project schedule will be created, how you’ll monitor the project’s schedule, and how you’ll protect and control the project schedule.
The schedule management plan is part of the overall project management plan. It defines how the project schedule will be created, how you’ll monitor the project’s schedule, and how you’ll protect and control the project schedule.
![]() The schedule management plan includes the rules for performance measurement. This component of the plan defines how exactly you’ll measure the project on its schedule performance, how you’ll know progress is happening in the project, and how you might use earned value management as part of your project measurement.
The schedule management plan includes the rules for performance measurement. This component of the plan defines how exactly you’ll measure the project on its schedule performance, how you’ll know progress is happening in the project, and how you might use earned value management as part of your project measurement.
![]() The process of creating the schedule management plan uses four inputs: the project management plan, the project charter, enterprise environmental factors, and organizational process assets. Through analysis and meetings, the project manager, the project team, and expert judgment, will create the schedule management plan.
The process of creating the schedule management plan uses four inputs: the project management plan, the project charter, enterprise environmental factors, and organizational process assets. Through analysis and meetings, the project manager, the project team, and expert judgment, will create the schedule management plan.
Defining the Activities
![]() Based on the project management plan, enterprise environmental factors, and organizational process assets, the project manager and the project team will define the activities that are required to be completed to create the project scope.
Based on the project management plan, enterprise environmental factors, and organizational process assets, the project manager and the project team will define the activities that are required to be completed to create the project scope.
![]() Just as the project team decomposes the project scope into work packages, the work packages can be broken down into project activities. Decomposition is a project management tool that breaks down deliverables into activities to execute the project more successfully.
Just as the project team decomposes the project scope into work packages, the work packages can be broken down into project activities. Decomposition is a project management tool that breaks down deliverables into activities to execute the project more successfully.
![]() Rolling wave planning is a project management approach to progressive elaboration. Imminent work is planned in detail, while future work is planned only at a high level. Rolling wave planning is ideal for projects in which the current work may shape future project requirements.
Rolling wave planning is a project management approach to progressive elaboration. Imminent work is planned in detail, while future work is planned only at a high level. Rolling wave planning is ideal for projects in which the current work may shape future project requirements.
Sequencing Activities
![]() Projects are made up of sequential activities to create a product. The WBS and the activity list serve as key inputs to the sequencing of project activities. The science of arranging, calculating, and predicting how long the activities will take to complete allows the project manager to create a schedule and then predict when the project will end.
Projects are made up of sequential activities to create a product. The WBS and the activity list serve as key inputs to the sequencing of project activities. The science of arranging, calculating, and predicting how long the activities will take to complete allows the project manager to create a schedule and then predict when the project will end.
![]() Hard logic is the approach that requires activities to happen in a specific order due to the nature of the work—for example, configuring a computer workstation’s operating systems before adding the software.
Hard logic is the approach that requires activities to happen in a specific order due to the nature of the work—for example, configuring a computer workstation’s operating systems before adding the software.
![]() Soft logic is a “preferred” method of arranging activities based on conditions, guidelines, or best practices—for example, the project manager prefers to have the artwork for the user manual created before the contents of the user manual are written.
Soft logic is a “preferred” method of arranging activities based on conditions, guidelines, or best practices—for example, the project manager prefers to have the artwork for the user manual created before the contents of the user manual are written.
![]() The sequence of activities is displayed in a project schedule network diagram. The network diagram illustrates the flow of activities and the relationship between activities. The precedent diagramming method is the most common approach to arranging activities visually.
The sequence of activities is displayed in a project schedule network diagram. The network diagram illustrates the flow of activities and the relationship between activities. The precedent diagramming method is the most common approach to arranging activities visually.
![]() Free float is the total time a single activity can be delayed without delaying the early start of any subsequent activities.
Free float is the total time a single activity can be delayed without delaying the early start of any subsequent activities.
![]() A schedule constraint on an activity or the project completion date may cause negative float in the project or a task. This means there’s not enough time to complete the activities, based on their duration, to meet the time constraint on the task or project.
A schedule constraint on an activity or the project completion date may cause negative float in the project or a task. This means there’s not enough time to complete the activities, based on their duration, to meet the time constraint on the task or project.
![]() Total float is the total time an activity can be delayed without delaying project completion.
Total float is the total time an activity can be delayed without delaying project completion.
![]() Project float is the total time the project can be delayed without passing the customer-expected completion date.
Project float is the total time the project can be delayed without passing the customer-expected completion date.
Estimating Activity Durations
![]() Activity duration estimates are needed to calculate how long the project will take to complete. Estimates can come from project team members, commercial databases, expert judgment, and historical information.
Activity duration estimates are needed to calculate how long the project will take to complete. Estimates can come from project team members, commercial databases, expert judgment, and historical information.
![]() Analogous estimating relies on historical information to predict how long current project activities should last.
Analogous estimating relies on historical information to predict how long current project activities should last.
![]() Parametric estimates use a mathematical model to calculate how long activities should take based on units, duration, and effort.
Parametric estimates use a mathematical model to calculate how long activities should take based on units, duration, and effort.
Developing the Schedule
![]() The critical path is the longest path to completion in the network diagram. Activities on the critical path typically have no float or slack. Free float is the amount of time an activity can be delayed without affecting the next activity’s scheduled start date. Total float is the amount of time an activity can be delayed without affecting the project end date.
The critical path is the longest path to completion in the network diagram. Activities on the critical path typically have no float or slack. Free float is the amount of time an activity can be delayed without affecting the next activity’s scheduled start date. Total float is the amount of time an activity can be delayed without affecting the project end date.
![]() Duration compression is applied to reduce the length of the project or to account for project delays. Crashing adds resources to project activities and usually increases cost. Fast tracking allows activities to happen in tandem and usually increases risk.
Duration compression is applied to reduce the length of the project or to account for project delays. Crashing adds resources to project activities and usually increases cost. Fast tracking allows activities to happen in tandem and usually increases risk.
![]() The schedule management plan must be consulted when project schedule changes occur, are proposed, or are needed. The schedule control system implements the schedule management plan and is part of integration change management.
The schedule management plan must be consulted when project schedule changes occur, are proposed, or are needed. The schedule control system implements the schedule management plan and is part of integration change management.
![]() The project timeline defines the sequence of project activities, the consideration of available resources, constraints that may affect when the work can be completed, and sets expectations for when the project may be completed.
The project timeline defines the sequence of project activities, the consideration of available resources, constraints that may affect when the work can be completed, and sets expectations for when the project may be completed.
![]() A project network diagram visualizes the sequencing of project activities. The most common method is the critical path method and shows the early start, early finish, late start, and late finish possibilities for each project activity. This critical path method illustrates the ordering of events and the relationship between activities among several possible paths to project completion.
A project network diagram visualizes the sequencing of project activities. The most common method is the critical path method and shows the early start, early finish, late start, and late finish possibilities for each project activity. This critical path method illustrates the ordering of events and the relationship between activities among several possible paths to project completion.
![]() In the critical path method of creating the project network diagram, the critical path is the longest duration of connected activities to reach the project completion. There can be more than one critical path if two or more paths have the same duration. The critical path can also change because of delays, changes to the project scope or schedule, availability of resources, and other constraints.
In the critical path method of creating the project network diagram, the critical path is the longest duration of connected activities to reach the project completion. There can be more than one critical path if two or more paths have the same duration. The critical path can also change because of delays, changes to the project scope or schedule, availability of resources, and other constraints.
![]() Float is the amount of time a task can be delayed without delaying the project’s completion. There are four types of float. Free float is the total time a single activity can be delayed without delaying the early start of any successor activities. Total float is the total time an activity can be delayed without delaying project completion. Project float is the total time the project can be delayed without passing the customer-expected completion date. Negative float, which is based on constraints and deadlines for certain activities, means the activities on the critical path don’t have enough time to meet the defined finish date for the project or the constrained activity.
Float is the amount of time a task can be delayed without delaying the project’s completion. There are four types of float. Free float is the total time a single activity can be delayed without delaying the early start of any successor activities. Total float is the total time an activity can be delayed without delaying project completion. Project float is the total time the project can be delayed without passing the customer-expected completion date. Negative float, which is based on constraints and deadlines for certain activities, means the activities on the critical path don’t have enough time to meet the defined finish date for the project or the constrained activity.
Controlling the Schedule
![]() The project management plan, the project schedule, work performance information, and organizational process assets are all inputs to controlling the project schedule.
The project management plan, the project schedule, work performance information, and organizational process assets are all inputs to controlling the project schedule.
![]() Schedule compression is an approach to bring the project back into alignment with the project baseline. Crashing adds resources to the project work, which usually increases project costs. Fast tracking allows entire phases of the project to overlap, which may increase risks.
Schedule compression is an approach to bring the project back into alignment with the project baseline. Crashing adds resources to the project work, which usually increases project costs. Fast tracking allows entire phases of the project to overlap, which may increase risks.
![]() Updates to the project schedule may cause the schedule baseline, schedule management plan, and the cost baseline to be updated. All changes must flow through the schedule change control system and integrated change control.
Updates to the project schedule may cause the schedule baseline, schedule management plan, and the cost baseline to be updated. All changes must flow through the schedule change control system and integrated change control.
 SELF TEST
1. You are the project manager of the JHG Project. This project has 32 stakeholders and will require implementation activities in North and South America. You have been requested to provide a duration estimate for the project. Of the following, which will offer the best level of detail in your estimate?
A. The resource calendar
B. An order of magnitude
C. A requirements document
D. A stakeholder analysis
2. Michael is the project manager of the 78GH Project. This project requires several members of the project team to complete a certification class for another project the week of November 2. This class causes some of the project activities on Michael’s activities to be delayed from his target schedule. This is an example of which of the following?
A. Hard logic
B. External dependencies
C. Soft logic
D. Conflict of interest
3. You are managing an interior decorating project. The walls are scheduled to be painted immediately after the primer is applied. You have allowed 36 hours between the primer activity and the painting activity to ensure that the primer has cured. This is an example of which one of the following?
A. Lead
B. Lag
C. Soft logic
D. Finish-to-start relationship
4. You are the project manager of the DFK Project and you’re reviewing your project network diagram. You are considering changing the relationship of some of the project activities to reduce the duration of the project work. Consider your project’s network diagram (as shown in the following illustration).

Given the diagram, what is the relationship between tasks F and G?
A. FS
B. SS
C. FF
D. SF
5. You are the project manager for the LLL Project. Steven, a project team member, is confused about network diagrams. Specifically, he wants to know what the critical path is in a network diagram. Your answer is which one of the following?
A. The critical path is the network that hosts the activities most critical to the project’s success.
B. The critical path is a path with the longest duration.
C. The critical path is always one path that cannot be delayed, or the entire project will be delayed.
D. The critical path is the path from start to completion with no deviation from the project plan.
6. You are the project manager of the HQQ Project and you’re working with your customer stakeholder. The stakeholder has asked that you find a method to reduce the overall project duration for her organization. She has promised a bonus to your company of $10,000 per day that you finish ahead of schedule. Which duration compression technique could you utilize on activities that are effort-driven?
A. Crashing
B. Fast tracking
C. Effort-driven activities cannot be compressed
D. Resource smoothing
7. You are creating a schedule duration estimate for the activities in the PDR Project. You’re working with your project team and comparing the results of a past similar project to predict the schedule for the current project. What estimating approach are you using?
A. Organizational process assets
B. Parametric
C. Analogous
D. PERT
8. You are the project manager for your organization, which utilizes an agile approach to project management. The development team is rating the difficulty of completing the requirements in the current sprint. What term describes rating of the requirements to determine how many requirements can be completed in a sprint?
A. Fist-to-five voting
B. Value analysis
C. Sprint backlog
D. Story points
9. You are the project manager for the POL Project. This project will use a three-point estimate to calculate the estimates for activity duration. For Activity D, you have the following information: P = 9 weeks, O = 4 weeks, M = 5 weeks. What is the result of this estimate?
A. 18 weeks
B. 6 weeks
C. 33.33 days
D. 3 weeks
10. You are the project manager for the YKL Project. This project will affect several lines of business at completion. You have elected to schedule each milestone in the project to end so the work does not affect current business cycles. This is an example of which one of the following?
A. Constraint
B. Expert judgment
C. WBS scheduling
D. Soft logic
11. You are the project manager for the MNB Project. You and your project team are about to enter the activity duration estimating process. Which of the following will not be helpful in your meeting?
A. Constraints
B. Assumptions
C. The project charter
D. Identified risks
12. You are the project manager for a new training program at your customer’s site. This program will require each of the customer’s employees to attend a half-day class and complete an assessment exam. You will be completing the training at the customer’s facility and will need a trainer for the duration of the training, which is six months. This is an example of which of the following?
A. Resource requirements
B. Assumption
C. Cost constraint
D. A human resource issue
13. You are the project manager for a construction company. Your firm has been contracted to complete the drilling of a well for a new cabin in Arkansas. The specification of the well is documented, but your company has little experience in well drilling in Arkansas. The stakeholder is concerned that your time estimates are not accurate, since the soil and rock in Arkansas are quite different from the soil in your home state. Which one of the following can you use to ensure your project estimates are accurate?
A. An order of magnitude
B. A commercial duration estimating database
C. Local contractors
D. Soil samplings from the Arkansas government
14. You are the project manager for your organization. You and your project team are in conflict on the amount of time allotted to complete certain activities. Several of the team members want to bloat the time associated with activities to ensure they will have enough time to complete their tasks should something go awry. The law of economics that these tasks may suffer from is which one of the following?
A. Parkinson’s Law
B. The law of diminishing returns
C. Hertzberg’s theory of motivation
D. Oligopoly
15. You are the project manager for your organization. You and your project team are in conflict regarding the amount of time allotted to complete certain activities. Several of the team members want to bloat the time associated with activities to ensure they will have enough time to complete their tasks should some risk events cause the schedule to change. Instead of overestimating their project activities, the project team should use which of the following?
A. Capital reserve
B. Contingency plans
C. Contingency reserve
D. Assumptions of plus or minus a percentage
16. You are the project manager for your organization and part of your role requires that you coach the project team on the project management processes. At this point in your project, you’re estimating the activity durations with the project team and need to review the tools and techniques that are appropriate for use with this process. Which one of the following is not a tool and technique for the estimate activity duration process?
A. Risk identification
B. Analogous estimating
C. Reserve analysis
D. Three-point estimating
17. You are the project manager for the 987 Project. Should this project run over schedule, it will cost your organization $35,000 per day in lost sales. With four months to completion, you realize the project is running late. You decide, with management’s approval, to add more project team members to the plan to complete the work on time. This is an example of which of the following?
A. Crashing
B. Fast tracking
C. Expert judgment
D. Cost-benefit analysis
18. You are the project manager for the 987 Project. Should this project run over schedule, it will cost your organization $35,000 per day in lost sales. With four months to completion, you realize the project is running late. You decide, with management’s approval, to change the relationship between several of the work packages so they begin in tandem rather than sequentially. This is an example of which one of the following?
A. Crashing
B. Fast tracking
C. Expert judgment
D. Cost-benefit analysis
19. Chris, a project manager for his company, is explaining the difference between a Gantt chart and a milestone chart. Which of the following best describes a Gantt chart?
A. A Gantt chart depicts what was planned against what occurred.
B. A Gantt chart compares the work in the project against the work that has been completed.
C. A Gantt chart depicts the work in the project against a calendar.
D. A Gantt chart depicts the work in the project against each resource’s calendar.
20. Beth is a project manager for her organization. Management has asked Beth to use the CPM approach in her network diagram. She is not familiar with this approach and she’s asked you to help her complete this portion of her project work. Which of the following is a correct attribute of the critical path?
A. It determines the earliest completion date.
B. It has the largest amount of float.
C. It has the most activities in the PND.
D. It is the path with the most expensive project activities.
21. You are the project manager for a construction project. Your foreman informs you that, because of the humidity, the concrete will need to cure for an additional 24 hours before the framing can begin. To accommodate the requirement, you add _______________ time to the framing activity.
A. Lead
B. Lag
C. Delay
D. Slack
22. Management has informed you that you must flatten your project through resource leveling. What is likely to happen to your project schedule if your project team members are allowed to contribute only 30 hours per week?
A. The project schedule will increase.
B. The project schedule will decrease.
C. The project critical path will change.
D. The project manager will need to use the critical path method.
23. You are the project manager for a project with the following network diagram. Study the following diagram: Which path is the critical path?

A. ABCD
B. EBCD
C. EFH
D. EGH
24. Bertha is the project manager for the HAR Project. The project is behind schedule, and Bertha has elected, with management’s approval, to crash the critical path. This process adds more what? (Choose the best answer.)
A. Cost
B. Time
C. Risk
D. Documentation
25. Bertha is the project manager for the HAR Project. It’s currently behind schedule, and Bertha has elected, with management’s approval, to fast track the critical path. This process adds more what? (Choose the best answer.)
A. Cost
B. Time
C. Risk
D. Documentation
 SELF TEST ANSWERS
1. You are the project manager of the JHG Project. This project has 32 stakeholders and will require implementation activities in North and South America. You have been requested to provide a duration estimate for the project. Of the following, which will offer the best level of detail in your estimate?
A. The resource calendar
B. An order of magnitude
C. A requirements document
D. A stakeholder analysis
![]() A. The resource calendar is the best choice for this scenario because it is the only activity duration estimating input listed.
A. The resource calendar is the best choice for this scenario because it is the only activity duration estimating input listed.
![]() B, C, and D are incorrect. B is incorrect because the order of magnitude provides little information for accurate estimating. C, while tempting, is incorrect because the requirements document lists the high-level deliverables, while the WBS provides more detail. D is incorrect because stakeholder analysis does not provide enough information to predict accurately when the project will end.
B, C, and D are incorrect. B is incorrect because the order of magnitude provides little information for accurate estimating. C, while tempting, is incorrect because the requirements document lists the high-level deliverables, while the WBS provides more detail. D is incorrect because stakeholder analysis does not provide enough information to predict accurately when the project will end.
2. Michael is the project manager of the 78GH Project. This project requires several members of the project team to complete a certification class for another project the week of November 2. This class causes some of the project activities on Michael’s activities to be delayed from his target schedule. This is an example of which of the following?
A. Hard logic
B. External dependencies
C. Soft logic
D. Conflict of interest
![]() B. Before the work can begin, the certification class external to the work must be completed.
B. Before the work can begin, the certification class external to the work must be completed.
![]() A, C,and Dare incorrect. A is incorrect; hard logic is the mandatory sequencing of events. C is incorrect because there is no preferential (soft) logic. D is incorrect because it does not apply to this scenario.
A, C,and Dare incorrect. A is incorrect; hard logic is the mandatory sequencing of events. C is incorrect because there is no preferential (soft) logic. D is incorrect because it does not apply to this scenario.
3. You are managing an interior decorating project. The walls are scheduled to be painted immediately after the primer is applied. You have allowed 36 hours between the primer activity and the painting activity to ensure that the primer has cured. This is an example of which one of the following?
A. Lead
B. Lag
C. Soft logic
D. Finish-to-start relationship
![]() B. The time between the activities is lag time. The painting activity must wait 36 hours before it can begin.
B. The time between the activities is lag time. The painting activity must wait 36 hours before it can begin.
![]() A, C, and D are incorrect. A, lead time, is when the activities are brought closer together or even overlap. C, soft logic, describes when activities are scheduled based on preferences, guidelines, or external conditions. D is incorrect, because, although this does describe a finish-to-start relationship, lag is a better choice because of the added waiting time.
A, C, and D are incorrect. A, lead time, is when the activities are brought closer together or even overlap. C, soft logic, describes when activities are scheduled based on preferences, guidelines, or external conditions. D is incorrect, because, although this does describe a finish-to-start relationship, lag is a better choice because of the added waiting time.
4. You are the project manager of the DFK Project and you’re reviewing your project network diagram. You are considering changing the relationship of some of the project activities to reduce the duration of the project work. Consider your project’s network diagram (as shown in the following illustration).

A. FS
B. SS
C. FF
D. SF
![]() A. G is slated to start immediately after F, so this is a finish-to-start (FS) relationship. In other words, F must finish so G may start.
A. G is slated to start immediately after F, so this is a finish-to-start (FS) relationship. In other words, F must finish so G may start.
![]() B, C, and D are incorrect. These relationships do not fit the scenario.
B, C, and D are incorrect. These relationships do not fit the scenario.
5. You are the project manager for the LLL Project. Steven, a project team member, is confused about network diagrams. Specifically, he wants to know what the critical path is in a network diagram. Your answer is which one of the following?
A. The critical path is the network that hosts the activities most critical to the project’s success.
B. The critical path is a path with the longest duration.
C. The critical path is always one path that cannot be delayed, or the entire project will be delayed.
D. The critical path is the path from start to completion with no deviation from the project plan.
![]() B. The critical path is always the path with the longest duration; it’s also the minimum amount of time needed to complete the project.
B. The critical path is always the path with the longest duration; it’s also the minimum amount of time needed to complete the project.
![]() A, C, and D are incorrect. A is incorrect because the critical path hosts the activities, not a network. C is a distraction answer and is incorrect because there can be more than one critical path in a network diagram. D is incorrect because it does not adequately describe the critical path.
A, C, and D are incorrect. A is incorrect because the critical path hosts the activities, not a network. C is a distraction answer and is incorrect because there can be more than one critical path in a network diagram. D is incorrect because it does not adequately describe the critical path.
6. You are the project manager of the HQQ Project and you’re working with your customer stakeholder. The stakeholder has asked that you find a method to reduce the overall project duration for her organization. She has promised a bonus to your company of $10,000 per day that you finish ahead of schedule. Which duration compression technique could you utilize on activities that are effort-driven?
A. Crashing
B. Fast tracking
C. Effort-driven activities cannot be compressed
D. Resource smoothing
![]() A. Crashing enables you to add more labor to effort-driven activities. By adding more labor, or effort, you are reducing the duration of the activity.
A. Crashing enables you to add more labor to effort-driven activities. By adding more labor, or effort, you are reducing the duration of the activity.
![]() B, C, and D are incorrect. B is incorrect because fast tracking enables you to overlap phases in your project and isn’t the best choice for the question. C is incorrect because effort-driven activities are ideal activities to be reduced through additional labor. D is incorrect because resource smoothing refers to the leveling of resources on noncritical path activities. This approach doesn’t reduce the duration of activities.
B, C, and D are incorrect. B is incorrect because fast tracking enables you to overlap phases in your project and isn’t the best choice for the question. C is incorrect because effort-driven activities are ideal activities to be reduced through additional labor. D is incorrect because resource smoothing refers to the leveling of resources on noncritical path activities. This approach doesn’t reduce the duration of activities.
7. You are creating a schedule duration estimate for the activities in the PDR Project. You’re working with your project team and comparing the results of a past similar project to predict the schedule for the current project. What estimating approach are you using?
A. Organizational process assets
B. Parametric
C. Analogous
D. PERT
![]() C. This is an example of an analogous estimate. You can remember this estimate approach by identifying the “analogy” between the two similar projects.
C. This is an example of an analogous estimate. You can remember this estimate approach by identifying the “analogy” between the two similar projects.
![]() A, B, and D are incorrect. A is incorrect because, although the previous project data is part of organizational process assets, the assets are not an estimating approach. B is incorrect because parametric estimates use a parameter, such as five hours per unit. D is also incorrect because PERT uses an average of the optimistic, most likely, and pessimistic time estimates for each activity.
A, B, and D are incorrect. A is incorrect because, although the previous project data is part of organizational process assets, the assets are not an estimating approach. B is incorrect because parametric estimates use a parameter, such as five hours per unit. D is also incorrect because PERT uses an average of the optimistic, most likely, and pessimistic time estimates for each activity.
8. You are the project manager for your organization, which utilizes an agile approach to project management. The development team is rating the difficulty of completing the requirements in the current sprint. What term describes rating of the requirements to determine how many requirements can be completed in a sprint?
A. Fist-to-five voting
B. Value analysis
C. Sprint backlog
D. Story points
![]() D. Requirements are written as user stories. Story points score the difficulty of the tasks needed to complete a user story in a sprint.
D. Requirements are written as user stories. Story points score the difficulty of the tasks needed to complete a user story in a sprint.
![]() A, B, and C are incorrect. These terms are not processes that rate requirements to determine how many requirements can be completed in a sprint.
A, B, and C are incorrect. These terms are not processes that rate requirements to determine how many requirements can be completed in a sprint.
9. You are the project manager for the POL Project. This project will use a three-point estimate to calculate the estimates for activity duration. For Activity D, you have the following information: P = 9, O = 4, M = 5. What is the result of this estimate?
A. 18 weeks
B. 6 weeks
C. 33.33 days
D. 3 weeks
![]() B. The formula is (P + M + O)/3. In this instance, the outcome is 6 weeks.
B. The formula is (P + M + O)/3. In this instance, the outcome is 6 weeks.
![]() A, C, and D are incorrect. These calculations are incorrect.
A, C, and D are incorrect. These calculations are incorrect.
10. You are the project manager for the YKL Project. This project will affect several lines of business at completion. You have elected to schedule each milestone in the project to end so the work does not affect current business cycles. This is an example of which one of the following?
A. Constraint
B. Expert judgment
C. WBS scheduling
D. Soft logic
![]() D. Soft logic enables the project manager to make decisions based on conditions outside of the project, best practices, or guidelines.
D. Soft logic enables the project manager to make decisions based on conditions outside of the project, best practices, or guidelines.
![]() A, B, and C are incorrect. A is incorrect because this is not an example of constraints, since the project manager is not required to use soft logic. B and C are incorrect; they do not describe the scenario fully.
A, B, and C are incorrect. A is incorrect because this is not an example of constraints, since the project manager is not required to use soft logic. B and C are incorrect; they do not describe the scenario fully.
11. You are the project manager for the MNB Project. You and your project team are about to enter the activity duration estimating process. Which of the following will not be helpful in your meeting?
A. Constraints
B. Assumptions
C. The project charter
D. Identified risks
![]() C. The project charter is not an input to the activity duration estimating process.
C. The project charter is not an input to the activity duration estimating process.
![]() A, B, and D are incorrect. These are inputs to activity duration estimating.
A, B, and D are incorrect. These are inputs to activity duration estimating.
12. You are the project manager for a new training program at your customer’s site. This program will require each of the customer’s employees to attend a half-day class and complete an assessment exam. You will be completing the training at the customer’s facility and will need a trainer for the duration of the training, which is six months. This is an example of which of the following?
A. Resource requirements
B. Assumption
C. Cost constraint
D. A human resource issue
![]() A. The trainer resource is required for the project for six months.
A. The trainer resource is required for the project for six months.
![]() B, C, and D are incorrect. They do not describe the resource requirement of the trainer on the project.
B, C, and D are incorrect. They do not describe the resource requirement of the trainer on the project.
13. You are the project manager for a construction company. Your firm has been contracted to complete the drilling of a well for a new cabin in Arkansas. The specification of the well is documented, but your company has little experience in well drilling in Arkansas. The stakeholder is concerned that your time estimates are not accurate, since the soil and rock in Arkansas are quite different from the soil in your home state. Which one of the following can you use to ensure your project estimates are accurate?
A. An order of magnitude
B. A commercial duration estimating database
C. Local contractors
D. Soil samplings from the Arkansas government
![]() B. Commercial duration-estimating databases are valid resources to confirm or base time estimates on.
B. Commercial duration-estimating databases are valid resources to confirm or base time estimates on.
![]() A, C, and D are incorrect. A is incorrect because an order of magnitude offers very little detail on time estimates. C is incorrect because local contractors are not the best source for confirming time estimates; the question does not define whether the contractors are local to Arkansas or to your home state. D is incorrect because commercial duration estimating databases are much more reliable in this scenario.
A, C, and D are incorrect. A is incorrect because an order of magnitude offers very little detail on time estimates. C is incorrect because local contractors are not the best source for confirming time estimates; the question does not define whether the contractors are local to Arkansas or to your home state. D is incorrect because commercial duration estimating databases are much more reliable in this scenario.
14. You are the project manager for your organization. You and your project team are in conflict on the amount of time allotted to complete certain activities. Several of the team members want to bloat the time associated with activities to ensure they will have enough time to complete their tasks should something go awry. The law of economics that these tasks may suffer from is which one of the following?
A. Parkinson’s Law
B. The law of diminishing returns
C. Hertzberg’s theory of motivation
D. Oligopoly
![]() A. Parkinson’s Law states that work will expand to fulfill the time allotted to it. Bloated tasks will take all the time allotted. Management reserve should be used instead.
A. Parkinson’s Law states that work will expand to fulfill the time allotted to it. Bloated tasks will take all the time allotted. Management reserve should be used instead.
![]() B, C, and D are incorrect. B is incorrect because this describes the relationship between effort, duration, and the maximum yield. C is incorrect because Hertzberg’s theory of motivation describes personalities and worker motivation. D is incorrect because an oligopoly is a procurement issue in which there are few vendors available to choose from. Plus, the vendors may seemingly have checks and balances with each other.
B, C, and D are incorrect. B is incorrect because this describes the relationship between effort, duration, and the maximum yield. C is incorrect because Hertzberg’s theory of motivation describes personalities and worker motivation. D is incorrect because an oligopoly is a procurement issue in which there are few vendors available to choose from. Plus, the vendors may seemingly have checks and balances with each other.
15. You are the project manager for your organization. You and your project team are in conflict regarding the amount of time allotted to complete certain activities. Several of the team members want to bloat the time associated with activities to ensure they will have enough time to complete their tasks should some risk events cause the schedule to change. Instead of overestimating their project activities, the project team should use which of the following?
A. Capital reserve
B. Contingency plans
C. Contingency reserve
D. Assumptions of plus or minus a percentage
![]() C. Rather than bloat activities, projects should use a contingency reserve. A contingency reserve is a portion of the project schedule allotted for time overruns on activities.
C. Rather than bloat activities, projects should use a contingency reserve. A contingency reserve is a portion of the project schedule allotted for time overruns on activities.
![]() A, B, and D are incorrect. A is incorrect because it does not describe the scenario. B is incorrect because contingency plans are a response to risk situations. D is incorrect because it describes a range of variance.
A, B, and D are incorrect. A is incorrect because it does not describe the scenario. B is incorrect because contingency plans are a response to risk situations. D is incorrect because it describes a range of variance.
16. You are the project manager for your organization and part of your role requires that you coach the project team on the project management processes. At this point in your project, you’re estimating the activity durations with the project team and need to review the tools and techniques that are appropriate for use with this process. Which one of the following is not a tool and technique for the estimate activity duration process?
A. Risk identification
B. Analogous estimating
C. Reserve analysis
D. Three-point estimating
![]() A. Risk identification is not a tool and technique of the estimate activity durations process.
A. Risk identification is not a tool and technique of the estimate activity durations process.
![]() B, C, and D are incorrect. These are tools and techniques of activity duration estimating. This process has six tools to consider: expert judgment, analogous estimating, parametric estimating, three-point estimating, Delphi technique, and reserve analysis.
B, C, and D are incorrect. These are tools and techniques of activity duration estimating. This process has six tools to consider: expert judgment, analogous estimating, parametric estimating, three-point estimating, Delphi technique, and reserve analysis.
17. You are the project manager for the 987 Project. Should this project run over schedule, it will cost your organization $35,000 per day in lost sales. With four months to completion, you realize the project is running late. You decide, with management’s approval, to add more project team members to the plan to complete the work on time. This is an example of which of the following?
A. Crashing
B. Fast tracking
C. Expert judgment
D. Cost-benefit analysis
![]() A. When more resources are added to a project to complete the work on time, it is called crashing.
A. When more resources are added to a project to complete the work on time, it is called crashing.
![]() B, C, and D are incorrect. B is incorrect because fast tracking is the process of changing the relationship between activities to allow tasks to overlap. C is incorrect because expert judgment is not used in this scenario. D is incorrect; cost-benefit analysis may be part of the process to decide the value of adding more workers to the schedule, but it is not the process described.
B, C, and D are incorrect. B is incorrect because fast tracking is the process of changing the relationship between activities to allow tasks to overlap. C is incorrect because expert judgment is not used in this scenario. D is incorrect; cost-benefit analysis may be part of the process to decide the value of adding more workers to the schedule, but it is not the process described.
18. You are the project manager for the 987 Project. Should this project run over schedule, it will cost your organization $35,000 per day in lost sales. With four months to completion, you realize the project is running late. You decide, with management’s approval, to change the relationship between several of the work packages so they begin in tandem rather than sequentially. This is an example of which one of the following?
A. Crashing
B. Fast tracking
C. Expert judgment
D. Cost-benefit analysis
![]() B. Fast tracking allows activities to operate in tandem with each other rather than sequentially.
B. Fast tracking allows activities to operate in tandem with each other rather than sequentially.
![]() A, C, and D are incorrect. A is incorrect; when more resources are added to a project to complete the work on time, it is called crashing. C is incorrect because expert judgment is not used in this scenario. D is incorrect; cost-benefit analysis may be part of the process to decide the value of fast tracking the schedule, but it is not the process described.
A, C, and D are incorrect. A is incorrect; when more resources are added to a project to complete the work on time, it is called crashing. C is incorrect because expert judgment is not used in this scenario. D is incorrect; cost-benefit analysis may be part of the process to decide the value of fast tracking the schedule, but it is not the process described.
19. Chris, a project manager for his company, is explaining the difference between a Gantt chart and a milestone chart. Which of the following best describes a Gantt chart?
A. A Gantt chart depicts what was planned against what occurred.
B. A Gantt chart compares the work in the project against the work that has been completed.
C. A Gantt chart depicts the work in the project against a calendar.
D. A Gantt chart depicts the work in the project against each resource’s calendar.
![]() C. A Gantt chart is a bar chart that represents the duration of activities against a calendar. The length of the bars represents the length of activities, while the order of the bars represents the order of activities in the project.
C. A Gantt chart is a bar chart that represents the duration of activities against a calendar. The length of the bars represents the length of activities, while the order of the bars represents the order of activities in the project.
![]() A, B, and D are incorrect. A and B are incorrect because they describe a tracking Gantt. D is incorrect because this does not describe a Gantt chart.
A, B, and D are incorrect. A and B are incorrect because they describe a tracking Gantt. D is incorrect because this does not describe a Gantt chart.
20. Beth is a project manager for her organization. Management has asked Beth to use the CPM approach in her network diagram. She is not familiar with this approach and she’s asked you to help her complete this portion of her project work. Which of the following is a correct attribute of the critical path?
A. It determines the earliest completion date.
B. It has the largest amount of float.
C. It has the most activities in the PND.
D. It is the path with the most expensive project activities.
![]() A. Of all the choices presented, A is the best description of the critical path. The critical path is the path with the longest duration and it tells the earliest and the latest day the project can be completed. There can be instances, however, when the project’s expected end date is well beyond the duration of the scheduled work. In such cases, the critical path is considered the path with the least amount of float.
A. Of all the choices presented, A is the best description of the critical path. The critical path is the path with the longest duration and it tells the earliest and the latest day the project can be completed. There can be instances, however, when the project’s expected end date is well beyond the duration of the scheduled work. In such cases, the critical path is considered the path with the least amount of float.
![]() B, C, and D are incorrect. These are false descriptions of the critical path. The critical path has the smallest amount of float, is the longest duration, and does not necessarily have the most expensive activities.
B, C, and D are incorrect. These are false descriptions of the critical path. The critical path has the smallest amount of float, is the longest duration, and does not necessarily have the most expensive activities.
21. You are the project manager for a construction project. Your foreman informs you that, because of the humidity, the concrete will need to cure for an additional 24 hours before the framing can begin. To accommodate the requirement, you add _______________ time to the framing activity.
A. Lead
B. Lag
C. Delay
D. Slack
![]() B. You will add lag time to the framing activity. Lag is waiting time.
B. You will add lag time to the framing activity. Lag is waiting time.
![]() A, C, and D are incorrect. A is incorrect; lead time allows activities to overlap. C is not the correct choice, because a delay isn’t the correct nomenclature for the scenario. Lag time is what’s added to the schedule, not a delay. D is also incorrect because slack is the amount of time a task can be delayed without delaying the scheduled start date of dependent activities.
A, C, and D are incorrect. A is incorrect; lead time allows activities to overlap. C is not the correct choice, because a delay isn’t the correct nomenclature for the scenario. Lag time is what’s added to the schedule, not a delay. D is also incorrect because slack is the amount of time a task can be delayed without delaying the scheduled start date of dependent activities.
22. Management has informed you that you must flatten your project through resource leveling. What is likely to happen to your project schedule if your project team members are allowed to contribute only 30 hours per week?
A. The project schedule will increase.
B. The project schedule will decrease.
C. The project critical path will change.
D. The project manager will need to use the critical chain method.
![]() A. When the project schedule is flattened through resource leveling, the project duration (schedule) will likely increase.
A. When the project schedule is flattened through resource leveling, the project duration (schedule) will likely increase.
![]() B, C, and D are incorrect. The project schedule will not decrease, and there’s no evidence that the critical path will change. The project manager can use the critical chain method or not, and it will likely not affect the project duration.
B, C, and D are incorrect. The project schedule will not decrease, and there’s no evidence that the critical path will change. The project manager can use the critical chain method or not, and it will likely not affect the project duration.
23. You are the project manager for a project with the following network diagram. Study the diagram: Which path is the critical path?

A. ABCD
B. EBCD
C. EFH
D. EGH
![]() B is the critical path because EBCD is the longest path to completion at 18 days.
B is the critical path because EBCD is the longest path to completion at 18 days.
![]() A, C, and D are incorrect. These paths have float.
A, C, and D are incorrect. These paths have float.
24. Bertha is the project manager for the HAR Project. The project is behind schedule, and Bertha has elected, with management’s approval, to crash the critical path. This process adds more what? (Choose the best answer.)
A. Cost
B. Time
C. Risk
D. Documentation
![]() A. Crashing involves adding resources, which typically increases cost.
A. Crashing involves adding resources, which typically increases cost.
![]() B, C, and D are incorrect. B is incorrect because crashing is an effort to reduce time, not add it. C may be correct, but it is not the best answer. D is incorrect because crashing doesn’t necessarily add more documentation. Crashing adds resources, which will add costs to the project.
B, C, and D are incorrect. B is incorrect because crashing is an effort to reduce time, not add it. C may be correct, but it is not the best answer. D is incorrect because crashing doesn’t necessarily add more documentation. Crashing adds resources, which will add costs to the project.
25. Bertha is the project manager for the HAR Project. It’s currently behind schedule, and Bertha has elected, with management’s approval, to fast track the critical path. This process adds more what? (Choose the best answer.)
A. Cost
B. Time
C. Risk
D. Documentation
![]() C. Fast tracking adds risk because tasks can overlap.
C. Fast tracking adds risk because tasks can overlap.
![]() A, B, and D are incorrect. A may be correct in some instances, but it is not the best choice here. B is incorrect because Bertha wants to remove time, not add it. D is also incorrect, because fast tracking doesn’t necessarily add documentation to the project. Fast tracking allows phases and activities to overlap and this increases risk for the project.
A, B, and D are incorrect. A may be correct in some instances, but it is not the best choice here. B is incorrect because Bertha wants to remove time, not add it. D is also incorrect, because fast tracking doesn’t necessarily add documentation to the project. Fast tracking allows phases and activities to overlap and this increases risk for the project.