
C H A P T E R 7
Know Your Code
The name of this chapter is “Know Your Code.” You might think that if you wrote a piece of code, you know it well. You probably do. You know it at least as well as anyone else. Even if you've written the code, however, you will still make assumptions based from your memory. These assumptions will likely move further and further from reality as time goes on. You have a best guess—an educated assumption—but that is subjective and dependent on human frailty. And if you didn't write the code, all bets are off.
Why guess when you can know? I first heard that question in a performance context. I think it was Cary Milsap (author and performance guru) who said it (at least the first time I heard it). I'll talk more about knowing your code from a performance perspective later but the concept holds true for so much more than just performance.
If you are making a big purchase and need to write a check, are you just going to hope (and assume) you have enough money in your account? What if it is within a few hundred dollars of what you think is in your account? Would you use an ATM or a web page to verify first? My bank even allows me to send an SMS message and get my balance. Why would I guess when I can know?
Oracle gives you ATM access to your code. Everything you could possibly need to know about your PL/SQL code can be found within the Oracle data dictionary and/or by using tools provided by Oracle. You don't even need a PIN code (although you'll need to log into the database and perhaps get a few permissions).
This chapter will show you where to find the best place for an account update. Instead of SMS, you'll send some SQL. The chapter starts with a static analysis of your code using the Oracle data dictionary (as it relates to your PL/SQL code) and PL/Scope. It will then move on to time-based and event-based profiling (pre-11g) and finally context-sensitive, time-based profiling (11g+).
By the end of this chapter, you will be able to take a piece of code you have never seen before and know what the code looks like, the data types used, what variables are using them, and where they are using them. You will know where runtime is spent (efficiently or not) within the application. By the end of this chapter, you will have the tools to know your code. No guesses; you will know the code.
What This Chapter Will (and Will Not) Cover
From an architect's perspective (by that I mean from the viewpoint of correctness of design, correctness of code, and compliance to standards), by the time an application or program unit hits production, there should be absolutely no surprises. All designs should have been peer reviewed—early—for compliance to business requirements and design standards. All code should have been reviewed for compliance to coding standards, performance standards, logic errors, and basic documentation. The better code complies with standards and the better tested an application is, the less likely you are to find “oopsy” type errors. You may find logic errors regardless of how well an application complies with standards. Testing should catch most of these but a few usually still get through. But what does get through should not be a common error. Those common errors are exactly what standards and regression testing are designed to catch.
This chapter will provide you with the tools to help make the best decisions possible by using the valuable data provided by Oracle in the form of the data dictionary, profiling, and the PL/SQL compiler. Much of the validation can be automated and this chapter will show where this is possible. Anything that can be offloaded to a computer should be. Let the humans concentrate on the things that require humans. Even if the full analysis/discovery can't be automated, at least the gathering of the data can be automated or simplified.
Some things are not so automation friendly. Even today, it still requires a human to validate much of a review. If I could develop an automated tool to catch every possible logic error in any possible application, I would have something very valuable to sell and would be raking in large amounts of money. Logic reviews are still in the domain of a human performing a manual check, either through reviewing code or through testing.
Documentation is also difficult. It's easy to see that there are comments in the code, but it's difficult to verify that a given comment is useful (or even relevant). Logic and commenting are highly specific to the task at hand. This chapter will not try to cover logic or documentation issues as there is very little that Oracle can provide to help in that area.
Understanding your application's performance profile is critical to the success of the application. The downside to this, though, is that performance checks require human intelligence to validate. While you can automate a system to raise an alert if a function takes longer than x seconds to complete, a human will need to validate if this is or is not acceptable.
Oracle provides tools to help gather the information required to analyze a system in a way that allows a developer to make intelligent performance decisions. Tuning an application is far beyond the scope of this chapter. However, Chapter 13 provide the means to interpret performance profiling results.
Instead of tuning recommendations, what this chapter will provide, from the perspective of knowing your code as it relates to performance, is what tools are available to gather these performance metrics (primarily a profiler), where the data is stored, and how to use that data for regression. A regression test is the easiest way to validate that what worked before a change is still working after a change. By saving the data provided by Oracle, you can keep an eye on performance over time and compare one release to the next. You can program thresholds into your tests so that automated runs of the profiler will alert someone only on exception. A human must make sure the performance results are correct on the first run, but once a good metric has been gathered, a human only needs to intervene should a metric fall outside a threshold.
Another testing benefit, beyond regression, is code coverage. While not infallible, code coverage testing does provide some assurance that at least the code will execute for some data set. Using a combination of Oracle-provided tools and a little sweat, it is possible to validate that every executable line in a program has been executed. As valuable as that is, even more valuable is the ability to see what lines have not been executed. This is where you want to automate as much as possible. If every line is executed, test passed. If every line is not executed, test failed. A human intervenes and creates a test, or tests, that do cover every line.
The bulk of this chapter will use data provided by the data dictionary and the PL/SQL compiler to ensure compliance to corporate standards. Standards are anything but standard, so a one-size-fits-all solution is impossible. Instead, this chapter will provide the tools and guidance for you to create your own solution in whatever detail you require. Using plain SQL and the data dictionary, you can validate naming standards, find unused variables, find variables defined at multiple scopes, perform impact analysis, find unacceptable data type usage, and more.
I will not explain every option, column, or report provided by, or for, these tools. If the documentation from Oracle is good, and it usually is, I will not regurgitate it. This chapter is not a general tutorial on using these tools. It is an explanation of how you can incorporate these tools into your development workflow to implement better applications.
Automated Code Analysis
Code analysis, also known as program analysis, is the analysis of source code. Manual code analysis is code review by a human. Such analysis may also include reviewing log data and system output from running programs. Automated analysis allows an analyst (usually a developer, in my experience) to skip the boring parts of analysis and jump to the more interesting things. Instead of eyeballing everything, you get to run some kind of a program to do the tedious work for you.
Let's take an example. You're a developer and you're at work. You're handed some new requirements that mean you must change an existing procedure. Maybe a calculation has changed and the procedure will need to add a variable. The business wants an estimate of the time it will take to make the change. To make it really interesting, the person who wrote this procedure and has maintained it for years recently won the lottery and quit. You've never even seen the code (you were out sick on the day of the code review).
How do you provide the estimate? Reach up high (or in deep) and pull a number out of the air (or somewhere else)? I have seen that method used quite a bit and it's never really been all that successful in my experience.
The next method I've seen is to scramble, pull out the source code, and make an emergency review of it. After a quick perusal, you decide that it's a simple change and you only need two hours to code and unit test it.
Nice. A quick analysis and you're ready to start coding. One of the business people is amazed that you can change the call in all 673 places where this calculation is called (it is a very popular calculation). Now you get a bit worried. You do a quick grep in the file system to see all the places from where the procedure is called.
Realizing your procedure is called from so many places, you multiply your original estimate by two. That's usually a bit more accurate than not multiplying, but there is a better way. Would you believe me if I said you can find everywhere it is called by running a few simple queries? Not only can you find where the function is being called but these queries can also cover impact analysis and naming standards compliance as well as show code and variable usage, scope collisions, and code coverage for testing.
You can get all of this information by manually reviewing source code, program log data, etc., but by automating the process, you get a repeatable, predictable process that is less error-prone and vastly less time consuming. You can't replace a good developer when it comes to interpreting the data provided by automated or manual analysis, but automation saves you a lot of time.
Static Analysis
Static analysis is analyzing the source code of a program without actually running it. You are looking at things the compiler knows at compile time. Static analysis provides information about the program based on the functionality actually utilized within the program.
Static analysis can give information about the data types being used, about naming standards, about security, about objects accessed, etc. Static analysis may utilize the source code directly or may use tools. If you manually review code for compliance to naming standards, you are performing a manual static analysis of that source code. Peer reviews are a kind of static analysis. If you have ever found a SQL injection flaw in a co-worker's program while reviewing it, you understand the importance of static analysis.
In Oracle PL/SQL, there are a variety of places where you can get information for your analysis. You will generally start with the data dictionary. With each release, Oracle enhances the data dictionary with valuable data. Later, in the “Performing Static Analysis” section, I will walk you through some important data dictionary views (as well as some analysis queries) before introducing you to a new data dictionary view that brings code analysis into the 21st century. The new view is provided by PL/Scope, an 11g compiler addition.
Dynamic Analysis
Dynamic analysis tells you what you will find out when you run the program. Dynamic analysis is also called program profiling. With profiling, you run a program and either intrusively or non-intrusively gather statistics of where the program has been and what it has done.
DBMS_PROFILER and DBMS_TRACE were the pre-11g profiling tools. DBMS_PROFILER is a flat profiler. A flat profiler provides simple timing information such as how long different procedure and function calls take without any contextual information such as which function was called and in what order. Oracle added call context to the mix with DBMS_TRACE, but ended up creating a tool that was intrusive (required DEBUG) and noisy (optionally producing a lot of data). It's much better to use DBMS_PROFILER.
DBMS_HPROF is an 11g+, hierarchical profiling tool that is non-intrusive and simple to use. DBMS_HPROF provides timing information, like the flat profiler DBMS_PROFILER, but it also includes contextual information like DBMS_TRACE. It can deliver some reports that are very valuable for performance tuning but it also populates some tables that you can then write queries against. This is very beneficial for comparing metrics over time and as an additional tool for understanding your code.
When to Analyze?
The whole purpose of analyzing your code is to understand your code. The vast majority of people who use these analysis tools (at least those who have asked me how to use these tools) are doing so at crunch time: an upgrade gone bad, users screaming about a slow database, a nasty logic bug that seems to be hiding.
Like performance tuning, code analysis can be called upon when things go bad. But wouldn't you agree that a system designed for performance is less likely to wake you up in the middle of the night? The same is true for a well analyzed, standards compliant system: both static (human or automated) and dynamic. Both types of analysis should be baselined.
Analysis should be performed when an application is written (or when you take ownership of it). I have no doubt that everyone is familiar with a code review. As mentioned, a code review (or peer review) is a human-powered type of static analysis. The automated analysis provided by Oracle (especially PL/Scope) should be considered an extension to the code review.
This pre-production analysis/review should be documented, version controlled, and retained. The automated analysis, being data in a dictionary view, is very easily archived and can be recalled whenever needed (although you need to build that functionality yourself). With each and every change, a new version of your analysis will need to be gathered and saved. In addition to saving the analysis, you have to look at it. You really should study it.
With static analysis (as discussed with the data dictionary and PL/SCOPE) you will understand the dependencies of your code, the identifiers used by your code, and where/how those identifiers are used. With dynamic analysis, you can see the bottlenecks in your code (fixable or not); you can see how varying input data changes the execution profile of your code; you can validate code coverage; etc.
Using reports provided by the various tools (or written in SQL yourself), you will have an excellent start for debugging any issues that should pop up in the middle of the night. You will also have documentation to share with new developers (or to convince management you are actually doing some work).
Once your code is in production, you will be able to use the old information you've collected and verify that everything is still performing to expectations. While you're developing, you will use the profiler to continually verify that your code is working correctly, both from a code path perspective as well as a performance perspective. There's no need to save every profiler run to a version control system, but you should save a version that was run before every implementation or upgrade.
CODE ANALYSIS VS. INSTRUMENTATION
Performing Static Analysis
You can perform static analysis using two resources. First, you have the data dictionary at your disposal. Every database, no matter the version, implements a data dictionary, and the information you can derive from this dictionary can be incredibly helpful in analyzing your code. The dictionary is your first line of offense, and it is always available.
If you're running Oracle Database 11g or higher, you also have available a feature called PL/Scope. It gives you visibility into compile-time data that otherwise is not available from the data dictionary. I'll discuss both resources—the dictionary and PL/Scope—in the following two subsections.
The Data Dictionary
Since you're reading this book, I will assume that you are at least somewhat familiar with Oracle's data dictionary. If not, you are probably reading this chapter a bit early in your career. I'm not going to explain what the data dictionary is; there are plenty of other books that cover that topic.
I am, however, going to discuss the views that are pertinent to understanding your code. I'm not getting into a discussion about DBA_*, ALL_* and USER_*. I am going to use USER_* for this discussion but you can assume, that the ALL and DBA counterparts exist. In the same vein, I am not going to do a bunch of describes on these views. I'll stick to covering the columns pertinent to this particular discussion.
![]() Note I am providing examples that use partial strings and string formats. In a real life, implementation of the concepts shown in these examples, the select criteria and things in the where clause, the format strings and such, would exist in a table rather than being hardcoded. For brevity, I am hardcoding such values into the examples. Also, in a real implementation you may use regular expressions to narrow down query results. However, I stick with regular PL/SQL functions as most readers will be familiar with them.
Note I am providing examples that use partial strings and string formats. In a real life, implementation of the concepts shown in these examples, the select criteria and things in the where clause, the format strings and such, would exist in a table rather than being hardcoded. For brevity, I am hardcoding such values into the examples. Also, in a real implementation you may use regular expressions to narrow down query results. However, I stick with regular PL/SQL functions as most readers will be familiar with them.
If you've compiled the example code provided for this chapter (available from the book's catalog page at apress.com), you will have the basic set of programs that I will show as the results of the examples. It will make it much easier to follow along with the text if you have that code. It might make it more interesting, though, if you run it against your own schemas and see what kind of results you get.
USER_SOURCE
Around since PL/SQL was just a carving in stone, the USER_SOURCE view is very simply a line-by-line listing of your code. If you want to browse or export your code (kind of like that manual eyeballing), USER_SOURCE is the view for you. I have used this data for reversing engineering a piece of code (DBMS_METADATA is a better way now) and I frequently use it for a quick analysis of where an object is used. It is, very simply, a line-by-line copy of the course code.
The following is an example of using USER_SOURCE to extract lines of code that contain specific content, in this case “jobs_api.validate_job”:
SELECT name, line

  FROM user_source

  WHERE lower(text) like '%jobs_api.validate_job%';


NAME                           LINE

------------------------------ ----------------------

EMPLOYEE_API                   40

TEST_CALLS_FNC                 5

TEST_CALLS_PRC                 4

TEST_CALLS_PRC                 8
This query was once the basic method of code analysis in the database. It still works for a fast lookup against the database but if you look at the use case of a query like this, you'll see that you can get even better information by using other views.
The query in the example is an attempt to find all programs that invoke the JOBS_API.VAIDATE_JOB program unit. Unfortunately, the query will also return all calls that include “jobs_api.validate_job” in a comment. The primary problem with USER_SOURCE is that it is just a listing. I would need to parse the code to throw away comments (which can be hidden within /* */ when you look at the code line by line), and I would need to parse and separate the various type of variables, executable statements, and more to get any real intelligence from the results. I personally don't want to maintain my own PL/SQL parser.
USER_DEPENDENCIES
USER_DEPENDENCIES is a better approach when you want to see who is calling whom. Unfortunately, the view is not at a very granular level and does not allow for dynamic dependencies such as DBMS_SQL or native dynamic SQL. An analyst would have to have specific knowledge of the code or review the code manually. The following query and results show where the JOBS_API package is being reference by the code in the current schema:
SELECT name, type

FROM user_dependencies

WHERE referenced_name = 'JOBS_API';


NAME                           TYPE

------------------------------ ------------------

TEST_CALLS_PRC                 PROCEDURE

TEST_CALLS_FNC                 FUNCTION

JOBS_API                       PACKAGE BODY

EMPLOYEE_API                   PACKAGE BODY
With these results, you see exactly which program units are really calling the JOBS_API, but the view only provides it at the package level. You have no idea which procedure within the package is making the call nor do you know how many times the program unit is being called.
![]() Note Oracle is adding fine-grained dependencies and may, in the future, make a view available to give us the missing granular level details that we would like.
Note Oracle is adding fine-grained dependencies and may, in the future, make a view available to give us the missing granular level details that we would like.
The rest of the views that I discuss have been created using the source that is stored in the USER_SOURCE view (by the compiler at compile time). To see the actual code, which is required frequently when analyzing the code, you can join back to this view.
USER_PROCEDURES
For many purposes, a view that is better than USER_SOURCE for getting to know a piece of code is the USER_PROCEDURES view. This view will give you compilation details about your code, such as what type of program it is (function, procedure, package, etc.), and if it is an aggregate, deterministic, etc. Arguably the most important feature related to code analysis is that you can combine USER_PROCEDURES with the dictionary view USER_ARGUMENTS discussed in the next section to get detailed information about the parameters used by a program.
The USER_PROCEDURES view is hierarchical so that not only can you identify all of your programs, you can identify which procedures and functions exist within a package. You can also see object types that implement methods in this view (more on objects and methods later).
USER_PROCEDURES, like USER_ARGUMENTS, contains information related to any code objects in the database. That means you can find information related to packages, procedures, functions, triggers, and types. I refer to these code objects generically as programs and program units. The same is true of the additional data dictionary views that I cover later.
USER_PROCEDURES can be a little confusing at first. The OBJECT_NAME column identifies the object. PROCEDURE_NAME is null unless you are looking at an object that exists within the namespace of another object (PACKAGE or TYPE). For example, when you select data from USER_PROCEDURES, PROCEDURE_NAME will be null for a standalone procedure or function while OBJECT_NAME will be the name of the procedure or function. For a package or a type, PROCEDURE NAME will be null (for the package or type object) and OBJECT_NAME will be the name of the package or type. However, each package or type will have another entry in the view for each function, procedure, or method. In this case, the OBJECT_NAME will be the name of the package and the PROCEDURE_NAME will be the name of the procedure or function (method for an object type).
The following query shows that the PROCEDURE_NAME column is null even though the object is a procedure. This is due to the fact that procedure name is only populated for objects containing multiple program units (such as packages and types).
select object_name, procedure_name, object_type

  from user_procedures

  where object_name = 'SECURE_DML';


OBJECT_NAME     PROCEDURE_NAME    OBJECT_TYPE

--------------- ----------------- -------------------

SECURE_DML                        PROCEDURE
On the other hand, the next query shows that if an object is a package or type, OBJECT_NAME is the name of the package and PROCEDURE_NAME will have the name of the packaged procedure or function:
select object_name, procedure_name, object_type

  from user_procedures

  where object_name = 'DEPARTMENTS_API';


OBJECT_NAME      PROCEDURE_NAME          OBJECT_TYPE

---------------- ----------------------- -------------------

DEPARTMENTS_API  DEPARTMENT_EXISTS       PACKAGE

DEPARTMENTS_API  DEPARTMENT_MANAGER_ID   PACKAGE

DEPARTMENTS_API  DEPARTMENT_MANAGER_ID   PACKAGE

DEPARTMENTS_API                          PACKAGE
If an object is an implementation of a user defined aggregate or a pipelined function, the IMPLTYPEOWNER and IMPLTYPENAME will be of the base type below the aggregate. The next query shows that the built-in aggregate function SYS_NT_COLLECT is an example of a function that is an implementation of a type while the built-in DM_CL_BUILD is a pipelined function that implements a type.
select object_type, aggregate, pipelined, impltypeowner, impltypename

  from all_procedures

  where owner = 'SYS'

    and (object_name = 'SYS_NT_COLLECT'

        or

        object_name = 'DM_CL_BUILD'),


OBJECT_TYPE  AGGREGATE PIPELINED IMPLTYPEOWNER   IMPLTYPENAME

------------ --------- --------- --------------- ------------------------------

FUNCTION     YES       NO        SYS             SYS_NT_COLLECT_IMP

FUNCTION     NO        YES       SYS             DMCLBIMP
Each object in this view has an OBJECT_ID and a SUBPROGRAM_ID. OBJECT_ID can be considered the primary key of this view (of the object in the dictionary, actually). When joining to other dictionary objects (as I will do later with USER_ARGUMENTS, OBJECT_ID is the unique ID I will use to join). If the code is standalone, such as a procedure or function, SUBPROGRAM_ID is always a 1. If the code is a package, the subprogram_id will be 0, and each procedure and function in the package will increment the subprogram_id by 1.
One feature that can be incredibly useful in understanding a piece of code is the OVERLOAD column. If a procedure or function is overloaded within a package, OVERLOAD will start with 1 and will increment by 1 for each iteration of the overloaded subprogram. The SUBPROGRAM_ID always increments so an overloaded procedure will have a different SUBPROGRAM_ID from an overloaded version of the procedure.
When combined with the USER_ARGUMENTS view, you can query exactly how overloaded procedures differ. I will provide an example of this in the next section. By itself, the USER_PROCEDURES view can be used for naming standards and to check compilation information that might interest you, such as PIPELINED, AUTHID, or DETERMINISTIC.
USER_ARGUMENTS
When you add USER_ARGUMENTS into the mix, you can start finding some fine-grained details about the code and the arguments to that code. Querying this data can be confusing when you first start using it. The object naming is distinctly different from the USER_PROCEDURES view.
In this view, the OBJECT_NAME is the name of the program that owns the arguments. Whether the program is standalone or inside of a package or type, the procedure or function name will be in the OBJECT_NAME field. If the PROCEDURE or FUNCTION is in a package, PACKAGE_NAME will have a value—it will be NULL otherwise. The ARGUMENT_NAME is the actual name of the argument.
Note that in USER_PROCEDURES, the object_name is the top-level object. In the case of a package, it will be the package or type name. For standalone code, it will be the procedure name, trigger name, or function name. In USER_ARGUMENTS, object_name is the sub-program name. It is always the name of a procedure, function, or trigger. In the case of a package, object name will be the sub-programs, and package name will be the name of the package. This is very important for joining the two tables (see the next query example).
If an argument is an anchored type (EMPLOYEES.EMPLOYEE_ID%TYPE) you will not see the anchor type. You will see the underlying data type (NUMBER, for example) as the argument type. However, if the code is created with anchored types, you will see, along with the data type, the scale and precision of that anchored value. Normally you can't include scale or precision in an argument but since Oracle is aware of the base objects scale and precision, it can keep track of that information. That doesn't really help if you want to know which anchored type. Still, the information is useful when available.
One of the big objects that I am concerned with as a database architect is standards compliance. Are things being named correctly? Are the correct data types being used? The following example is a query I used until PL/Scope became available. It was an easy way to ensure naming standard compliance for program unit parameters.
select package_name, object_name, argument_name,

          position, in_out, data_type

  from user_arguments

  where argument_name not like 'P_%';


PACKAGE_NAME  OBJECT_NAME  ARGUMENT_NAME  POSITION  IN_OUT DATA_TYPE

------------- ------------ -------------- --------- ----------- -----------------------

JOBS_API      JOB_EXISTS   JOB_TITLE      1         IN          VARCHAR2
The next example is a query that shows the differences in arguments for an overloaded procedure. I could have written it against only the USER_ARGUMENTS view but I wanted to show an example of joining the two views.
select ua.package_name, up.procedure_name, ua.argument_name, up.overload, position, IN_OUT

  from user_procedures up

  join user_arguments ua

  on (ua.object_name = up.procedure_name

  and ua.subprogram_id = up.subprogram_id)

  where up.overload is not null

  order by overload, position;


PACKAGE_NAME     PROCEDURE_NAME          ARGUMENT_NAME       OVERLOAD   POSITION IN_OUT

---------------- ----------------------- ------------------- ---------- -------- ------

DEPARTMENTS_API  DEPARTMENT_MANAGER_ID                       1          0        OUT

DEPARTMENTS_API  DEPARTMENT_MANAGER_ID   P_DEPARTMENT_NAME   1          1        IN

DEPARTMENTS_API  DEPARTMENT_MANAGER_ID                       2          0        OUT

DEPARTMENTS_API  DEPARTMENT_MANAGER_ID   P_DEPARTMENT_ID     2          1        IN
Notice the POSITION and IN_OUT columns. The procedure, DEPARTMENT_MANAGER_ID, is actually a function. The IN_OUT column is “OUT” and the position is 0. For a function, position 0 is the return value (a function must always have a return value). You can infer that a program unit is a function by looking at position. Function return values also do not have an argument name. If you have a record in the USER_ARGUMENTS table that does not have a name, it is the RETURN. If a program unit has no parameters, it will not have a record in the USER_ARGUMENTS view.
The following query shows that the procedure SECURE_DML exists in the USER_PROCEDURES view:
SELECT count(*) FROM user_procedures

WHERE object_name = 'SECURE_DML';


COUNT(*)

----------------------

1
The next query, however, shows that even though the procedure SECURE_DML exists as a procedure, it has no parameters so it will not have any records in the USER_ARGUMENTS view:
SELECT count(*) FROM user_arguments

WHERE object_name = 'SECURE_DML';


COUNT(*)

----------------------

0
Another standard that is worth checking, especially since it can be so easily automated, is validating the data types that your standards prohibit (CHAR, LONG, VARCHAR, etc) can be easily queried and questioned. Even though LONG in PL/SQL is just a sub-type of VARCHAR2 now (as opposed to a LONG in a table), I have seen many standards require that PL/SQL code use VARCHAR2(32767) instead.
You can validate data type information for parameters fairly easily by using the following query:
SELECT object_name, argument_name, data_type

  FROM user_arguments

  WHERE data_type IN ('CHAR', 'LONG', 'VARCHAR'),


OBJECT_NAME                    ARGUMENT_NAME                  DATA_TYPE

------------------------------ ------------------------------ ------------------------------

BAD_DATA_TYPES_PRC             P_DATA_IN                      CHAR

BAD_DATA_TYPES_PRC             P_DATA_OUT                     LONG
Unfortunately, you can only get this for parameters from this view. When you validate this kind of information, you really want to validate variables as well as parameters. The section on PL/Scope shows you how to do this.
USER_TYPES
The USER_TYPES view provides information about your types. While you may not think of types as PL/SQL objects, many types, but not all, have type bodies. A type body is PL/SQL like any other program unit. From a purely PL/SQL point of view, the important columns in this view are the number of methods, local_methods, and the supertype columns, name and owner. I am going to assume an understanding of Oracle's object type system for the next couple of paragraphs.
A quick query of this view can determine if the type contains any PL/SQL. If the number of methods is greater than 0, there will be code behind the spec (i.e., a body). Also, if the supertype columns are not null, this means that this is a sub-type. It contains an inherited spec (and potentially an inherited body) from its supertype. Also important is the LOCAL_METHODS column; this is the number of methods defined in the sub-type (0 if not a sub-type or maybe 0 if nothing is over-ridden or extended).
The following query is running against the three object types provided in the demo code for this chapter. The three types include a type with no body (no PL/SQL), a collection type, and a type with a body.
SELECT type_name, typecode, attributes, methods, supertype_name, local_methods

FROM user_types;


TYPE_NAME          TYPECODE     ATTRIBUTES     METHODS    SUPERTYPE_NAME       LOCAL_METHODS

------------------ ------------ -------------- ---------- -------------------- -------------

CODE_INFO          OBJECT       7              0

CODE_INFOS         COLLECTION   0              0

DEMO_TYPE          OBJECT       1              3
You can see from the output that CODE_INFO has seven attributes, no code (no methods), does not inherit from a supertype, and that means no local methods. CODE_INFOS is a collection. Notice that it has no attributes of its own. DEMO_TYPE has a single attribute and three methods. That one has PL/SQL for you to look at.
USER_TYPE_METHODS
When debugging PL/SQL in a type body, there is important information you need to know—not just in how the code is written but in how the methods are defined. While all of the columns have value, the important ones for knowing your code are METHOD_NO, METHOD_TYPE, PARAMETER, RESULTS, OVERIDING and INHERITED.
When you join USER_TYPE_METHODS to USER_PROCEDURES, you join the type name in USER_TYPE_METHODS to the OBJECT_NAME in USER_PROCEDURES and the METHOD_NO to the SUBPROGRAM_ID .The SUBPROGRAM_ID also flows into the USER_ARGUMENTS view.
If you have overloaded methods, the OVERLOAD column will have an incremental sequence. If OVERLOAD is null, the method is not overloaded. Overloading methods are very common when using Oracle's type system, especially with constructors.
The following query shows that the DEMO_TYPE type provides three methods. The OVERLOAD_PROC member procedure is overloaded and the FUNC member function is not.
SELECT utm.type_name, utm.method_type, utm.method_name, up.overload,

       utm.parameters, utm.results

  FROM user_type_methods utm

  JOIN user_procedures up

   ON (utm.type_name = up.object_name

       AND

       utm.method_no = up.subprogram_id)

  WHERE utm.type_name = 'DEMO_TYPE';


TYPE_NAME      METHOD_TYPE METHOD_NAME    OVERLOAD   PARAMETERS    RESULTS

-------------- ----------- -------------- ---------- ------------- ----------------------

DEMO_TYPE      PUBLIC      FUNC                          2             1

DEMO_TYPE      PUBLIC      OVERLOAD_PROC  1          2             0

DEMO_TYPE      PUBLIC      OVERLOAD_PROC  2          2             0
METHOD_TYPE tells you the basics of the method. Is it a PUBLIC method (regular usage) or is it an ORDER or MAP type (for equivalency)?
PARAMETERS and RESULTS provide the input and output to a method. These two columns actually provide the number of values in and out, respectively. In an upcoming example, I will show how using this view and your knowledge of the PARAMETERS to lookup the parameters via USER_ARGUMENTS. You might be wondering why all of the methods say they have two parameters when they are defined with only a single parameter. Type methods always include the SELF parameter, even when it is not included in the spec or referenced in the body of the method. It is always passed in.
INHERITED and OVERRIDING tell you if the method was inherited from a supertype or if it is overriding a method from a supertype, respectively. Knowing if the code comes from the supertype is important when debugging and analyzing. It's important to ensure you are looking at the right code.
Not only can USER_TYPE_METHODS be joined to USER_PROCEDURES but it can also be joined to USER_ARGUMENTS for additional detailed information about your object types. The following query shows a few lines of results from the join. It is a great query for validating your naming standards and/or catching invalid data type usages.
  SELECT utm.type_name, utm.method_name, ua.argument_name,

       position, sequence, data_type

  FROM user_type_methods utm

  JOIN user_procedures up

   ON (utm.type_name = up.object_name

       AND

       utm.method_name = up.procedure_name)

  JOIN user_arguments ua

  ON (up.procedure_name = ua.object_name

      AND

      up.object_name = ua.package_name)

 WHERE utm.type_name = 'DEMO_TYPE'

   AND rownum < 5;  -- usign rownum just to keep the example short


TYPE_NAME   METHOD_NAME      ARGUMENT_NAME  POSITION   SEQUENCE  DATA_TYPE

----------- ---------------- -------------- ---------- --------- ------------

DEMO_TYPE   FUNC                            0          1         NUMBER

DEMO_TYPE   FUNC             SELF           1          2         OBJECT

DEMO_TYPE   FUNC             P_VALUE        2          3         VARCHAR2

DEMO_TYPE   OVERLOAD_PROC    SELF           1          1         OBJECT
USER_TRIGGERS
USER_TRIGGERS contains information about triggers that are defined in your database. While it is a useful place to find code, and it does contain useful information about the trigger and how the trigger is defined, it does not contain much information about the code. Use this view as a loop through USER_SOURCE to quickly view the code line by line.
PL/SCOPE
PL/SCOPE is a feature of the PL/SQL compiler that provides data for an extension to the data dictionary. This feature takes information gathered at compile time (information the compiler needs anyway) and drops it into a view (the usual three: USER_*, ALL_* and DBA_*) called USER_IDENTIFIERS. The data dictionary provides information about variables and other identifiers that are used in your PL/SQL code. In addition to showing the name of all identifiers, it also identifies what the variables are (data types as well as variables vs. parameter vs. etc.), how they are used (declared, referenced, assigned, etc.) and where they are used (the context of the declaration, assignment, etc.).
![]() Note PL/Scope is a version 11+ feature. If you are still using a version less than 11.0, you will need to upgrade to take advantage of both PL/Scope and DBMS_HPROF (dynamic profiling is discussed later). If you are using an earlier version, you can get some of this information from the dictionary views discussed earlier. I recommend an upgrade because you will benefit by many more things in 11g than just code analysis.
Note PL/Scope is a version 11+ feature. If you are still using a version less than 11.0, you will need to upgrade to take advantage of both PL/Scope and DBMS_HPROF (dynamic profiling is discussed later). If you are using an earlier version, you can get some of this information from the dictionary views discussed earlier. I recommend an upgrade because you will benefit by many more things in 11g than just code analysis.
Every identifier used in your code (and this is true for any language, not just PL/SQL) has a context. This context is the most important part of usage analysis. A variable may be defined in a procedure (DEFINITION) within a package (the DECLARATION). The assignment of a value may be with the definition or it may come later as an assignment step in the body of the code. For a variable or iterator, you will be able to see any variables not REFERENCEd anywhere in the code. For a procedure or function, you can find if it has ever been CALLed. I will show examples of this in more detail next.
What is an identifier?
An identifier is anything that you can use within you code. You can use a procedure (you CALL it). You can use a variable (you can give it values or read values from it). You can use data types (seems odd but you use them when you declare a variable, constant, iterator, etc.). You can use triggers, synonyms, formal parameters, and even exceptions. An identifier is pretty much anything you can use or reference (with the exception of embedded SQL) within your code.
The following are the different types of identifiers that you will encounter when working with PL/SQL:
- Data types and subtypes used (including collections)
- Cursors and ref cursors
- Procedures
- Functions
- Packages and package bodies
- Triggers
- Object types and type bodies
- Parameters
- Function return values
- Variables, iterators, constants
- Exceptions
- Synonyms (are not resolved to any actual objects, there is no validation)
Every identifier has a unique signature that is a column in the USER_IDENTIFIERS view. This signature is a HEX string provided by Oracle—it is a unique string across a database. If you have an identifier named v_my_id declared in two different packages or standalone procedures, the signature will be unique across those program units. If you have the same variable identified at multiple scopes within the same program unit, each will have its own signature. An overloaded procedure within a package will also have two different signatures.
Scope of Identifiers
PL/Scope, by understanding the context, can provide the scope of a variable, hence the name PL/Scope. This ability is not super important for the most part, but it can help in some situations. One example is that when you have a variable defined in two scopes and don't realize it. You may think you are assigning a value to the variable at the higher scope when in fact you are assigning to the local scope. The assignment that PL/Scope shows can't tell you what you meant to do, but at least you will see the same variable declared at multiple scopes in the same call stack (bad practice alert). You can minimize this danger by always referencing the named scope of a variable but I find this makes the code less maintainable rather than more. I just try not to reuse names.
PL/Scope, also by understanding the context, can provide a call stack of procedural code. One of the uses of dynamic code analysis (which will be covered later) is to verify code coverage. Code coverage is the actual execution of all code in a regression test. PL/Scope can give you a static view that at least each program unit is referenced. If you have a procedure that is defined but never called, that's not necessarily a bad thing (it may be called from an external context), but it does give additional information that can be reviewed.
Speaking of external contexts, PL/Scope does show identifiers CALLed or REFERENCEd with an external context. You can then join to the external reference as long as that external context is compiled with PL/Scope turned on. An example of this is when you declare a variable of NUMBER, it makes an external reference to DATATYPENUMBER, which is a subtype declared in DBMS_STANDARD (an Oracle standard package). This would be an external context (external from the view point of the current program unit).
If a procedure in one program unit makes a call to a procedure in another program unit, you can see the complete call stack if both procedures are utilizing PL/Scope. You would not be able to follow the stack into an external C procedure or a Java unit as they are not covered by PL/Scope. Instead, you would see the CALL and the stack would end there (well, not end; you would pick the stack back up when the external reference returned).
Data Gathered
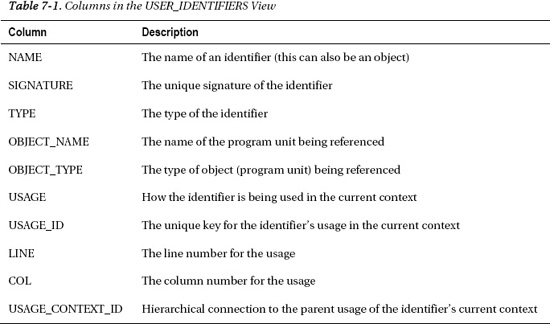
The data gathered by PL/Scope includes the name of an identifier, the usage, and the context of the identifier's usage. It also includes the object where the identifier is defined, the type of object, and the line and column of the usage.
Usage is the way the identifier is used. A data type is used by a variable definition; a procedure can be declared, defined and called. The following are the usages tracked by PL/Scope:
- Declaration: First identification of an identifier, such as a package.
- Definition: Implementation of an identifier, such as a procedure in a package body.
- Assignment: Change the value of an identifier, such as a variable or iterator.
- Reference: Inspect the value of an identifier (including raising an exception).
- Call: Execute an identifier, such as a procedure, function, cursor.
![]() Note Data Type is a context of an identifier, as opposed to a property of an identifier, because not all identifiers have a data type. A procedure is an identifier but it has no data type.
Note Data Type is a context of an identifier, as opposed to a property of an identifier, because not all identifiers have a data type. A procedure is an identifier but it has no data type.
All of the columns in the USER_IDENTIFIERS view are important. Table 7-1 contains the columns in the view and a brief description of the columns.
To understand the usage columns a bit better, you need to look at the raw data in the view. The following is an example query against the view. The output is representative of what you will see in your own queries. Note that the view will be empty until you have compiled your code with PL/Scope turned on (which is explained in the next section “Configuring PL/Scope”).
SELECT * FROM (

  SELECT object_name, name, type, usage, usage_id, usage_context_id

    FROM user_identifiers

    WHERE object_name = 'JOBS_API'

      AND object_type = 'PACKAGE BODY'

    ODER BY line, col, usage_id)

WHERE rownum < 6; -- keeping it small
OBJECT_NAME NAME TYPE USAGE USAGE_ID USAGE_CONTEXT_ID
------------ ------------- ------------ ----------- ---------- ----------------------
JOBS_API JOBS_API PACKAGE DEFINITION 1 0
JOBS_API JOB_EXISTS FUNCTION DEFINITION 2 1
JOBS_API JOB_TITLE FORMAL IN DECLARATION 3 2
JOBS_API V_JOB_ID VARIABLE DECLARATION 4 2
JOBS_API V_JOB_ID VARIABLE ASSIGNMENT 5 2
The first usage (USAGE_ID = 1), is the package definition. The context for this program unit is 0. It is the first usage in the program unit so the USAGE_CONTEXT_ID is 0. You can't mix and match usages or contexts between program units, not even between a spec and a body.
The second row is a function definition. The USAGE_ID is 2 and the context is 1. This means that USAGE_ID 2 is a child of USAGE_ID 1. The function falls under the package.
The third row is a parameter, the fourth line is a variable declaration, and the fifth row is an assignment into the variable defined on row four. All of these usages are children of the function so the USAGE_CONTEXT_ID is 2 (they all fall within the function body).
If you have an overloaded program unit, the SIGNATURE column will uniquely identify which version is being called. The signature is always the signature of the identifier being referenced, not necessarily the current identifier in the object.
The following query shows that overloaded procedures will have different signatures even though they have the same name:
SELECT name, usage, signature

FROM user_identifiers

WHERE object_name = 'PLSCOPE_SUPPORT_PKG'

  AND object_type = 'PACKAGE'

  AND name = 'SOURCE_LOOKUP'

ORDER BY line, col, usage_id;


NAME                           USAGE       SIGNATURE

------------------------------ ----------- --------------------------------

SOURCE_LOOKUP                  DECLARATION A633B1818ABD9AE3739E5A0B6D86EBB8

SOURCE_LOOKUP                  DECLARATION 3ED2FA822BD27B5B10F44226DCB93E0E
Configuring PL/Scope
The Oracle documentation states that PL/Scope is intended for application developers and is usually used in development. I would extend that. It should be used by anyone compiling PL/SQL and it should be used in any database you work in (development, test, and production). PL/Scope stores its data in the SYSAUX tablespace and uses very little space at all (so that should not be a concern). Running PL/Scope is also a compile time activity and not a runtime activity so there is no performance penalty (as there is with compiling with debug turned on). It may slightly increase compile time but not enough that I have been aware of it.
PL/Scope is very easily configured. As mentioned, it is a compile time activity so it is enabled prior to compilation of a program unit. The compiler setting used is called PLSCOPE_SETTINGS. The user, or most likely the user's IDE, will use an ALTER SESSION command to turn on PL/Scope. You can also set it globally by ALTER SYSTEM or per program unit with the ALTER COMPILE statement. I'll show an example of each below.
At this point, there is only an on (ALL) or off (NONE) switch, but in the future there may be some granularity allowed. The default in 11.2 and below is NONE. I would expect that in time ALL would be the default but that's just my personal preference.
To turn on PL/Scope collection at the session level, use this command:
ALTER SESSION SET PLSCOPE_SETTINGS = 'IDENTIFIERS:ALL';
To turn off identifier collection, use this command:
ALTER SESSION SET PLSCOPE_SETTINGS = 'IDENTIFIERS:NONE';
Turning it on and off at the system level is similar. I'm not going to go into the details of the ALTER SYSTEM command and how it stores the values, but an example might be the following:
ALTER SYSTEM SET PLSCOPE_SETTINGS = 'IDENTIFIERS:ALL';
To compile an object with identifier collection, use the appropriate alter (PROCEDURE, PACKAGE, TRIIGER, FUNCTION, TYPE, etc.), like so:
ALTER PACKAGE batch_overlord COMPILE PLSCOPE_SETTINGS = 'IDENTIFIERS:ALL';
Once you have compiled the program unit, you can use the view USER_PLSQL_OBJECT_SETTINGS to see the settings, like so:
SQL> SELECT type, plscope_settings

           FROM user_plsql_object_settings

          WHERE name = 'EMPLOYEE_API';


TYPE         PLSCOPE_SETTINGS

------------ ---------------------------------------------------------------------

PACKAGE      IDENTIFIERS:ALL

PACKAGE BODY IDENTIFIERS:ALL
That's all there is to it. Once it's set up, you can start using it. Don't forget to recompile your code with PL/Scope turned on.
Change Impact Analysis
Change impact analysis allows a developer or analyst to assess the impact of intended changes in code to other areas of the code. In my experience, impact analysis is very rare. The norm seems to be to make changes and discover the repercussions after the fact. This can be very expensive in terms of time, money, and reputation. It is far better to know ahead of time, so that impacts can be analyzed and planned for instead of running into issues after moving code to test (or worse, production) environments.
When impact analysis is completed, you, or the person doing the analysis, should have a fairly deep understanding of the objects that will require changes. Not only will you know which objects require changes but test cases can be created for each object to be changed, and regression tests can be planned and estimated for all changed objects. By knowing ahead of time which objects to test, you will also be able to schedule time for appropriate performance testing to ensure the changes do not negatively affect application performance.
The problem with impact analysis is that there are really no one-size-fits-all approaches to the analysis. In a database application, multiple types of changes are possible: data change (changes to types or volumes of data, such as adding new sources), schema changes (changes to database structures), and code changes. There's not much a PL/SQL book can give you to handle data changes; that's very application specific. For schema changes, the USER_DEPENDENCIES view is still your best bet to see which objects have references to other objects in the schema. The rest of this section will deal with code changes (which may be related to, or a result of, data or schema changes).
The way impact analysis has been done in most organizations where I have worked is to either assume you have omniscient knowledge of the application and everything that uses it or to change an object and see where it invalidates downstream objects. Both approaches are just ugly. For one thing, if you are already changing objects, then you are past the estimation phase, which is where you really want to start this process. For another, there's no indication of exactly what caused the invalidation. This is a highly tedious and error-prone approach.
Isn't it a better approach to use the data available in the data dictionary to run a report and get a listing of exactly the data related to a change? A human being can then use this (mostly, hopefully) automated data gathering.
The way to begin an impact change analysis is to break down the requirements into component parts. Each part contains a change and that change has some impact (normally) to the application. The next step is to identify all of the units that will be impacted.
This breaking down can be done at an object level (such as at the package level). At that high of a level, though, you are hit with all of the issues as described earlier in the sections on USER_SOURCE and USER_DEPENDENCIES. Ideally, you would have a very granular view of the source code without resorting to a line-by-line scan of the code. PL/Scope can provide a very fine-grained view of the program units called by other program units. Note that PL/Scope does not help with external code or code called from views. You would use the dependency views for view support and tools external to the database for external code and Java.
I don't include it in this book but I also frequently pull out related information and store it in my own tables. I will collapse parent/child records into a single record (for example, collapse rows to combine a package.function call). In this way, I have a multi-pass system that allows for a greater range of programs that use easier-to-maintain queries. Explaining the full system I use is way out of scope here but when you start writing your own queries, remember that you can write parts of the query, save those results, and then write queries against the saved data.
In the demo code provided for this chapter is a package called PLSCOPE_SUPPORT_PKG. This package contains some useful code for dealing with various aspects of PL/Scope. I'll start with the procedure PRINT_IMPACTS, which is an overloaded procedure. The version I will use first takes as parameters a program unit owner (P_OWNER), name (P_OBJECT), and sub unit name (P_UNIT).
Let's take an example. Suppose you planned to change the HR.JOBS_API.VALIDATE_JOB procedure so that it took an extra parameter or changed the return data type. You would want to know where all calls to that function are. The example call to the support package would look like this:
SQL> exec plscope_support_pkg.print_impacts('HR', 'JOBS_API', 'VALIDATE_JOB'),


Impact to PACKAGE BODY HR.EMPLOYEE_API.CREATE_EMPLOYEE at line 40 and column 12

Impact to PROCEDURE HR.TEST_CALLS_PRC at line 8 and column 8

Impact to PROCEDURE HR.TEST_CALLS_PRC at line 4 and column 6

Impact to FUNCTION HR.TEST_CALLS_FNC at line 5 and column 10


PL/SQL procedure successfully completed.
From this view, you can see that three objects are impacted and one of those objects (HR.TEST_CALLS_PRC) is impacted twice. In an application this small, it is probably just as easy to query USER_SOURCE or grep your code repository and eyeball the results. However, in a very large system, this kind of conciseness makes analysis much easier.
If you wanted to see the source text with your output, you could pass in an optional BOOLEAN with the call to PRINT_IMPACTS, like so:
SQL> set serveroutput on format wrapped

SQL> exec plscope_support_pkg.print_impacts('HR', 'JOBS_API', 'VALIDATE_JOB', TRUE);


Impact to PACKAGE BODY HR.EMPLOYEE_API.CREATE_EMPLOYEE at line 40 and column 12

    TEXT:

              IF NOT jobs_api.validate_job(p_job_t

          tle, p_department_name)


Impact to PROCEDURE HR.TEST_CALLS_PRC at line 8 and column 8

    TEXT:

              IF JOBS_API.VALIDATE_JOB('a', 'b')


Impact to PROCEDURE HR.TEST_CALLS_PRC at line 4 and column 6

    TEXT:

            IF JOBS_API.VALIDATE_JOB('a', 'b')


Impact to FUNCTION HR.TEST_CALLS_FNC at line 5 and column 10

    TEXT:

            RETURN JOBS_API.VALIDATE_JOB('a', 'b')


PL/SQL procedure successfully completed.
This code is just a demo but it shows how you can use PL/Scope to walk through the hierarchy of identifiers to find so much valuable information about your code. The meat of these impact analysis procedures is this query from PLSCOPE_SUPPORT_PKG.GET_IMPACT_INFO. (Note that I simplified both the procedures and the main query so that they would better serve as an example. An example that can handle nested blocks is a bit more complex, needlessly so for the purpose of this section. Just know that this code is a demo and a starting point, not a complete impact analysis program.) The following code is from PLSCOPE_SUPPORT_PKG.GET_IMPACT_INFO and is the FOR LOOP query starting at line 54:
SELECT code_info( ai.owner,

                  prior_object_name,

                  CASE

                  WHEN ai.object_type IN ('PROCEDURE', 'FUNCTION')

                  THEN NULL

                  ELSE

                    ai.name

                  END,

                  ai.object_type,

                  'CALL',

                  cnctby_vw.line,

                  cnctby_vw.p_col ) code_value

        FROM all_identifiers ai, (

   SELECT usage, level, usage_id, usage_context_id, PRIOR usage_id p_usage_id,

          PRIOR usage_context_id prior_usagectx_id,

          object_name, name, object_type, type, line, PRIOR col p_col,

          PRIOR object_name prior_object_name, PRIOR name p_name,

          PRIOR object_type prior_object_type

      FROM all_identifiers
      WHERE OWNER = p_owner

        AND OBJECT_TYPE IN ('PACKAGE BODY', 'PROCEDURE', 'FUNCTION', 'TRIGGER', 'TYPE BODY')

        AND USAGE NOT IN ('DECLARATION', 'ASSIGNMENT', 'DEFINITION')

        AND type IN ('PACKAGE BODY', 'FUNCTION', 'PROCEDURE', 'TYPE', 'TYPE BODY')

      CONNECT BY PRIOR usage_id = usage_context_id

         AND PRIOR name = p_object

         AND name = p_unit

         AND prior usage_context_id != 0 )  cnctby_vw

  WHERE ai.usage_id = cnctby_vw.prior_usagectx_id

    AND ai.object_name = cnctby_vw.prior_object_name

    AND ai.object_type = cnctby_vw.prior_object_type  )
The inner query (cnctby_vw) is a hierarchical query that gets the changed program unit information. This query is specifically looking for packaged calls. It's easily modified to find any kind of calls; I leave that exercise to you. Modifying it to find procedure or function calls is easier than finding packaged calls or object methods.
The outer query ties the changed unit (the CALLED program unit) to the sub-unit (procedure or function in a package) or, if standalone, to the standalone unit.
Before creating your own impact analysis queries using this query as a basis, I suggest that you start with the inner query and play with that for a while. That basic query can be modified to return almost any two related items that PL/Scope provides.
Validating Naming Standards Compliance
Like USER_PROCEDURES, USER_ARGUMENTS and the USER_TYPE family of views, PL/Scope can provide intelligence on naming standards compliance. PL/Scope is even better, though, because you can verify the naming of variables internal to packages as well as in the body of procedures and functions, as opposed to just parameters and program unit naming.
The following query will find all variables that don't begin with ‘V_' and parameters that don't begin with ‘P_'. It could be extended using a hierarchical query like the one in the code analysis section to validate globals and sub-types.
SELECT  ui_var.name, type, usage, line, col

  FROM user_identifiers ui_var

  WHERE ui_var.object_name = 'JOBS_API'

    AND ui_var.object_type = 'PACKAGE BODY'

    AND (

          (ui_var.type = 'VARIABLE' AND name NOT LIKE 'V_%')

      OR

          (ui_var.type IN ('FORMAL IN', 'FORMAL OUT', 'FORMAL IN OUT')

             AND name NOT LIKE 'P_%')

        )

    AND ui_var.usage = 'DECLARATION'

  ORDER BY line, col;


NAME                TYPE               USAGE       LINE       COL

------------------- ------------------ ----------- ---------- -------

JOB_TITLE           FORMAL IN          DECLARATION 4          5
If you look at the code in JOBS_API starting at line 4, you will find the following code:
  FUNCTION job_exists(

    job_title  IN jobs.job_title%TYPE )

  RETURN jobs.job_id%TYPE AS

    v_job_id jobs.job_id%TYPE;

  BEGIN

    SELECT job_id

      INTO v_job_id

      FROM jobs

      WHERE UPPER(job_title) = upper(job_title);
From this code, you can see that it does indeed have a parameter named JOB_TITLE. Looking at the query in the code, you will find that the query has a problem. The problem lies in the WHERE clause where the same column name is referenced twice. The person writing the function intended to compare the table column to the parameter, but that's not the comparison that will happen. Here is the offending comparison:
WHERE UPPER(job_title) = UPPER(job_title);
If someone were to run that select, every record in the table would match (the SQL parser will use job_title from the table instead of the job_title parameter). The fix is to rewrite the function specification as follows, adding a p_ to the parameter name:
FUNCTION job_exists(

    p_job_title  IN jobs.job_title%TYPE )

  RETURN jobs.job_id%TYPE;
Modify the filter criteria in the WHERE clause to add the p_ that was added to the parameter, like so:
WHERE UPPER(job_title) = upper(p_job_title);
The reason the query would not run successfully is that, as far as Oracle is concerned, the filter was comparing the value in the column job_title to the value in the column job_title. That would be the same as the criteria WHERE 1=1. The result is that every row in the table would be returned—obviously not what was intended. By adding the p_ prefix to both the parameter and its usage, the filter will only return the row where the job title in the table matches the job_title passed into the function.
Finding Unused Identifiers
Many organizations have standards about variable usage, such as “no global variables and/or all variables must be used.” I don't particularly agree with the no globals rule (although the usage of globals should be carefully considered). However, I do agree that having unused variables in a program makes maintaining it more complex (cluttery mostly).
With PL/Scope, it is easy to see which variables, at any scope, are not used. You will have a declaration and no reference. The next several queries will build up to a query that will find a procedure that defines an unused global protected variable, an unused parameter, and an unused local variable.
First, list all of the declared variables in a package body (note that this will not pick up globals defined in the spec, only protected globals defined in the body), like so:
SELECT  ui_var.name, type, usage, line, col

  FROM user_identifiers ui_var

  WHERE ui_var.object_name = 'VARIABLES_PKG'

    AND ui_var.object_type = 'PACKAGE BODY'
    AND ui_var.type IN ('VARIABLE', 'FORMAL IN', 'FORMAL OUT', 'FORMAL IN OUT')

    AND ui_var.usage = 'DECLARATION'

  ORDER BY line, col;


NAME                           TYPE           USAGE       LINE     COL

------------------------------ -------------- ----------- -------- -----

G_PROTECTED_VARIABLE_USED      VARIABLE       DECLARATION 3        3

G_PROTECTED_VARIABLE_UNUSED    VARIABLE       DECLARATION 4        3

P_KEYNUM                       FORMAL IN      DECLARATION 7        5

P_DATE                         FORMAL IN OUT  DECLARATION 8        5

P_LOB                          FORMAL OUT     DECLARATION 9        5

V_USED_VARIABLE                VARIABLE       DECLARATION 11       5

V_UNUSED_VARIABLE              VARIABLE       DECLARATION 12       5
The easiest way to validate that all of these parameters/variables are used is to check that they are referenced. However, you could do an assignment and never reference a variable (what would be the use of that?) and you can also assign a variable in the same step that it is declared. For me, I want to be sure all variables are being used (which means a reference regardless of assignment).
To see the variables that are being referenced, it's as easy as changing the usage from DECLARATION to REFERENCE, which the following query does:
SELECT  ui_var.name, type, usage, line, col

  FROM user_identifiers ui_var
  WHERE ui_var.object_name = 'VARIABLES_PKG'

    AND ui_var.object_type = 'PACKAGE BODY'

    AND ui_var.type IN ('VARIABLE', 'FORMAL IN', 'FORMAL OUT', 'FORMAL IN OUT')

    AND ui_var.usage = 'REFERENCE'

  ORDER BY line, col;


NAME                           TYPE        USAGE       LINE      COL

------------------------------ ----------- ----------- --------- -----

P_KEYNUM                       FORMAL IN   REFERENCE   14        24

V_USED_VARIABLE                VARIABLE    REFERENCE   16        22

G_PROTECTED_VARIABLE_USED      VARIABLE    REFERENCE   16        40

P_LOB                          FORMAL OUT  REFERENCE   17        39
This shows that there are three missing variables. Using a simple bit of SQL, they are easily findable. This final query returns the declared variables that are not being used:
SELECT  name, type, usage, line, col

  FROM user_identifiers

  WHERE object_type = 'PACKAGE BODY'

    AND usage = 'DECLARATION'

    AND (name, type) IN (

SELECT  ui_var.name, type

  FROM user_identifiers ui_var

  WHERE ui_var.object_name = 'VARIABLES_PKG'

    AND ui_var.object_type = 'PACKAGE BODY'

    AND ui_var.type IN ('VARIABLE', 'FORMAL IN', 'FORMAL OUT', 'FORMAL IN OUT')

    AND ui_var.usage = 'DECLARATION'

MINUS

  SELECT  ui_var.name, type

  FROM user_identifiers ui_var

  WHERE ui_var.object_name = 'VARIABLES_PKG'

    AND ui_var.object_type = 'PACKAGE BODY'

    AND ui_var.type IN ('VARIABLE', 'FORMAL IN', 'FORMAL OUT', 'FORMAL IN OUT')

    AND ui_var.usage = 'REFERENCE')

  ORDER BY line, col;


NAME                           TYPE               USAGE       LINE     COL

------------------------------ ------------------ ----------- -------- -------

G_PROTECTED_VARIABLE_UNUSED    VARIABLE           DECLARATION 4        3

P_DATE                         FORMAL IN OUT      DECLARATION 8        5

V_UNUSED_VARIABLE              VARIABLE           DECLARATION 12       5
If you remove the outer query where criteria (the fourth line in the previous query),
AND usage = 'DECLARATION'
you can add additional records indicating those variables that are declared and assigned a value but are never referenced (the results from that change follow).
NAME                           TYPE               USAGE       LINE     COL

------------------------------ ------------------ ----------- -------- --------

G_PROTECTED_VARIABLE_UNUSED    VARIABLE           ASSIGNMENT  4        3

G_PROTECTED_VARIABLE_UNUSED    VARIABLE           DECLARATION 4        3

P_DATE                         FORMAL IN OUT      DECLARATION 8        5

V_UNUSED_VARIABLE              VARIABLE           DECLARATION 12       5
Finding Scope Issues
Another bad coding practice is creating variables of the same name at different scopes in a program. If you always include the scope in a reference, then you ensure you are accessing the correct item. However, it makes for painful maintenance and is generally a bad idea.
To provide an example, I am using the SCOPE_PKG demo package provided. The package specification and body are listed here for easy reference:
create or replace PACKAGE SCOPE_PKG AS

  i CONSTANT NUMBER := 0;


  g_global_variable NUMBER := 10;


  PROCEDURE proc1 ;

END SCOPE_PKG;

/


create or replace PACKAGE BODY SCOPE_PKG AS


  PROCEDURE proc1

  AS

    i PLS_INTEGER := 30;

  BEGIN
    FOR i IN 1..10

    LOOP

      DBMS_OUTPUT.PUT_LINE(i);

    END LOOP;


    DBMS_OUTPUT.PUT_LINE(i);

  END;


END SCOPE_PKG;

/
The next query shows all variables identifiers (VARIABLES, CONSTANTS, and ITERATORS) that are declared at different scopes in the same program (in this case, a package). A package can declare variables in both a spec and a body. It's up to you to decide if the scoping is an error.
WITH source_ids AS (

  SELECT    *

    FROM user_identifiers

      WHERE object_name = 'SCOPE_PKG'

        AND object_type IN ('PACKAGE BODY', 'PACKAGE')

)

SELECT name, type, usage, prior name, object_type, line, col

  FROM source_ids si

  WHERE type IN ('VARIABLE', 'ITERATOR', 'CONSTANT')

    AND usage = 'DECLARATION'

    AND EXISTS (

      SELECT count(*), name

        FROM user_identifiers

        WHERE object_Name = si.object_name

          AND name = si.name

          AND usage = si.usage

        GROUP BY name

        HAVING count(*) > 1 )

  START WITH usage_context_id = 0

  CONNECT BY PRIOR usage_id = usage_context_id

    AND PRIOR object_type = object_type;


NAME     TYPE        USAGE       PRIORNAME    OBJECT_TYPE   LINE     COL

-------- ----------- ----------- ------------ ------------- -------- ------

I        CONSTANT    DECLARATION SCOPE_PKG    PACKAGE       3        3

I        VARIABLE    DECLARATION PROC1        PACKAGE BODY  5        5

I        ITERATOR    DECLARATION PROC1        PACKAGE BODY  8        9
The variable I is declared in the package spec, in a procedure in the body, and as a loop iterator in the same procedure.
You can include additional criteria to the query and only return values that are definite collisions. You would do that by including the hierarchy—if one declaration is included in a USAGE_ID that is also covered by a higher USAGE_CONTEXT_ID, such as if the usage is a child of a previous usage.
Data Types Checks
In the section on USER_ARGUMENTS, I showed how you can validate data types but also how it is limited to just parameters. With PL/Scope, I can extend that to include variables defined anywhere in a program. Using the same demo procedure, BAD_DATA_TYPES_PRC, the following query shows how you can find those variables (and parameters):
SELECT * FROM (

WITH source_ids AS (

  SELECT    line,

            col,

            name,

            type,

            usage,

            usage_id,

            usage_context_id,

            object_name

    FROM user_identifiers

      WHERE object_name = 'BAD_DATA_TYPES_PRC'

        AND object_type = 'PROCEDURE')

SELECT  prior name "Identifier",

        CASE

        WHEN prior type IN ('FORMAL IN', 'FORMAL OUT', 'FORMAL IN OUT')

        THEN 'PARAMETER'

        WHEN prior type IN ('VARIABLE', 'CONSTANT', 'ITERATOR')

        THEN 'VARIABLE'

        ELSE prior name

        END "Identififer Type",

        Name "Data Type",

        Usage

  FROM source_ids

  START WITH usage_context_id = 0

  CONNECT BY PRIOR usage_id = usage_context_id

  ORDER SIBLINGS BY line, col

)

WHERE usage =  'REFERENCE';


Identifier      Identififer Type     Data Type     USAGE

--------------- -------------------- ------------- -----------

P_DATA_IN       PARAMETER            CHAR          REFERENCE

P_DATA_OUT      PARAMETER            LONG          REFERENCE

V_CHAR          VARIABLE             CHAR          REFERENCE

V_VARCHAR       VARIABLE             VARCHAR       REFERENCE

V_LONG          VARIABLE             LONG          REFERENCE
One thing that is still not available is being able to verify if a data type is anchored or not. Having that as part of PL/Scope as just another child of the identifier declaration would be excellent. You can infer that (using user_arguments) a data length or data precision means that an argument is anchored but null does not mean not anchored. Date data types, for example, do not have a scale.
Performing Dynamic Analysis
Moving on from static analysis to dynamic analysis, let's look at the tools available in a pre-11g Oracle database (DBMS_PROFILER and DBMS_TRACE) and what is available in post 11g (those plus DBMS_HPROF). Even though DBMS_HPROF is a better tool for performance metrics (much better, in my opinion), DBMS_PROFILER and DBMS_TRACE still provide some usability for code coverage testing.
This section is not intended to be a tutorial on how to use the built-in packages mentioned, but it will cover some basics to get you up and running. This section will point out which parts of the built-ins are useful for knowing your code.
There are two primary benefits to be gained by running dynamic analysis using these Oracle-provided tools. The first is insight into the performance profile of your application. By profiling, you can identify bottlenecks in your code before putting it into production. The second, which is sort of an unintentional side benefit, is the ability to test for code coverage (more on this later).
Note that Chapter 13 specifically covers profiling and instrumentation from a performance perspective but does not cover the Oracle-supplied packages discussed here. For a complete introduction to the packages discussed in the chapter, the Oracle documentation outlines all of the parameters and such.
DBMS_PROFILER and DBMS_TRACE
DBMS_PROFILER is a flat profiler. It provides timing information between two procedure calls in a PL/SQL program. You “turn on” the profiler to start a timer and then “turn it off” when you want to stop the timer. The time between the “on” and “off” is the amount of time that it took to run (with some minimal overhead from the DBMS_PROFILER code).
Form a performance perspective, DBMS_PROFILER is most powerful when used with DBMS_TRACE. The DBMS_TRACE package provides context for the timings that are gathered by DBMS_PROFILER. It provides a dynamic version of the static hierarchy provided by PL/Scope. PL/Scope shows you identifiers, and by inference the code, in the order that it can happen. PL/Scope shows you every possibility; DBMS_TRACE shows you the hierarchy that was actually executed.
DBMS_TRACE requires all code that will be traced to be compiled with DEBUG=TRUE. Running procedures compiled for debug is not recommended in production, so that makes the DBMS_TRACE package useless as instrumentation. However, as a way to know your code, there is still value to the package.
The output of a DBMS_TRACE session shows which procedure called which procedure, in order. The output of DBMS_TRACE combined with the line-by-line profiling from DBMS_PROFILER is the easiest way to do semi-automated code coverage that I have found. Even in a post 11g world, there is still some value to DBMS_TRACE and DBMS_PROFILER that can't be captured any other way. DBMS_TRACE will create a record for every line executed. When used in conjunction with PL/Scope (11g+ only), you get a great tool for line-oriented code coverage.
Configuring DBMS_PROFILER and DBMS_TRACE
Setting up both tools is a fairly simple process. You need EXECUTE on both DBMS_PROFILER and DBMS_TRACE. The packages should already exist in the database.
Before using the tools, you (or a DBA) will need to run a couple of scripts to create the underlying tables. The scripts are available in the $ORACLE_HOM/RDBMS/ADMIN directory. PROFTAB.sql will create the tables needed for DBMS_PROFILER and TRACETAB.sql for DBMS_TRACE. Note that TRACETAB.sql must be run as SYS. The tables that get created in these scripts will be described later.
If you are running multiple applications on a single server, you may want to create a common PROFILER user and run PROFTAB.sql as that user. This way, you can grant access to the tables and create synonyms for them and all applications can share the same tables. When you run reports about relationships between program calls, you can span schemas. If you want to keep runs separate or you only have a single application schema, you can run it as the script schema.
When running DBMS_PROFILER and DBMS_TRACE, you are required to have specific permissions and compiler options set. For any code to trace or profiled, you will need execute granted to the profiling schema. Also, for DBMS_PROFILER, it needs CREATE access on any program units to be profiled. Finally, DBMS_TRACE requires that the program unit be compiled with DEBUG=TRUE.
You will need SELECT access granted to your user account to query from the DBMS_TRACE tables. If the database user you are connecting as owns the DBMS_PROFILER tables, you will not need any additional grants. If a common profiler user owns the tables, that schema needs to grant SELECT to your schema.
That's it for configuration. After performing these setup steps, you are ready to gather some information.
DBMS_PROFILER and DBMS_TRACE Example Session
This section provides an example profiling and tracing session using both DBMS_PROFILER and DBMS_TRACE. All of the resultant trace and profiling information displayed in this section was generated using the code presented here:
DECLARE

  v_employee_id employees.employee_id%TYPE;

BEGIN

  -- Start the profiling session

  dbms_profiler.start_profiler;

  dbms_trace.set_plsql_trace(

                   DBMS_TRACE.trace_enabled_calls

                   +

                   DBMS_TRACE.trace_enabled_exceptions

                   +

                   DBMS_TRACE.trace_all_sql

                   +

                   DBMS_TRACE.trace_all_lines);


  -- call the top level procedure to be profiled

  v_employee_id := employee_api.create_employee(

        p_first_name => 'Lewis',

        p_last_name => 'Cunningham',

        p_email => '[email protected]',

        p_phone_number => '888-555-1212',

        p_job_title => 'Programmer',

        p_department_name => 'IT',

        p_salary => 99999.99,

        p_commission_pct => 0 );
  -- Stop the profiling session

  dbms_trace.clear_plsql_trace;

  dbms_profiler.stop_profiler;


END;
DBMS_PROFILER.start_profiler begins the profiling session and DBMS_TRACE.set_plsql_trace starts the event tracing. Both procedures take optional parameters as input. The DBMS_TRACE parameter TRACE_LEVEL identifies how much information to gather. In this case, I wanted a record created for all enabled calls (calls to program units compiled with DEBUG), all enabled exceptions, all SQL calls, and for all lines. This is really overkill for the most part. The output is shown next.
DBMS_PROFILER and DBMS_TRACE Output
When run, DBMS_TRACE compiles data into two tables. These tables are as follows:
- PLSQL_TRACE_RUNS – DBMS_TRACE: The top-level table that identifies each individual run.
- PLSQL_TRACE_EVENTS – DBMS_TRACE: A very useful table that can log every line executed in a trace session, can quickly get very large very, and requires monitoring.
When run, DBMS_TRACE compiles data into the following tables:
- PLSQL_PROFILER_RUNS – DBMS_PROFILER: The top-level table that identifies each individual profiler session.
- PLSQL_PROFILER_UNITS – DBMS_PROFILER: Describes the program units executed during a profiling session.
- PLSQL_PROFILER_DATA – DBMS_PROFILER: Timing and execution statistics for each unit run during a session.
You can identify a DBMS_PROFILER run by the RUN_DATE and RUN_COMMENT (optional; defaults to the SYSDATE of the run initiation). The following query shows the data stored in the PLSQL_PROFILER_RUNS table after two profiler sessions:
select runid, run_date, run_comment, run_total_time

from plsql_profiler_runs;


RUNID     RUN_DATE               RUN_COMMENT      RUN_TOTAL_TIME

---------- --------------------- ---------------- ----------------------

2          13-MAR-2011 11:56:54  13-MAR-11        133000000

3          13-MAR-2011 12:30:18  13-MAR-11        80000000
From this output, you can identify the run you are looking for. When analyzing for performance, you will often average over many runs of the same program code. For the needs of this example, I will use a distinct program run.
Identifying a trace sessions is much the same as identifying a profiler session. The session is identified by a RUNID and a RUN_DATE. The following query shows the data stored in the PLSQL_TRACE_RUNS table after a tracing session:
SELECT runid, run_date

FROM plsql_trace_runs;


RUNID                  RUN_DATE

---------------------- -------------------------

10                     26-MAR-2011 11:04:35
DBMS_PROFILER provides timing information about the executable lines in a run. You gather the information and then analyze that information to determine if there is a bottleneck in the code. Code that runs for a long time may be okay; then again, it may not. That determination comes from your analysis. The profiler can't tell you where you have a performance problem. The profiler can only give you a performance profile for your analysis. Once you have analyzed the output and made any changes, you would then run another profiling session to validate your changes.
The following query lists the timing gathered by the profiler line by line. I have removed many lines of output to keep the size down. I'm ignoring the ANONYMOUS BLOCK entries as they are noise from the run itself.
SELECT unit_name, unit_type, line#, total_occur, ppd.total_time, max_time

  FROM plsql_profiler_units ppu

  JOIN plsql_profiler_data ppd

    ON (ppu.runid = ppd.runid

       AND

       ppu.unit_number = ppd.unit_number)

WHERE ppu.runid = :RUNID

  AND unit_type != 'ANONYMOUS BLOCK'  ;


UNIT_NAME           UNIT_TYPE      LINE#    TOTAL_OCCUR   TOTAL_TIME    MAX_TIME

------------------- -------------- -------- ------------- ------------- -------------

EMPLOYEE_API        PACKAGE BODY   3        1             11982         9985

EMPLOYEE_API        PACKAGE BODY   20       1             1997          1997

EMPLOYEE_API        PACKAGE BODY   21       1             2995          2995

DEPARTMENTS_API     PACKAGE BODY   3        1             7988          6989

DEPARTMENTS_API     PACKAGE BODY   8        1             0             0

JOBS_API            PACKAGE BODY   3        1             7988          6989

JOBS_API            PACKAGE BODY   7        1             0             0

.

.

.

80 rows selected
This listing shows the line executed for each program unit profiled. It gives you the number of occurrences and the total time spent on that line (including calls to called program units). The max time is the longest time spent on any particular call. Using this information, you should be able to get a good feel of where you would begin your investigation into any performance issues.
While the performance metrics are great, it would be better if you knew the context, or call hierarchy, of the times. DBMS_TRACE does not quite give you that, but it does give you the call structure. To view the executed code hierarchy (remember that this is the actual execution, not the expected or possible execution), you can run the following very simple query:
SELECT event_unit, event_proc_name,

       CASE

         WHEN proc_unit IS NOT NULL and proc_name IS NOT NULL

           THEN proc_unit || '.' || proc_name || '(' || proc_line || ')'

         WHEN proc_unit IS NULL and proc_name IS NOT NULL

           THEN proc_name || '(' || proc_line || ')'

         ELSE

           substr(event_comment,1,30)

       END executed_code

FROM plsql_trace_events pse

WHERE runid = :RUNID

 AND event_unit NOT IN ('<anonymous>', 'DBMS_TRACE')

 AND event_kind NOT IN (50, 51)

ORDER BY event_seq;


EVENT_UNIT        EVENT_PROC_NAME                 EXECUTED_CODE

---------------- ------------------------------- ------------------------------------------

EMPLOYEE_API      CREATE_EMPLOYEE                 DEPARTMENTS_API.DEPARTMENT_EXISTS(3)

DEPARTMENTS_API   DEPARTMENT_EXISTS               SELECT DEPARTMENT_ID FROM DEPA

EMPLOYEE_API      CREATE_EMPLOYEE                 JOBS_API.JOB_EXISTS(3)

JOBS_API          JOB_EXISTS                      SELECT JOB_ID FROM JOBS WHERE

EMPLOYEE_API      CREATE_EMPLOYEE                 JOBS_API.VALIDATE_JOB(21)

EMPLOYEE_API      CREATE_EMPLOYEE                 DEPARTMENTS_API.DEPARTMENT_MANAGER_ID(29)

DEPARTMENTS_API   DEPARTMENT_MANAGER_ID           SELECT MANAGER_ID FROM DEPARTM

EMPLOYEE_API      CREATE_EMPLOYEE                 Select EMPLOYEES_SEQ.NEXTVAL f

EMPLOYEE_API      CREATE_EMPLOYEE                 INSERT INTO EMPLOYEES (EMPLOYE

EMPLOYEE_API      CREATE_EMPLOYEE                 EMPLOYEE_API.ASSIGN_SALARY(74)

EMPLOYEE_API      ASSIGN_SALARY                   UPDATE EMPLOYEES SET SALARY =


 11 rows selected
This listing (and query) provides the order of execution from the run. EMLOYEE_API.CREATE_EMPLOYEE called DEPARTMENTS_API.DEPARTMENT_EXISTS (which is defined on line 3 in the DEPARTMENTS_API package body). The called program unit then ran a query before returning.
DBMS_TRACE can be very verbose. The examples I am using in this section are fairly simple and back office-ish. When you have very large applications or applications that run for a while and call the same program units over and over, the value of DBMS_TRACE starts to drop off as the complexity increases. For example, there is a demo procedure provided for this chapter called TEST_CALLS_PRC. It is a simple for loop (100 iterations) that calls two procedures for each iteration. Using DBMS_TRACE and DBMS_PROFILER with the same options that I used earlier, compare the differences in number of rows (the lower RUNID is the trace seen earlier for both counts). The following query compares the number of output lines produced between the two runs by DBMS_PROFILER:
SELECT ppd.runid, count(*)

  FROM plsql_profiler_units ppu

  JOIN plsql_profiler_data ppd

    ON(ppu.runid = ppd.runid

    AND ppu.unit_number = ppd.unit_number)
  WHERE ppu.runid IN (9,10)

    AND ppd.total_time != 0

    AND unit_type != 'ANONYMOUS BLOCK'

  GROUP BY ppd.runid;


RUNID                  COUNT(*)

---------------------- ----------------------

9                      29

10                     15
The next query produces the same line counts but for two DBMS_TRACE sessions:
  SELECT runid, count(*)

    FROM plsql_trace_events

    WHERE runid IN (12,13)

    GROUP BY runid;


RUNID                  COUNT(*)

---------------------- ----------------------

12                     100

13                     5545
DBMS_PROFILER has fewer rows for the less complex code but DBMS_TRACE has many, many more rows. When writing queries against the DBMS_TRACE tables, you need to account for that. Use the options to gather only the data you really want and then plan to be creative on filtering out those things you don't want but can't option out of.
Code Coverage Testing and Performance Metrics
Code coverage testing is a method of testing in which you verify that each line of a program that can be executed is actually executed. This kind of testing is regression testing as opposed to functional testing. Just because a piece of code was executed does not mean it was executed correctly. However, if it was executed at least once, then you know it will in fact, under certain circumstances, execute without error.
Code coverage testing is fairly meaningless by itself. However, as part of an automated build process or as one component of an overall test plan, it does have its uses. I like using code coverage for the same reason I like compiler errors. It catches plenty of oopsy. Without the proper tools though, this is very difficult testing to accomplish. Fortunately, Oracle has given us most of what we need.
I'm not particularly concerned with performance metrics here (although there is no reason not to include them). What I want to see is that all of the code that can be executed is executed.
It is possible to combine the output from DBMS_TRACE and DBMS_PROFILER to get a nice trace of each line that executed along with some context. To do so requires creating a funky query and some knowledge of individual runs that are related by being run together or very close together. If you combine a run of the profiler with a run of the trace from different versions of the code, you will get a very ugly mess. However, if you know that you have matching runs, the information is highly useful.
The following query joins the DBMS_PROFILER output and the DBMS_TRACE output. To simplify the query, I am leaving out the PLSQL_TRACE_RUNS and the PLSQL_PROFILER_RUNS tables, which is really where you would start. I'm just manually picking a run from each. I'm dropping certain event types, specifically SQL calls (54) and returns from procedure calls (50). You can get a list of all of the event kinds from the documentation or from the tracetab.sql install code. When looking at the total_time, I like to see who is being called, from where, and exactly what the code is doing. The who and where comes from the DBMS_TRACE data and the what comes from USER_SOURCE. Here is the query:
BREAK ON event_unit ON event_proc_name

SELECT event_unit, event_proc_name, line# line,

       total_time time, pse.proc_unit, pse.proc_name,

       substr(ltrim(rtrim(text)),1,30) source_text

FROM (

  (SELECT ppu.runid, ppu.unit_type, ppu.unit_name,

          ppd.line#, ppd.total_time

     FROM plsql_profiler_units ppu

     JOIN plsql_profiler_data ppd

       ON(ppu.runid = ppd.runid

       AND ppu.unit_number = ppd.unit_number)

     WHERE ppu.runid = :PROF_RUNID

       AND ppd.total_time != 0)) prof_data

JOIN (

    SELECT event_unit, event_proc_name, event_line,

           proc_unit, proc_name, event_unit_kind,

           event_kind, min(event_seq) event_seq

    FROM plsql_trace_events trace_data

    WHERE runid = :TRACE_RUNID

      AND event_kind NOT IN (50, 54)

    GROUP BY  event_unit, event_proc_name, event_line,

           proc_unit, proc_name, event_unit_kind,

           event_kind) pse

  ON (pse.event_unit = prof_data.unit_name

  AND pse.event_line = prof_data.line#)

JOIN user_source us

  ON (us.name = pse.event_unit

  AND us.type = pse.event_unit_kind

  AND us.line = pse.event_line)

ORDER BY event_seq;


EVENT_UNIT         EVENT_PROC_NAME          LINE    TIME PROC_UNIT

------------------ ----------------------- ----- ------- -----------------

PROC_NAME               SOURCE_TEXT

----------------------- ------------------------------

EMPLOYEE_API       CREATE_EMPLOYEE             3   12933

                        FUNCTION create_employee(


                                              20    2984

                        v_exception BOOLEAN := FALSE;


                                              21    3979

                        v_exception_message CHAR(2048)


                                              24  247720

                        v_department_id := departments


                                              24  247720 DEPARTMENTS_API
DEPARTMENT_EXISTS       v_department_id := departments


DEPARTMENTS_API    DEPARTMENT_EXISTS           3    7958

                        FUNCTION department_exists(


                                               9  185044

                        SELECT department_id


                                              14    1989

                        RETURN v_department_id;


EMPLOYEE_API       CREATE_EMPLOYEE            24  247720

                        v_department_id := departments

.

.

.

38 rows selected.
It was fairly difficult to format this output to fit the page, but hopefully you can see what is going on. The output starts at EMPLOYEE_API.CREATE_EMPLOYEE on line 3 of the package body. The time for that line is 12,933 and the actual code that is being executed (at least the first 30 bytes of it) is FUNCTION create_employee.
The second row of output corresponds to line 20 of the package body and is an assignment that had an elapsed time of 2,984. You can compare the code in this output to the actual source and see that line 20 is the first executable line. Everything before it was parameters and declarations. The assignment (while being declared) makes it an executable line. Line 20 is followed by 21, which is another assignment.
Finally, at line 24, an assignment is made by making a call to DEPARTMENTS_API.DEPARTMENT_EXISTS. That moves the EVENT_UNIT from EMPLOYEE_API to DEPARTMENTS_API. The next few lines are the executable lines in that program unit until it hits the return at line 14 (of the DEPARTMENTS_API package body). The last line displayed returns control to EMPLOYEE_API. The rest of the lines were suppressed to save space.
In a single report/query, you have a code coverage report, a code analysis report (by including executable code, line number, timing, and the actual source code), and performance metrics. If this report is saved to a table (your own user-created table), you can rerun this query after any changes to the code and compare output. You just need to be careful how you compare individual lines as they will change over time.
Unexecuted Code
It would be nice if there were an easy way to select all of the executable code that was not executed. PL/Scope does some of the information that you need but the way DBMS_TRACE executes a query (it captures the line with the select but not any of the other lines) presents some issues. Also, PL/Scope doesn't capture all potential executable lines, only lines with identifiers. If you look at the demo procedure TEST_PLSCOPE that follows, you'll see that the PROCEDURE has two executable lines (ignoring the declaration and definition of the procedure): the IF 1=1 and the “execute immediate.”
CREATE OR REPLACE PROCEDURE TEST_PLSCOPE AS

BEGIN

  IF 1=1

  THEN

    execute immediate 'declare v1 number; begin select 1 into v1 from dual; end;';

  END IF;

END TEST_PLSCOPE;
As the next query shows, if you query USER_IDENTIFIERS, you only see the declaration and definition:
  SELECT object_name, line, usage

  FROM user_identifiers

  WHERE object_name = 'TEST_PLSCOPE'

    AND object_type = 'PROCEDURE'

ORDER BY usage_id;


OBJECT_NAME                    LINE                   USAGE

------------------------------ ---------------------- -----------

TEST_PLSCOPE                   1                      DECLARATION

TEST_PLSCOPE                   1                      DEFINITION
Right now, you can automate the code coverage gathering what was executed but you can't automate the gathering of what was not executed. About the closest you can get is an automated report that can then be picked over by human eyes. Such a report is better than nothing but not quite as sophisticated as I would like it to be.
The following query attempts to make the code coverage from the preceding query more robust by using USER_IDENITIFERS to retrieve all executable rows that are not included in the DBMS_TRACE run:
SELECT id_data.object_name, id_data.line, us.text

  FROM (

    SELECT DISTINCT object_type, object_name, line

      FROM user_identifiers ui

      WHERE (object_type, object_name) IN

            (SELECT distinct event_unit_kind, event_unit

               FROM plsql_trace_events pse

               WHERE pse.event_unit = ui.object_name

                 AND pse.event_unit_kind = ui.object_type

                 AND pse.runid = :TRACE_RUNID

                 AND pse.event_kind NOT IN (50, 54))

                 AND usage NOT IN ('DEFINITION', 'DECLARATION')

    MINUS

    SELECT event_unit_kind, event_unit, event_line

      FROM plsql_trace_events pse

      WHERE pse.runid = :TRACE_RUNID

        AND pse.event_kind NOT IN (50, 54)

        AND event_line IS NOT NULL) id_data

  JOIN user_source us

    ON (us.name = id_data.object_name

    AND us.type = id_data.object_type

    AND us.line = id_data.line)

  ORDER BY id_data.object_name, id_data.line;
In this part of the results (the following output is from the middle of the output), you can see what I would like to be the output from the PL/Scope data:
OBJECT_NAME                      LINE TEXT

------------------------------- ----- ------------------------------

DEPARTMENTS_API                    42       WHEN NO_DATA_FOUND

DEPARTMENTS_API                    44         RETURN v_manager_id;

EMPLOYEE_API                       27       v_exception := TRUE;

EMPLOYEE_API                       28       v_exception_message := v

                                      _exception_message || chr(10)

                                      ||


EMPLOYEE_API                       29                  'Department '

                                       || p_department_name || ' not

                                       found.';


EMPLOYEE_API                       35       v_exception := TRUE;

EMPLOYEE_API                       36       v_exception_message := v

                                      _exception_message || chr(10)

                                      ||
Unfortunately, the result set starts with an example that I would like to filter out.
OBJECT_NAME                      LINE TEXT

------------------------------- ----- ------------------------------

DEPARTMENTS_API                    10       INTO v_department_id

DEPARTMENTS_API                    12       WHERE upper(department_n

                                      ame) = upper(p_department_name

                                      );
These lines were executed as part of the select that started on line 9. PL/Scope includes lines 10 and 12 because they contain identifiers: v_department_id and p_department_name. Line 11 is the FROM clause that does not contain any identifiers.
All the other lines shown in the preceding example really were not executed. They are embedded in exception code, which is exactly the type of thing you want code coverage to show. Ideally, you would see that those lines were not executed and create tests that would exercise that code.
DBMS_HPROF
DBMS_HPROF is the Oracle 11g and up answer to PL/SQL code profiling. This is definitely the preferred tool for gathering performance metrics. It provides everything DBMS_PROFILER and DBMS_TRACE together provide, minus the line information for code coverage; it's easier to use, easier to read, and doesn't require changes to the environment to work. DBMS_HPROF can easily be run in a production environment, which is something lacking in DBMS_PROFILER and DBMS_TRACE.
DBMS_HPROF is a hierarchical profiler. DBMS_HPROF gives you not only what ran and how long it ran, it gives you the hierarchical context of who called what and in what order. You can also compare time spent in SQL vs. PL/SQL (critical for performance tuning). When combined with proper code instrumentation, you will be able to verify complete code coverage.
When a profiling session is run, the PL/SQL virtual machine keeps track of runtime information. DBMS_HPROF makes that information available to interested parties by writing the information to an operating system file. The output from a profiling session is called the raw output.
The raw output is human readable but not very friendly. With the raw output, you can take two directions. There is a command line tool called plshprof that takes in raw DBMS_HPROF output files and generates HTML reports that contain all kinds of goodness related to performance. With that tool, you can even compare the output of two profiling sessions (for example, before and after a code change) to see how the change has impacted the performance profile of the code. (Chapter 13 specifically covers instrumentation and profiling for performance so I will leave the details to that chapter.) I would rather discuss using the analyzed data for you to write your own reports.
The second path to take with the raw output is a function in the DBMS_HPROF package: DBMS_HPROF.ANALYZE. The ANALYZE function takes several input parameters, most importantly the directory and file name of the raw output, and returns a RUN_ID. When ANALYZE is run, three tables are populated and RUN_ID is the primary key of the parent table.
The three tables that get populated contain information about the profiling session, the information about the run, and the relationship between program calls within the run session. With this information (ignoring the performance information for now), you can find exactly what was called and by whom. What you do not get is what was not called. When combined with PL/Scope, you can find what was not called—this is the value that profiling adds to code coverage.
Configuring DBMS_HPROF
Configuring DBMS_HPROF requires only a couple of very simple steps. The first is that you need execute on the DBMS_HPROF package. The second is that you need read/write access to an OS directory. If you have permissions to create directories, you can create your own. If not, ask you DBA to create one and give you READ and WRITE.
For the purpose of this discussion, I will be logged in as SYSTEM. The following DDL has to be executed before the examples will work:
CREATE DIRECTORY plshprof_dir AS 'c:	emp';

GRANT READ, WRITE ON DIRECTORY PLSHPROF_DIR TO HR;
For performance tuning, this access to the directory is all that you need. Run the plshprof, available in $ORACLE_HOME/bin) utility to generate your HTML reports and start your analysis. I generally copy the HTML output locally and review it in my browser.
However, for the purpose of understanding the code and automating analysis, I want that raw output in the database so that I can query it. Oracle provides that with three tables (described in more detail later). To create these tables, you need to run a script supplied by Oracle and available in $ORACLE_HOME/RDBMS/ADMIN, dbmshptab.sql.
Like the script for DBMS_PROFILER, you can run this script as an application user or you can create a common PROFILER schema. I generally lean towards having a dedicated user that will contain all of the profiling data for a database; this way you will have cross schema profiling sessions stored together for easy querying and you can create the same schema on all of your databases. This allows you to keep consistency across instances, which enhances the maintainability of your code.
That's all that's required to configure the DBMS_HPROF profiler.
DBMS_HPROF Example Session
When running the profiler, it's much like using DBMS_TRACE or DBMS_PROFILER. A profiling session is started with START_PROFILING and the session is ended with STOP_PROFILING. The following session will use the exact same call to create_employee:
DECLARE

  v_employee_id employees.employee_id%TYPE;

  v_runid dbmshp_runs.runid%TYPE;

  v_plshprof_dir all_directories.directory_name%TYPE := 'PLSHPROF_DIR';

  v_plshprof_file VARCHAR2(30) := 'create_employee.raw';

BEGIN

  -- Start the profiling session

  dbms_hprof.start_profiling(v_plshprof_dir, v_plshprof_file);


  -- call the top level procedure to be profiled

  v_employee_id := employee_api.create_employee(

        p_first_name => 'Lewis',

        p_last_name => 'Cunningham2',

        p_email => '[email protected]',

        p_phone_number => '888-555-1212',

        p_job_title => 'Programmer',

        p_department_name => 'IT',

        p_salary => 99999.99,

        p_commission_pct => 0 );


  -- Stop the profiling session

  dbms_hprof.stop_profiling;


  -- Analyze the raw output and create the table data

  v_runid := dbms_hprof.analyze(v_plshprof_dir, v_plshprof_file);


  DBMS_OUTPUT.PUT_LINE('This Run: ' || to_char(v_runid) );


END;
The DBMS_HPROF.ANALYZE returns a RUNID to identify a particular run. If, however, you need to come back at some later point in time, the DBMS_HPROF.START_PROFILING procedure takes an optional COMMENT parameter, which is the easiest way to identify a particular ANALYZED run.
DBMS_HPROF Output
DBMS_HPROF tracks all kinds of PL/SQL calls including triggers and anonymous blocks, as well as DML and native dynamic SQL. It is truly a powerful profiling tool. DBMS_HPROF.analyze writes to three tables.
- DBMSRP_RUNS: Run header info.
- DBMSHP_FUNCTION_INFO: Stored program details and timings.
- DBMSHP_PARENT_CHILD_INFO: The hierarchy of calls with timing.
These tables store all of the information you need to generate complete trace reports with timing at whatever level of detail you want to see them. As a side note, SQL Developer (the free GUI IDE from Oracle) supports DBMS_HPROF out of the box.
The HTML reports generated by the plshprof command line utility are very powerful tools in your performance arsenal. It would be silly for me to duplicate them with a bunch of screen shots; however, I do want to make you aware of the information available in these reports.
When you run plshprof, it produces a set of related HTML files. You navigate between the various reports and can drill down from the top level to more detailed level reports. Figure 7-1 shows the index page produced by plshprof.
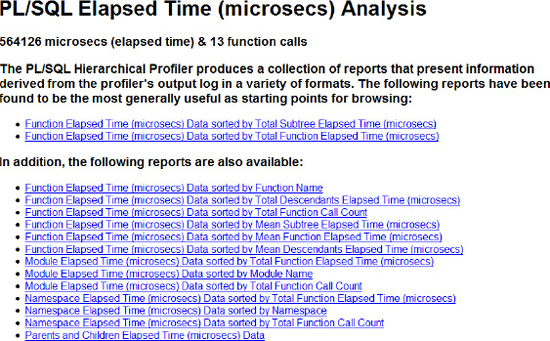
Figure 7-1. PLSHPROF Output—Report Index
From here, a click on the first link, Function Elapsed Time, brings up the page in Figure 7-2.

Figure 7-2. PLSHPROF Elapsed Time Report
The report in Figure 7-2 shows the overall time of the process sorted by the amount of time taken in each call. This report is a quick sanity check for where the time in a process is spent. The call with the most time, not coincidentally, is the top level CREATE_EMPLOYEE. From this report, I can click on one of the function calls and drill down to a detail report of that specific call, as shown in Figure 7-3.

Figure 7-3. PLSHPROF Function Drilldown
You can see in Figure 7-3 that the procedures shown all made static SQL calls and how much time was spent in SQL versus PL/SQL. Generally, I would rather run my own queries to get concise information on my runs to give me a snapshot of my performance. If something in my homegrown queries stands out, then I can run the HTML reports and dig in a little deeper.
The following query is a fairly simple report of who called who and how long it is taking. I will usually compare this data with the data from a previous run; in that way I can get a very quick look at how the changes have impacted performance.
SELECT parent_info.owner || '.' || parent_info.module || '.' ||

                   parent_info.function || '(' || parent_info.line# || ')' caller,

       child_info.owner || '.' || child_info.module || '.' ||

                   child_info.function || '(' || child_info.line# || ')' callee,

       child_info.function_elapsed_time elapsed

  FROM dbmshp_parent_child_info dpci

  JOIN dbmshp_function_info parent_info

    ON parent_info.runid = dpci.runid

  JOIN dbmshp_function_info child_info

    ON child_info.runid = dpci.runid

  WHERE dpci.runid = :HPROF_RUNID

  START WITH dpci.runid = :HPROF_RUNID

    AND dpci.childsymid = child_info.symbolid

    AND dpci.parentsymid = parent_info.symbolid

    AND parent_info.symbolid =1

  CONNECT BY dpci.runid = PRIOR dpci.runid

    AND dpci.childsymid = child_info.symbolid

    AND dpci.parentsymid = parent_info.symbolid

    AND prior dpci.childsymid = dpci.parentsymid;


CALLER                                   CALLEE                                      ELAPSED

---------------------------------------- ---------------------------------------- ----------

..__anonymous_block(0)                   HR.EMPLOYEE_API.CREATE_EMPLOYEE(3)              189

HR.EMPLOYEE_API.CREATE_EMPLOYEE(3)       HR.DEPARTMENTS_API.DEPARTMENT_EXISTS(3)          57

HR.DEPARTMENTS_API.DEPARTMENT_EXISTS(3)  HR.DEPARTMENTS_API.__static_sql_exec_lin        473

                                         e9(9)


HR.EMPLOYEE_API.CREATE_EMPLOYEE(3)       HR.DEPARTMENTS_API.DEPARTMENT_MANAGER_ID         24

                                         (29)


HR.DEPARTMENTS_API.DEPARTMENT_MANAGER_ID HR.DEPARTMENTS_API.__static_sql_exec_lin         99

(29)                                     e35(35)


HR.EMPLOYEE_API.CREATE_EMPLOYEE(3)       HR.EMPLOYEE_API.ASSIGN_SALARY(74)                51

HR.EMPLOYEE_API.ASSIGN_SALARY(74)        HR.EMPLOYEE_API.__static_sql_exec_line80       2634

                                         (80)

.

.

.
The anonymous block called CREATE_EMPLOYEE, CREATE_EMPLOYEE called DEPARTMENT_EXISTS, etc. The elapsed time is the rightmost column; it is the function elapsed time. In your own reports you can include any of the other columns that are important to you. There is a subtree elapsed time that is also useful. The function time elapsed is just the time spent in the function; subtree elapsed includes the time spent in descendants. The CALLS column contains the number of calls to a subprogram (useful in repeated calls and loops).
You can write your own queries against these tables and return the performance information you require. I would also highly recommend running the HTML reports and browsing through them. They contain some incredibly useful information, as shown in the previous screenshots.
Summary
This chapter explained how to best understand the code that you are responsible for. It explained the different types of code analysis available natively from Oracle and showed how to use those tools in your daily development. You should now understand the benefits of both static code analysis and dynamic code analysis. You should also be able to sit down to configure these tools, use them, and understand the output.
I reviewed the data dictionary views that are most important for static analysis and showed how they compare to the PL/Scope utility provided by Oracle in 11g. The chapter then moved onto dynamic analysis and the type of data available to you from those tools.
One of the beauties of implementing the suggestions in this chapter is that there is nothing here that you should not already be doing—this chapter just shows you how to it all more efficiently and how to avoid human errors. You should already have standards; you should already be doing code reviews; you should be intelligently instrumenting your code and profiling that code, before production, so that you know that when you get to production it will run reliably and be maintainable.
The effort to make the best use of these tools in your environment is a onetime expense that you put out up front and then benefit from on every project going forward. Before creating your own reports and tools based on the information in this chapter, I suggest you either create or firm up your coding and testing standards. You will get much more value from these tools, as well as the ability to automate more of your reviews and tests, if everyone is using the same standards when developing their PL/SQL.
You don't have to use the tools provided by Oracle. There are third party tools that will provide much of this functionality, most probably using the items discussed in the chapter. The important thing is that you decide to incorporate impact analysis and other code analysis into your workflow for better quality applications.
Also, don't feel like you are “stuck” with the out-of-the-box functionality. Create your own tables for querying and use things like PL/Scope as a starting point. Massage the data until you get what you feel is valuable. Don't take what is presented in this chapter as the end point. It is meant as the starting point.
After having read this chapter, I hope you “get” why source code analysis is useful. I also sincerely hope that you are not thinking that code reviews and profiling are not worth the work. If you do think this, I only ask you to please read the rest of this book (especially Chapter 13) and think about it.
Anything new can seem complex and intrusive to your normal routine. If you have never participated in a code review, it is frightening the first time. Once you start getting the benefits of fewer bugs and better code, you will get on board with the idea. The same is true of code analysis: once you've done the work of analysis the first time, it's really not very hard thereafter, and the benefits pays dividends for the life time of the program.
Don't make knowing your code an add-on to your development. Build it in. Know; don't guess.