
C H A P T E R 13
Profiling for Performance
Performance and profiling are critical words in our everyday conversations in the office where I work, in our engagements with clients, and in our teaching. Both words apply equally well to all aspects of life, including software engineering and the topic at hand, PL/SQL.
I first encountered PL/SQL at its inception in the beta release of SQL*Forms 3, Oracle's character-based interactive application development tool. Over the years, I have learned much about writing high performance PL/SQL code, and I am excited to share what I have learned with you.
What exactly does performance mean in the context of PL/SQL? By the end of this chapter, my goal is to arm you with the knowledge and understanding needed to win the battle against poorly performing code.
Amateurs practice until they get it right. Professionals practice until they can't get it wrong.
—Anonymous
In addition to my career in software development and education, I perform professionally as a classical musician on the most heroic instrument, the Horn. Experts in any field share many things in common. Music and software engineering are no exception—the more I think about it, the more I find. For example, these two fields share a common word: performance. Although at first glance it appears to have very different meanings in the two contexts, the word implies some really important things about how we go about the business of music and software development.
In music, performance is defined as an interpretation of a musical composition presented before an audience. In software development, performance is defined as the manner in which or the efficiency with which software fulfills its intended purpose. Both of these definitions explain performance as an end result. In music, as the end result of preparation includes learning the fundamental techniques of the musician's chosen instrument, learning musical notation in general, learning the specific notations of the chosen composition, practicing the specific techniques needed for that composition, and then preparing mentally and physically for the actual performance. But as a professional musician, I know that performance is not simply a single event at the end of this process.
Never practice, always perform!
—Bud Herseth, Chicago Symphony Orchestra
In other words, I realize that my performance will always sound just like my practice, and that's a scary thought unless I practice performing. In order to discover ahead of time what my performance will sound like, I need to perform the music as if my audience were right there listening as I practice. Only by practicing in this way will I be able to assess the parts of the composition on which I need to focus improvement efforts.
How does all of this relate to software performance, specifically for software performance of PL/SQL code? The real key is to be able to look at your software before you put it into production using the same perspective as people will use to see it in production. An expert's perspective requires understanding of these important concepts: performance, profiling, instrumentation, and problem diagnosis.
A MUSICAL NOTE
What Is Performance?
The word performance in the software context does have a few different meanings, so I'll begin by clarifying my use of the word. In the context of PL/SQL code specifically—and really any code in general—performance can be thought of in four ways.
Functional Requirements
Performance can sometimes be used to describe the extent to which software execution meets the so-called functional specifications and requirements defined. If the software program runs to completion without any errors, processes input accurately, and produces correct output, then one might say that the software performed well. How many times have you wished for software that you purchased for your own use to live up to that standard? It seems to be a normal expectation, of course, but it's important to see this basic part of the definition.
Response Time
Writers of requirements have learned that there's more to it than that. Performance is also about time. Software that completes the work that you expect—but completes in 34 hours when you expect completion in minutes—fails the qualitative description of “performs well.” When we describe software that performs well, we must introduce the element of time in the description. Software requirements are usually expressed in terms of a single unit of work, a business task. So the requirement must state the expected function of that task and also the expected time it should take for the software to complete that task. This is usually referred to as response time: the duration of an execution of a business task measured in units of time.
Throughput
But sometimes it makes more sense to measure performance in a different way. Throughput is the number of executions of the business task that complete within a specified duration. The software requirement for an order entry application might state a minimum throughput of 1,000 orders entered per hour. That requirement certainly implies some limits on the response time of any one specific order, but the metric makes more sense to the business manager responsible for the order entry application.
To the manager, the individual response times of each order entered are irrelevant as long as the throughput goal is met. To the order entry clerks and the customers on the phone, throughput is of no consideration. They only care about the response time of one specific order entry task, their own.
Optimizing response time is a necessary prerequisite to optimizing throughput, but not sufficient. Getting a response time of 1/1,000 second per order doesn't guarantee a throughput of 1,000 orders per second. Optimizing throughput also requires attention to queuing delay and coherency delay, but a satisfactory treatment of these is beyond the scope of this chapter. For a clear explanation, I recommend Cary Millsap's paper called “Thinking Clearly About Performance,” which can be downloaded from http://method-r.com/downloads/doc_download/44-thinking-clearly-about-performance.
Resource Utilization
Another way to consider performance is with the measurement of resources used during the execution of the software to complete the business task. Common metrics include CPU utilization, memory usage, and I/O latency. Typical diagnoses discuss these metrics only in the aggregate form—in other words, separated from the execution of a single business task. While these metrics are useful in describing system health overall, I have not found them to be useful as the starting point for performance problem diagnosis. Instead, I see these as far more useful when tightly coupled with the measurement of response time. Consider the following examples.
Nathan complains that the month-end sales report is far too slow. Last month it took only 5 minutes to complete. For this month, he started the report 15 minutes ago and it's still not finished. System monitoring shows that the CPU utilization is running at 95%. Average disk I/O latency looks great at 4 ms, and the network administrator tells us the throughput is well under capacity at 9,000 tx/s. Table 13-1 shows a summary of this information.

Matt complains that the month-end payroll report is far too slow. Last month it took only 5 minutes to complete. Of the 5 minutes, 20% was spent on the CPU, 70% was spent on disk I/O operations, and 10% was spent on network calls. For this month, he started the report 15 minutes ago and it's still not finished. Response time metrics show that of the 15 minutes, 5% was spent on CPU, 25% on I/O operations, and 70% on network calls. Table 13-2 shows a summary of this information.

I would much rather respond to Matt's situation, given the information provided. The tables are visually similar but convey completely different information. When trying to diagnose Nathan's problem with Table 13-1, I can only guess whether or not CPU utilization is a problem for the sales report, because aggregation of data hides the detail that I need. I certainly know that CPU is high for the entire system, but in order to solve the problem for the sales report, I need to know if that task is actually waiting on CPU resources in order to finish.
In Matt's example, I have valuable information about resource utilization applied to his task alone. With Table 13-2, I can know where to look, and with great confidence start investigating how and why the payroll report is spending time in the network layer.
Performance Is a Feature
You should think of performance as a feature. It's not a serendipitous result of your work; rather it's something you approach with intent as you design and deliver a product. Karen Morton really captures the importance of this concept when she says:
So, first and foremost, I think managing performance is about integrating one simple principle into your mindset: I am responsible for the performance of the code I write or maintain.
—Karen Morton, Expert Oracle Practices (Apress 2010)
Regardless of your adherence to Agile or Waterfall, XP or RAD, Prototyping or Spiral, performance should be a prominent feature at the beginning of the process, during the process, and after the process has “completed.”
Functional requirements should be accompanied by performance expectations, and in some business cases those expectations are formal requirements expressed as a Service Level Agreement (SLA). These expectations can't be forced onto the software after delivery. That seems like such an obvious statement, but in practice that's exactly what happens in the real world. Karen Morton's quote describes the essential mindset for every person in every role in the software development team. From the very start, performance must include the concepts of function and time.
When Matt calls and complains about the performance of the payroll report, who will he call? Probably the DBA responsible for the application. That DBA was probably never involved in the software development process. Will the software application documentation lead the DBA by the hand through the problem diagnosis? Probably not. Should it? Absolutely! Will the software itself provide adequate information to point the DBA to the probable cause? Probably not. Should it? Of course! Why is it that performance problems are considered a defect in production implementations but not during development and testing?
Whatever the reasons, the DBAs or performance analysts end up with the problem to solve. Their ability to resolve the problem will depend on the quality of information they can gather about the problem. If Matt complains, that “the whole system is slow” without identifying a specific problem, solving Matt's problem can be agonizing. System-wide aggregated, usually sampled, data may or may not surface the problems that are affecting Matt's report. Analysts can spend endless time and money chasing the wrong problems if they depend solely on aggregated data. They may improve some parts of the system, but they aren't really finished until they fix the root problem that is causing Matt's slow report.
That's not meant to imply that good DBAs and performance analysts don't solve problems like Matt's all the time—of course they do. They ask good questions that lead to resolutions of the problems, such as the following:
- What exactly were you doing while the system was slow?
- Which business task will you execute immediately after I tell you that the system is no longer slow, in order to test my assertion?
Performance analysts use various tools for measuring the critical details—where the time was spent and on what resources during the execution of that business task. So how should you write code that actually helps performance analysts—code that provides performance information beyond the functional requirements?
What Is Profiling?
Profiling is emitting a log of code steps as they execute. In some cases, profiling is done without emphasis on time, but focused more on the sequence of events and the number of iterations. In other cases, each code step is logged with an elapsed time measurement.
Profiling is a common activity, even a daily practice, for many software developers. Profiling is a great way to know your code during development. Chapter 7 describes how to profile PL/SQL code with Oracle provided packages. You might recognize these profilers from other software languages:
gcc –pg …; gprof …


java –prof …; java ProfilerViewer …


perl –d:Dprof …; dprofpp …
Each of these tools displays the results of profiling in different ways. In able to more clearly describe profiling results that work best, specifically for performance, I'll start with a quick explanation of a tool that can help developers understand the passage of time more clearly: the sequence diagram.
Sequence Diagrams
As part of the Unified Modeling Language (UML), sequence diagrams are used primarily to show the interactions between objects in the sequential order that those interactions occur. In software architecture, the objects are usually defined as application tiers like the database, web server, or browser.
In software development, the objects are sometimes defined as layers in the application code, high level procedures calling successively lower level procedures. In the lowest layers, these procedures typically represent calls to basic system resources.
A sequence diagram is most valuable for performance optimization when the element of time is introduced. Seeing a visual representation of each tier or layer where your response time is consumed, with each interaction scaled in proportion to the duration of time elapsed, allows you to focus your attention on the areas of code where the most performance gains can be achieved.
Diagrams work wonderfully for high level understanding of processes, but as more and more objects and interactions are added to the diagram, the details crowd the picture so much that the overall value is lost. When I get lost in details, I find it most helpful to summarize or aggregate the data to find the information I need.
The Magic of Profiles
A profile is a tabular representation of a sequence diagram. It is a decomposition of response time, typically listed in descending order of component response time contribution. A receipt from the grocery store is a similar decomposition (although usually not ordered by cost), providing the total amount paid at the bottom and a list of the cost for each of the individual items purchased. Table 13-3 shows a profile of a task that consumed 60 seconds of time, decomposed into the component functions of the task.
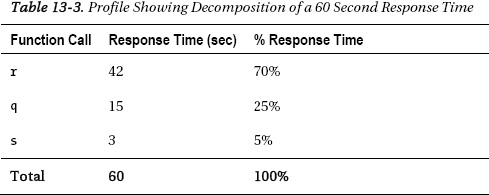
A profile can be aggregated so that all calls to the same function are reported in one row. Adding a column in the table showing the number of times each function was called is sometimes helpful, especially of you would like to know the average response time for each call.
The magic happens when you see exactly where your slow task spent the 60 seconds. You now know that 70% of your task's response time is consumed by function r calls. Just as helpful, you know where your task is not spending time.
Benefits of Profiling
There are many benefits to profiling your code in this way. The real key is the visibility provided by the unique format of the profile. The benefits include the following:
- You know where your code is spending its time. Without accurate measurement of response time, you can only guess.
- You optimize only relevant code path. The profile focuses your attention on the top contributors to response time. Without that information, you succumb to Compulsive Tuning Disorder (CTD), tuning everything you can and never knowing when enough is enough. Gaja Krishna Vaidyanatha defines and describes CTD in Chapter 7 of Oracle Insights: Tales of the Oak Table (Apress 2004).
- You focus your learning on the topics that matter to you right now. If your response time is completely dominated by
latch: cache buffers chainscalls, then today's your lucky day: you'll need to study only one of the more than 1,000 types of calls that are instrumented within the Oracle Database. - You can stop optimizing when your objective is achieved. With the profile, you know the possible improvement for each component of the business task. You make economic decisions about improvement with real data to prove your assertions.
- You can predict what impact your remedies will have, quantitatively. Then you can verify the results directly in the same units of measure as you predicted. Profiles act then as both the tool for optimization and the proof of benefits gained.
Using profiles in these ways simply make you a better software developer. In order to take full responsibility for the performance of your code, you must make a habit of profiling.
Instrumentation
As a musician and a software developer, of course, the term instrumentation also has multiple meanings to me. When I'm thinking about music, instrumentation is defined as the number and types of different instruments to be used in a particular musical composition or arrangement. The composer specifies the number of different instruments required and a minimum number of players required for each instrument, notated as separate parts. The conductor and performers of the composition make the final decision on how many players will perform each part, guided by both desired musical effect and availability of the correct number of musicians.
When I'm thinking about software, instrumentation takes on a different meaning. If a profile is built by aggregating sequential measurements, where do the measurements come from? Instrumentation is the part of your code that provides those measurements. Like musical instrumentation, the type and amount of measurements provided by your code contribute to the overall performance of your software.
Consider the circumstance that typically leads to the topic of instrumentation. When something goes wrong and the performance of a program is not acceptable, the magic question arises: “Why is this program slow?”
Why is This Program Slow?
Moving from theory to practice, let's examine program p. Why is program p slow?
SQL> exec p

PL/SQL procedure successfully completed.

SQL>
Obviously, I'm missing a crucial element. Without more information, I can only guess about why program p is slow. Around the office, I have heard countless times what could be described as our corporate mantra.
Why guess when you can know?
—Cary Millsap
Of course I can know—I just need to measure. “Slow” is measured in units of time, so I need to measure the elapsed time of program p.
SQL> set timing on

SQL> exec p

PL/SQL procedure successfully completed.

Elapsed 00:03:07.42

SQL>
Now I know that program p executed in 3 minutes, 7.42 seconds. That's a good start, but in order to have any idea about what parts of the code in program p I need to improve, I need to measure all of the parts of the code in detail. (That's Step 2 in Method R, which I'll describe in detail later). The detailed measurements are best presented in a profile. How then do I get the right measurements to create a profile? I need instrumentation. Instrumentation is what you add to the code to make generation of a profile possible.
First, here's what the code looks like now:
CREATE OR REPLACE PROCEDURE p AS

BEGIN

  q;

  r;

  s;

END;
Now I add the instrumentation.
CREATE OR REPLACE PROCEDURE p AS

  t0 NUMBER;

  t1 NUMBER;

  t2 NUMBER;

  t3 NUMBER;

BEGIN

  t0 := DBMS_UTILITY.GET_TIME;

  q;

  t1 := DBMS_UTILITY.GET_TIME;

  DBMS_OUTPUT.PUT_LINE ('Procedure q: ' || (t1 - t0)/100 || ' seconds'),

  r;

  t2 := DBMS_UTILITY.GET_TIME;

  DBMS_OUTPUT.PUT_LINE ('Procedure r: ' || (t2 - t1)/100 || ' seconds'),

  s;

  t3 := DBMS_UTILITY.GET_TIME;

  DBMS_OUTPUT.PUT_LINE ('Procedure s: ' || (t3 - t2)/100 || ' seconds'),

  DBMS_OUTPUT.PUT_LINE ('Total Elapsed: ' || (t3 - t0)/100 || ' seconds'),

END;
Here are the results after execution of this instrumented code:
SQL> set timing on serveroutput on

SQL> exec p

Procedure q: 1.05 seconds

Procedure r: 172.59 seconds

Procedure s: 14.11 seconds

Total Elapsed: 187.75 seconds

Elapsed 00:03:07.75

SQL>
I now know something very important that I could never have known without instrumentation of some kind. The results provide a profile, an invoice of where my time was spent in the code. I admit that the instrumentation shown here is clunky, and I wouldn't recommend calling such code “finished,” but even instrumentation as clunky as this is powerful. I'll discuss improvements to the instrumentation method in the next section.
Now I know that spending my time optimizing procedure q will gain very little benefit—no more than 1.05 seconds (0.56%) of 187.75 seconds total. Likewise, optimizing procedure s will gain no more than 14.11 seconds (7.52%). The majority of my time was spent in procedure r, so that's where I should spend my optimization time and effort. What if I had decided to start working on procedure q or s? I may have been able to improve the individual response times of those procedures drastically, but if my objective had been to reduce the overall response time by 1 minute, my efforts would have been unsuccessful. Why guess? You can know where to focus your attention.
Instrumentation makes your code faster, easier to maintain, and cheaper to write. Instrumentation makes your code faster because it shows you all of your opportunities for making your code more efficient, both while you're writing it and after you're done. Instrumentation makes your code easier to maintain because it shows you exactly what your analysts are talking about when they say that your code is too slow. Instrumentation makes your code cheaper to write because it focuses your tuning efforts only upon the parts of your code where performance really matters. Good instrumentation is your proof that the performance requirements for your code have been met.
Measurement Intrusion
Notice in my short example that the elapsed time after adding instrumentation was 3:07.75 seconds, 0.33 seconds longer than the original 3:07.42 seconds. Imagine that those measurements had been computed as an average over the course of a thousand executions. Instrumentation is code, and all code contributes to the overall response time of a unit of work. Smart developers know that removing extraneous and unnecessary code is critical to performance optimization.
So should you consider this instrumentation code extraneous and unnecessary? Absolutely not! Code must not only fulfill the requirements of the task but also perform well throughout the life of the software.
Tom Kyte, the “Tom” behind http://asktom.oracle.com/, was once asked at a conference how much the measurement intrusion effect was for all of the instrumentation built into the Oracle database (the data published through the various V$ and X$ fixed views, the extended SQL trace data, and so on). He paused thoughtfully and then responded confidently that the measurement intrusion amounted to negative ten percent or possibly less. He went on to explain that without the instrumentation coded in the Oracle Database kernel, the developers in Oracle Server Technologies would have been unable to optimize their code effectively. As a direct result of having the level of detail their instrumentation provides, the developers are able to improve the performance of the code in every release.
Identification
In addition to code that provides response time values for individual program units, instrumentation can also be used to identify application code in the database. The ability to associate resources consumed in the database directly with specific business tasks is a critical component of performance optimization. Oracle provides many different ways to accomplish this goal.
DBMS_SESSION.SET_IDENTIFIER
DBMS_SESSION.SET_IDENTIFIER should be used to make performance analysis easier at runtime. Using this command lets the instance know which end user is associated with each session. Oracle introduced this “End to End Application Tracing” feature in version 10. For example, if your application authenticates users at the database level with unique accounts, you could set the identifier to the user name and IP address in a logon trigger.
CREATE OR REPLACE TRIGGER LOGON_TRIGGER

AFTER LOGON ON DATABASE

DECLARE

  l_identifier VARCHAR2(64);
BEGIN
L_identifier := SYS_CONTEXT('USERENV', 'OS_USER') || ':' ||
SYS_CONTEXT('USERENV', 'IP_ADDRESS'),
DBMS_SESSION.SET_IDENTIFIER(l_identifier);
END;
The end user identifying information is now visible in the column V$SESSION.CLIENT_IDENTIFIER, in dozens of other views, and in any extended SQL trace files generated for that session. To enable tracing for a known end user identifier, call the Oracle built-in procedure, like so:
DBMS_MONITOR.CLIENT_ID_TRACE_ENABLE(client_id=>'HR:Claire:425542',

                                    waits=>TRUE,

                                    binds => TRUE,

                                    plan_stat => 'ALL_EXECUTIONS'     -- 11g and later

                                    );
The trace file will contain a line formatted like
*** CLIENT ID:(HR:Claire:425542) 2011-03-16 01:59:13.317
If your application shares sessions among end users, then this information needs to be set from the application layer instead of the database. Instead of IP address, use an application level session ID or user name. The key is to use the information necessary to identify the end user responsible for the work being done in the database session.
Enabling tracing for the end user identifier will now output data to multiple trace files, since your application is sharing sessions. The Oracle utility trcsess can be used to consolidate information from multiple trace files containing the same CLIENT ID. For example:
trcsess output=425542.trc clientid=HR:Claire:425542 *.trc
![]() Caution Don't confuse V$SESSION.CLIENT_IDENTIFIER with V$SESSION.CLIENT_INFO, which is set using the DBMS_APPLICATION_INFO.SET_CLIENT_INFO procedure. Although DBMS_MONITOR has procedures for enabling and disabling extended SQL tracing based on MODULE and ACTION set from DBMS_APPLICATION_INFO, the CLIENT_INFO column has no counterpart in DBMS_MONITOR.
Caution Don't confuse V$SESSION.CLIENT_IDENTIFIER with V$SESSION.CLIENT_INFO, which is set using the DBMS_APPLICATION_INFO.SET_CLIENT_INFO procedure. Although DBMS_MONITOR has procedures for enabling and disabling extended SQL tracing based on MODULE and ACTION set from DBMS_APPLICATION_INFO, the CLIENT_INFO column has no counterpart in DBMS_MONITOR.
DBMS_APPLICATION_INFO.SET_SESSION_LONGOPS
If you have a task that you know in advance will be long-running, identify the task with DBMS_APPLICATION_INFO.SET_SESSION_LONGOPS. This procedure populates a row in the V$SESSION_LONGOPS view that can be used to monitor the progress of your long-running task. The procedure parameters loosely correspond to columns in the view, so visibility of application-specific details is easily achieved, and in an extremely lightweight way.
Note that Oracle automatically populates this view during tasks like statistics gathering, parallel query execution, and Server Managed Recovery, so your data will be interspersed with that data. The following code shows an example of using this procedure:
DECLARE

  l_rindex      BINARY_INTEGER;

  l_slno        BINARY_INTEGER; -- Oracle internal use

  l_op_name     VARCHAR2(64)    := 'Month end posting';

  l_target      BINARY_INTEGER; -- Object ID being worked on

  l_target_desc VARCHAR2(32);   -- Description of target

  l_context     BINARY_INTEGER; -- A number relevant to task, amount processed, etc.

  l_sofar       NUMBER(6,2);    -- The amount of work done so far

  l_totalwork   NUMBER := 100;  -- An estimate of the amount of work to be done

  l_units       VARCHAR2(32)    := 'records';

BEGIN

  -- rindex is used to identify the row in V$SESSION_LONGOPS

  -- the _nohint call will create a new row and rindex for us to use

  l_rindex := DBMS_APPLICATION_INFO.SET_SESSION_LONGOPS_NOHINT;


  FOR i IN 1 .. l_totalwork LOOP


    -- In practice, this would be a more complex calculation.

    -- This simple example assumes uniform processing time for each sub task

    l_sofar := i;


    DBMS_APPLICATION_INFO.SET_SESSION_LONGOPS(rindex      => l_rindex,

                                              slno        => l_slno,

                                              op_name     => l_op_name,

                                              target      => l_target,

                                              target_desc => l_target_desc,

                                              context     => l_context,

                                              sofar       => l_sofar,

                                              totalwork   => l_totalwork,

                                              units       => l_units);


    -- processing occurs here


    COMMIT;

  END LOOP;

END;

/
![]() Tip Oracle doesn't currently provide a procedure for removing the row in V$SESSION_LONGOPS. This view represents data from one of Oracle's fixed-size underlying tables, so rows aren't really deleted anyway. New rows replace older rows after the maximum number of rows is reached. For rows inserted by Oracle features like statistics gathering, the TIME_REMAINING column will be set to 0 when the operation completes. For your own data, ensure that you set SOFAR and TOTALWORK to the same value when your task is complete, since the TIME_REMAINING column is not accessible through the procedure.
Tip Oracle doesn't currently provide a procedure for removing the row in V$SESSION_LONGOPS. This view represents data from one of Oracle's fixed-size underlying tables, so rows aren't really deleted anyway. New rows replace older rows after the maximum number of rows is reached. For rows inserted by Oracle features like statistics gathering, the TIME_REMAINING column will be set to 0 when the operation completes. For your own data, ensure that you set SOFAR and TOTALWORK to the same value when your task is complete, since the TIME_REMAINING column is not accessible through the procedure.
DBMS_APPLICATION_INFO.SET_MODULE
While the DBMS_APPLICATION_INFO.SET_SESSION_LONG_OPS procedure is intended specifically for the identification of long running tasks, Oracle does provide a lightweight method for identifying all of your application tasks currently executing in the database. The values of module and action are visible in V$SESSION and in many of the dynamic performance views. DBMS_MONITOR.SERV_MOD_ACT_STAT_ENABLE can be used to see real-time statistics for any module and action in the view V$SERV_MOD_ACT_STATS.
Setting the values of module and action correctly is absolutely the best way to correlate performance statistics in the database with your business tasks. For example:
CREATE OR REPLACE PROCEDURE p AS

BEGIN

  DBMS_APPLICATION_INFO.SET_MODULE(module_name => 'Month End Posting',

                                   action_name => 'p'),

  q;

  r;

  s;

  DBMS_APPLICATION_INFO.SET_MODULE(module_name => NULL,

                                   action_name => NULL);

END;
Note that like DBMS_SESSION.SET_IDENTIFIER, Oracle provides (in 10g and later) the ability to turn on extended SQL tracing based on module and action values with the DBMS_MONITOR package. To enable tracing for a known module and action, call the Oracle procedure, like so:
DBMS_MONITOR.SERV_MOD_ACT_TRACE_ENABLE(service_name => 'V11202',

                                       module_name => 'Month End Posting',

                                       action_name => 'p',

                                       waits => TRUE,

                                       binds => TRUE,

                                       plan_stat => 'ALL_EXECUTIONS'     -- 11g and later

                                       );
The trace file will contain lines formatted like this:
*** SERVICE NAME:(V11202) 2011-05-13 20:26:22.919

*** MODULE NAME:(Month End Posting) 2011-05-13 20:26:22.919

*** ACTION NAME:(p) 2011-05-13 20:26:22.919
What values should be used for module and action? The module name should uniquely identify a part of your application. The action name should represent a logical unit of work that is being executed within the module. Both module and action should mimic business terminology as closely as possible.
![]() Note Oracle provides hooks into the module and action identifiers for other languages in addition to PL/SQL. In OCI, use the procedure OCIAttrSet to set the OCI_ATTR_MODULE and OCI_ATTR_ACTION values. See
Note Oracle provides hooks into the module and action identifiers for other languages in addition to PL/SQL. In OCI, use the procedure OCIAttrSet to set the OCI_ATTR_MODULE and OCI_ATTR_ACTION values. See http://download.oracle.com/docs/cd/E11882_01/appdev.112/e10646/ociaahan.htm for details.
In Java, use the JDBC method OracleConnection.setEndToEndMetrics(), provided first in Oracle 10g. See http://download.oracle.com/docs/cd/E11882_01/java.112/e16548/dmsmtrc.htm for details.
In Perl, use the DBI->connect function (in DBD::Oracle) to set attributes ora_module_name and ora_action. See http://kobesearch.cpan.org/htdocs/DBD-Oracle/DBD/Oracle.html for details.
These languages, as well as any other language with access to the database layer, can also use PL/SQL calls to set the values directly with DBMS_APPLICATION_INFO. Unlike the OCI, Java, and Perl examples, this method does incur an additional network round trip, so consider carefully before making these PL/SQL calls inside code loops.
The DBMS_APPLICATION_INFO package doesn't keep track of nested actions. When you use the SET_MODULE procedure, the former values of module and action are lost, so you're responsible for handling this problem correctly in your code. Unsetting them at the end of the procedure makes sense at the highest level of the code, but how should SET_MODULE be used in the inner procedures q, r, and s? One option is to avoid setting module and action in called procedures and only setting them in the highest level procedure. For example:
CREATE OR REPLACE PROCEDURE p AS

BEGIN

  DBMS_APPLICATION_INFO.SET_MODULE(module_name => 'Month End Posting',

                                   action_name => 'q'),

  q;

  DBMS_APPLICATION_INFO.SET_MODULE(module_name => 'Month End Posting',

                                   action_name => 'r'),

  r;

  DBMS_APPLICATION_INFO.SET_MODULE(module_name => 'Month End Posting',

                                   action_name => 's'),

  s;

  DBMS_APPLICATION_INFO.SET_MODULE(module_name => NULL,

                                   action_name => NULL);

END;
A better option is to handle the nesting by storing the prior values before calling set_module and then restoring them at completion. Instead of instrumenting only the highest level code, each called procedure should have similar code. Each exit point of the procedure will need to reset the module and action, including the exception handling section. For example:
CREATE OR REPLACE PROCEDURE p AS

  l_module VARCHAR2(48);

  l_action VARCHAR2(32);

  l_sqlcode NUMBER;

  l_sqlerrm VARCHAR2(512);

BEGIN
DBMS_APPLICATION_INFO.READ_MODULE(module_name => l_module,
action_name => l_action);
DBMS_APPLICATION_INFO.SET_MODULE(module_name => 'Month End Posting',
action_name => 'p'),
q;
r;
s;
DBMS_APPLICATION_INFO.SET_MODULE(module_name => l_module,
action_name => l_action);
EXCEPTION WHEN OTHERS THEN
l_sqlcode := SQLCODE;
l_sqlerrm := SQLERRM;
DBMS_APPLICATION_INFO.SET_MODULE(module_name => l_module,
action_name => l_action);
-- handle exceptions here
END;
I can't overstate the value of incorporating the use of DBMS_APPLICATION_INFO in your application. Keeping track of the module/action stack is troublesome, but I'll soon discuss a way to simplify that.
Conditional Compilation
Chapter 4 describes instrumenting PL/SQL code with timing information using the Conditional Compilation feature of PL/SQL. This method can be used in cases where performance analysts have control over the runtime application and the performance problems are easily reproducible.
If the problem is reproducible in a test environment, then the PL/SQL code can be recompiled with the Timing instrumentation turned on. If the production environment must be used (and let's face it, this happens all too frequently), there are ways to minimize the intrusion. Instead of recompiling the PL/SQL in the active schema, duplicate the PL/SQL in a separate schema. Then the code can be recompiled in the new schema without affecting production users.
To redirect a specific user to the newly created schema, either modify the application or create a login trigger. Then reproduce the problem. Finally, based on the data provided by the timing code, construct a profile of the response time for the problem task and amaze your friends by solving the performance problem.
Built-in Profilers
Chapter 7 encourages you to know your code with the assistance of several packages included with the Oracle database: DBMS_HPROF, DBMS_TRACE, and DBMS_PROFILER. These packages provide functionality for profiling your PL/SQL code, each with slightly different area of focus. I will only mention them quickly here, since I am really more interested in solutions that will span the entire software life cycle.
Knowing your code during development is crucial, so tools that easily profile code at the line or subprogram level are invaluable. But how easily can these tools be integrated into your application? How heavy is the measurement intrusion? Can a performance analyst easily get response time data for a specific business task without incurring the penalty of intrusion on all other business tasks?
Using these built-in packages may be just what you're looking for, but I have not found them to answer these questions well enough. Fortunately, I have found a better answer: a PL/SQL library that provides a standard for instrumenting with DBMS_APPLICATION_INFO and enabling Oracle's internal instrumentation. Before I cover the library in detail, I need to introduce this instrumentation.
Extended SQL Trace Data (Event 10046)
Oracle's kernel instrumentation, extended SQL trace data, was originally known as “pseudo error debugging event number 10046.” This instrumentation was added to Oracle's code for the optimization of database applications as well as optimization of the kernel itself. The trace files generated by this instrumentation provide exactly what developers want: a linear sequential record of how their code spends time.
The level of detail included in the trace files allows analysts an intimate view of the inner workings of a database session. Much like the built-in profilers, sometimes this level of detail can be overwhelming. Instrumentation at the right level is the real key. Oracle's tkprof aggregates the data to make some sense of the details, but in doing so, it hides important relationships. What's really needed is aggregation of the data in the format of a profile, summarizing the details in a way that focuses your attention on where the largest amounts of response time for a specific business task were spent.
Constructing profiles of slow performing business tasks is critical to successful optimization. I use the Method R Profiler software to generate a profile, identify the top contributors to response time, and resolve performance problems. Sometimes the problems are in poor SQL, sometimes in poor PL/SQL, sometimes in configuration issues, and sometimes in more complex situations. But in every case, the profile is the best place to start. Sometimes DBA staff are resistant to enabling tracing or to providing access to their development teams.
I will run trace, even if it does take an act of Congress and a letter from my doctor to get the DBAs to give me the necessary privileges.
—Frustrated Client
But getting those trace files is well worth the effort. Applications that are instrumented really well may report enough detailed timing information to resolve most issues. But in some cases, the real performance problem is hidden from the application at the database layer. In those cases, performance analysts need the correlation of instrumentation: extended SQL trace files that include details of the business tasks being executed. And better yet, smart applications should generate trace files when needed with this correlated information included.
Instrumentation Library for Oracle (ILO)
ILO, the Instrumentation Library for Oracle, is an open source project. I'm the current caretaker, but the credit for its creation belongs to Eric Evans. ILO consists of PL/SQL packages with procedures for identifying and measuring tasks using Oracle extended SQL trace and procedures for collecting and storing response time data for specific business tasks. The packages are installed and compiled in the target Oracle instance and can be called by code written in any language that has access to the Oracle database tier. ILO is fully integrated with the Method R SLA Manager, which allows you to organize and analyze response time data for your entire application system.
![]() Note ILO is open source software available at SourceForge,
Note ILO is open source software available at SourceForge, http://sourceforge.net/projects/ilo/. It requires Oracle Database version 9.2.0.1 or newer. It is released free of charge under the GNU Lesser General Public License (LGPL), http://gnu.org/copyleft/lgpl.html. SLA Manager is commercial software from Method R Corporation, http://method-r.com/software/slam.
Why Should You Use ILO?
The benefits of instrumenting code with ILO include the following:
- It's very easy for operators and analysts running ILO-instrumented applications to profile the exact duration of a specified business task. Imagine that a user complains that “adding an employee” in an HR system is too slow. With ILO instrumentation, it's trivially easy for a performance analyst to obtain exactly the Oracle-extended SQL trace data he needs to diagnose and repair the user's specific problem.
- Developers no longer need to worry about understanding when or why to use DBMS_APPLICATION_INFO or DBMS_SESSION to register parts of their applications with the Oracle database. Business tasks are now visible in
V$views identified by Module and Action. - Developers no longer need to worry about inserting lines of code into their applications to manage Oracle's “extended SQL tracing” feature (also known as 10046 tracing,
DBMS_SUPPORTtracing, orDBMS_MONITORtracing). - With ILO, your Oracle trace files will be properly time-scoped and will contain only descriptions of elapsed time that are part of your response time.
- ILO contains hooks that allow you to store response time histories for specific tasks. You'll then be able to report on performance trends or violations of service level agreements.
- ILO is real-world tested. It's lightweight and trustworthy.
How It Works
ILO is very easy to use. You mark the beginning and end of each task with a single line of code, giving each task a module and action name. Think of the action as the name of the task itself and the module as the part of the application that the task represents.
Marking the beginning of any task is as simple as making a procedure call and including the values for module, action, and comment. When marking the end of a task, you again make a simple procedure call. Be sure to include all possible exit points of the marked task including any EXCEPTION sections in your code. For example:
DECLARE

  l_sqlcode NUMBER;

  l_sqlerrm VARCHAR2(512);

BEGIN

   ilo_task.begin_task(module  => 'Load Transaction Tables',

                       action  => 'Begin overall load',

                       comment => 'Execution of procedure all_trx_table_loads'),


   ... code for your task goes here


   ilo_task.end_task;

EXCEPTION

   WHEN ex_insert_problem THEN

      l_sqlcode := SQLCODE;

      l_sqlerrm := SQLERRM;

      ilo_task.end_task(error_num => l_sqlcode);

      ... handle the exception

   WHEN others THEN

      l_sqlcode := SQLCODE;

      l_sqlerrm := SQLERRM;

      ilo_task.end_task(error_num => l_sqlcode);

      … handle the exception

END;
![]() Tip
Tip SQLCODE and SQLERRM are active at all times in the EXCEPTION section of your code. If your exception handling raises another exception, the original SQLCODE will be replaced by the new error. Note that almost any line of code can cause an exception to be raised. Before referencing these built-ins, save the contents in local variables. Your logging and instrumentation procedures should then use the local variables to document the correct error. Also note that ILO exception handling is configurable. By default, ILO procedures will suppress their own exceptions to avoid affecting production code negatively.
The enabling and disabling of extended SQL tracing should be performed at application runtime, long after the developer's involvement in the project has completed. The ilo_task.begin_task call checks to see whether someone has expressed the intent to trace a specific module/action pair by calling ilo_timer.get_config. This procedure determines which tasks should be traced, and is usually customized at each ILO installation.
A developer who wishes to unit test his code can call the special procedure ilo_timer.set_mark_all_tasks_interesting(TRUE,TRUE); to override the normal ilo_timer.get_config processing, but calls to this procedure are typically not going to be present in production code unless they are implemented as menu options (for example, Help ![]() Debug
Debug ![]() Trace All). The greatest benefit of using ILO is that the choice of tracing is a precisely controlled runtime decision. Instead of manual intervention by a DBA to turn on trace for a session, ILO provides the mechanism for expressing the intent to turn on trace from the application and task specific tracing to occur without intervention.
Trace All). The greatest benefit of using ILO is that the choice of tracing is a precisely controlled runtime decision. Instead of manual intervention by a DBA to turn on trace for a session, ILO provides the mechanism for expressing the intent to turn on trace from the application and task specific tracing to occur without intervention.
Example
A common use for PL/SQL code is in DML triggers that handle multiple code paths. In the following example, the trigger performs different actions depending on whether the originating DML was an insert or an update. Good instrumentation should not only inform you of code coverage but also help you to measure the right thing.
CREATE OR REPLACE TRIGGER insert_or_update_example

    INSTEAD OF INSERT OR UPDATE ON table_abc

DECLARE

  v_storage_value VARCHAR2(32000);

  l_sqlcode       NUMBER;

BEGIN

  IF INSERTING THEN

    ilo_task.begin_task(module => 'Table_ABC',

                        action => 'Instead of insert',

                        comment => 'Insert or Update Trigger on Table_ABC'),

    example_package.create_value

    (p_value_name     => :NEW.value_name

     ,p_value         => :NEW.value

     ,p_description   => :NEW.description

     ,p_storage_value => v_storage_value

    );

    example_package.setup_something_else

    (p_storage_value => v_storage_value

    );

  ELSIF UPDATING THEN

    example_package.update_value

    (p_value_name     => :NEW.value_name

     ,p_value         => :NEW.value

     ,p_description   => :NEW.description

     ,p_storage_value => v_storage_value

    );

  ENDIF;

  ilo_task.end_task;

EXCEPTION WHEN OTHERS THEN

  l_sqlcode := SQLCODE;

  ilo_task.end_task(error_num => l_sqlcode);

  ... handle the exception

END;
Assuming that you have already instrumented the individual program units in the example_package, you might think further instrumentation is overkill in this trigger. But if your goal for instrumentation is to provide the right performance metric for testing and for diagnosing performance problems, then this instrumentation is critical.
One of the many benefits of using ILO is that the library correctly handles nesting of module/action pairs. Imagine what would happen to the module and action if that weren't the case. The last procedure or function that sets the values gets the blame for all the time spent until the values are set again, and you lose visibility to the actual response time of that task.
Problem Diagnosis
How should you solve performance problems? When something takes too long, ask one question: “Where did my time go?” That's Method R.
Method R
“Method R” is the name that Cary Millsap and Jeff Holt unassumingly called their four-step method for diagnosing and repairing performance problems, documented in the book Optimizing Oracle Performance (O'Reilly, 2003). The “R” stands for response time, in contrast to the conventional approach, which they called “Method C.”
Method R prescribes four simple steps.
- Identify the task that's most important to you.
- Measure its response time in detail.
- Optimize that response time in the most economically efficient way.
- Repeat until your system is economically optimal.
It's the act of optimizing software like you optimize anything else in life.
Step 1: Identify
Identify the task that's the most important to you. Ask the business stakeholder of your software the following questions:
- What slowly performing business task is most negatively impacting the business?
- Which task would be nicest to fix first?
Inevitably, you will get an answer of many tasks that are all of utmost priority. Don't panic, though, this is not unexpected. Simply ask this follow-up question: “If all of these tasks are of equal priority, then can we start with task X?”
You will either get agreement or clarification. Maybe task Y really does need to be addressed first. In either case, the key is to pick one task and move on to the next step of Method R. If the entire system really is slow, and a single underlying cause exists, then addressing any slow task will quickly lead to that underlying cause. Fixing the performance problems for that task will then benefit the rest of the system as well.
If, instead, that task has a unique underlying cause, then you'll waste no time in solving the problem, since you started with a task known to be important to the business. The key to any process or method is getting started correctly. As Mary Poppins said, quoting Aristotle:
Well begun is half done.
—Aristotle
Step 2: Measure
Measure the task's response time in detail. Measurement should be the primary focus of your attention during any performance analysis activity. Accurate measurement can point clearly to the root problem. Inaccurate measurement can send you on fruitless hunts down ratholes.
When I say “response time,” I mean the response time of that top priority task from the moment the end user makes the request for the work to be done until the moment the end user receives the information requested or notification of completed processing. Getting those measurements is sometimes difficult but always worth the trouble.
When I say “in detail,” I mean in the form of a profile. Know where every moment of the response time was spent and focus on the largest consumers of time. The profile can detail program code units or resource utilization, but the total at the bottom must be 100% of the response time you measured. If not, you need to measure again, more accurately, or you need to reconsider how you are building the profile.
Software performance analysis is often portrayed as art rather than science, but I disagree with that portrayal. Good performance analysis is all about measurement.
There are two possible outcomes: if the result confirms the hypothesis, then you've made a measurement. If the result is contrary to the hypothesis, then you've made a discovery.
—Enrico Fermi
Step 3: Optimize
Optimize that response time in the most economically efficient way. First, find and eliminate unnecessary work. I repeatedly find this to be the best starting point when assessing a new performance issue. Is that 600-page report that runs every morning at 8 a.m. absolutely necessary? Does someone actually read it? Has the job that runs every night to rebuild indexes been evaluated recently? Asking the right question at the business task level is the best place to start.
If it's really needed, then maybe the report could it be run at 2 a.m. instead? Perhaps it could be executed in SQL*Plus in the data center rather than in Excel 2,000 miles away. If you can't eliminate all the work, the next best thing is to reduce the amount of work being done. Moving business rules from mid-tier applications to the database tier is a great way of accomplishing this. Chapter 11 provides an extensive case study showing the benefits of code in the database.
If you have a critical task that depends heavily on a resource, consider rescheduling other work competing for that resource at the same time. Load management is a very effective tool that is often overlooked. Including the business stakeholders in performance optimization is crucial. If you take your pickup truck to the shop and ask the technician to tune your vehicle, how will they tune? Each technician will have his own interpretation of what “tuned” means. Do you want to use your pickup truck to haul a bed full of steel rods up a steep incline for 2 hours? Do you want to win a 200-mile race at the local dirt track on Friday night? The technician that knows the answer to these questions will get the job done right. The performance analyst that knows the business expectations for workload will also get the job done right.
Reduction of work is also the goal when optimizing code path in your application or optimizing individual SQL statements. The key is to focus on efficiency, accomplishing the right amount of work with the last amount of resource utilization. With the right measurements at hand, you know where the improvements are needed.
The fastest way to do anything is to not do it at all.
—Cary Millsap
![]() Tip Moving business rules to the database tier is a hotly debated subject, but Toon Koppelaars argues for the case better than anyone else I have heard. If you desire the performance benefits of moving code to the lowest tier possible, check out Toon's vision and his explanation of “The Helsinki Declaration (IT Version)” at
Tip Moving business rules to the database tier is a hotly debated subject, but Toon Koppelaars argues for the case better than anyone else I have heard. If you desire the performance benefits of moving code to the lowest tier possible, check out Toon's vision and his explanation of “The Helsinki Declaration (IT Version)” at http://thehelsinkideclaration.blogspot.com/.
Step 4: Repeat
Repeat until your system is economically optimal. A system's performance can always be improved, but at ever increasing cost. By measuring response time of a business task accurately, you can predict the improvement associated with a given change to the software or hardware resources. That quantified improvement can then be weighed against the cost needed to achieve the improvement. The tuning process finishes when the cost of the improvement exceeds the business value gained. When the ball is in the hole—stop.
Go play golf. Go to the golf course. Hit the ball. Find the ball. Repeat until the ball is in the hole. Have fun. The end.
—Chuck Hogan
ILO Example
What does the process of a diagnosing a performance problem look like when your code is properly instrumented? Here I present a case study from our own application development at Method R Corporation. The example comes from work we're doing for a client that contracted us specifically because of our commitment to delivering code that is fast now and fast later.
In many cases, ILO is implemented through calls from an application written in Java or another language external to the database. In this example, the application is written in Java, but all database access is done through a PL/SQL API. Each of the API procedures is instrumented with appropriate module and action names using ILO.
Following the Method R approach, the first step is identification of the task most in need of performance improvement. Based on end user feedback, the task in question was identified by module name: assignment.
Because the code was already instrumented with ILO, the second step of measurement was trivial. When we encountered the performance problem, there was no need to add any sort of debugging or logging code. We used ILO to emit performance data and turn on extended SQL tracing for the assignment task. After execution of the production code in a load test, we analyzed the response time data provided by ILO, using the following query:
SELECT

  ilo_module,

  ilo_action,

  SUM(elapsed_seconds)                                    total_duration,

  AVG(elapsed_seconds)                                    avg_duration,

  COUNT(*)                                                cnt

FROM ilo_run_vw

GROUP by ilo_module,

         ilo_action

ORDER BY SUM(elapsed_seconds) DESC;


                                       TOTAL DURATION   AVG DURATION

ILO_MODULE      ILO_ACTION                  (SECONDS)      (SECONDS) COUNT

--------------  ---------------------- -------------- -------------- -----

assignment      SetLocationData              9.064287     0.09064287   100

SetLocationData get_device                   8.315280     0.08315280   100

SetLocationData get_location                 0.502014     0.00502014   100

SetLocationData update_location              0.036686     0.00036686   100

SetLocationData insert_reservation           0.035895     0.00035895   100

SetLocationData update_device                0.034592     0.00034592   100

SetLocationData merge_device                 0.031978     0.00031978   100
The information provided is exactly what we need to pinpoint the performance issue. In the results of the query, you can see that the get_device procedure was the largest contributor to the response time, over 8 seconds of a 9 second task, SetLocationData. With the extended SQL trace data for this task, a profile was generated that led to optimization of the procedure. The details of the optimization are omitted here to emphasize the importance of the method.
In many cases, examining the variance in executions can be a powerful performance analysis technique. The response time of the get_device procedure was our primary concern in this case, but what if this had not been a current performance issue? We can use Oracle's statistical analysis functions to find tasks with the most variance, like so:
SELECT

  ilo_module,

  ilo_action,

  VARIANCE(elapsed_seconds)                               variance,

  STDDEV(elapsed_seconds)                                 standard_deviation,

  ROUND(VARIANCE(elapsed_seconds)/AVG(elapsed_seconds),3) variance_to_mean_ratio,

  ROUND(STDDEV(elapsed_seconds)/AVG(elapsed_seconds),3)   coefficient_of_variation

FROM ilo_run_vw

GROUP by ilo_module,

         ilo_action

ORDER BY 5 DESC, 3 DESC;


                                                    STANDARD VARIANCE TO  COEFFICIENT

ILO_MODULE      ILO_ACTION               VARIANCE  DEVIATION  MEAN RATIO OF VARIATION

--------------  ---------------------- ---------- ---------- ----------- ------------

SetLocationData get_location           0.00004253 0.00652182       0.008        1.299

SetLocationData get_device             0.00033352 0.01826257       0.004        0.243

assignment      SetLocationData        0.00013663 0.01168871       0.002        0.129

SetLocationData update_location        5.8995E-09 0.00007680       0.000        0.209
SetLocationData insert_reservation 5.3832E-09 0.00007337 0.000 0.204
SetLocationData update_device 3.7374E-09 0.00006113 0.000 0.177
SetLocationData merge_device 7.8088E-09 0.00008837 0.000 0.276
The query results show that both get_location and get_device have a high variance to mean ratio (VMR) and coefficient of variation. If these procedures do the same amount of processing each time they are called, then the variation in response times is an issue worth pursuing. For further explanation of statistical analysis techniques in performance problem diagnosis, I highly recommend Robyn Sands's work in Chapter 13 of Expert Oracle Practices (Apress, 2010). There she explains the significance of the coefficient of variation and variance to mean ratio calculations shown in the output above.
The following code excerpt is just a small sample from the application that generated the ILO data above. I have included the code here to more clearly show the simplicity of the instrumentation.
PROCEDURE SetLocationData(…) IS


-- code omitted


PROCEDURE get_location(…) IS

BEGIN

  ilo_wrapper.begin_task(module => 'assignment',

                         action => 'get_location',

                         comment => 'P_ID=' || p_id || ' p_key=' || p_key);


    -- code omitted


    ilo_wrapper.end_task(widget_count => p_data_count);

  EXCEPTION WHEN OTHERS THEN

    ilo_wrapper.end_task(error_num => SQLCODE);

  END get_location;


  PROCEDURE get_device() IS

  BEGIN --get_device

    ilo_wrapper.begin_task(module => 'assignment', action => 'get_device'),


    -- code omitted


    ilo_wrapper.end_task;

  EXCEPTION WHEN OTHERS THEN

    ilo_wrapper.end_task(error_num => SQLCODE);

  END get_device;


ilo_wrapper.end_task(error_num => status_code, widget_count => v_cnt);


EXCEPTION WHEN OTHERS THEN

  ilo_wrapper.end_task(error_num => SQLCODE);

END SetLocationData;
The real take-away here is that performance optimization in general and instrumentation specifically need to become foremost in your mindset during development. By instrumenting the code, we were able to eliminate all the portions of the code that were irrelevant to the problem. Knowing the true problem is the first and most important step in the solution.
![]() Tip Notice that the calls to ILO are wrapped in an application-specific package called ilo_wrapper. This is a good idea. If you use ILO or any other external library, it makes sense to abstract that code. If changes to the API of ILO happen, then only your wrapper package needs to change to match.
Tip Notice that the calls to ILO are wrapped in an application-specific package called ilo_wrapper. This is a good idea. If you use ILO or any other external library, it makes sense to abstract that code. If changes to the API of ILO happen, then only your wrapper package needs to change to match.
Profiling Example
What does the process of profiling look like in practice? Here's an example that I executed in SQL*Plus to answer the same question I asked earlier: Why is program p slow? This time I'll use ILO for instrumentation instead of DBMS_OUTPUT.PUT_LINE.
CREATE OR REPLACE PROCEDURE q AS

  l_sqlcode NUMBER;

  l_sqlerrm VARCHAR2(512);

BEGIN

  ilo_task.begin_task(module => 'Procedure P',

                      action => 'q'),

  FOR rec IN (SELECT * FROM V$SESSION) LOOP

    NULL;

  END LOOP;

  ilo_task.end_task;

EXCEPTION WHEN OTHERS THEN

  l_sqlcode := SQLCODE;

  l_sqlerrm := SQLERRM;

  ilo_task.end_task(error_num => l_sqlcode);

  -- handle exceptions here

END;

/
CREATE OR REPLACE PROCEDURE r AS
l_sqlcode NUMBER;
l_sqlerrm VARCHAR2(512);
BEGIN
ilo_task.begin_task(module => 'Procedure P',
action => 'r'),
FOR rec IN (SELECT * FROM ALL_OBJECTS) LOOP
NULL;
END LOOP;
ilo_task.end_task;
EXCEPTION WHEN OTHERS THEN
l_sqlcode := SQLCODE;
l_sqlerrm := SQLERRM;
ilo_task.end_task(error_num => l_sqlcode);
-- handle exceptions here
END;
/
CREATE OR REPLACE PROCEDURE s AS
l_sqlcode NUMBER;
l_sqlerrm VARCHAR2(512);
BEGIN
ilo_task.begin_task(module => 'Procedure P',
action => 's'),
FOR rec IN (SELECT * FROM USER_TABLES) LOOP
NULL;
END LOOP;
ilo_task.end_task;
EXCEPTION WHEN OTHERS THEN
l_sqlcode := SQLCODE;
l_sqlerrm := SQLERRM;
ilo_task.end_task(error_num => l_sqlcode);
-- handle exceptions here
END;
/
CREATE OR REPLACE PROCEDURE p AS
l_sqlcode NUMBER;
l_sqlerrm VARCHAR2(512);
BEGIN
ilo_task.begin_task(module => 'Month End Posting',
action => 'p'),
q;
r;
s;
ilo_task.end_task;
EXCEPTION WHEN OTHERS THEN
l_sqlcode := SQLCODE;
l_sqlerrm := SQLERRM;
ilo_task.end_task(error_num => l_sqlcode);
-- handle exceptions here
raise;
END;
/
DELETE FROM ilo_run WHERE ilo_module IN ('Month End Posting', 'Procedure P'),
EXEC ilo_timer.set_mark_all_tasks_interesting(true,true);
EXEC p;
EXEC ilo_timer.flush_ilo_runs;
set pages 1000
COLUMN ILO_MODULE FORMAT A20
COLUMN ILO_ACTION FORMAT A10
SELECT ILO_MODULE, ILO_ACTION, ELAPSED_SECONDS
FROM ilo_run_vw WHERE ilo_module IN ('Month End Posting', 'Procedure P') ORDER BY 3 DESC;ILO_MODULE ILO_ACTION ELAPSED_SECONDS
-------------------- ---------- ---------------
Month End Posting p 8.566376
Procedure P r 8.418068
Procedure P s .135682
Procedure P q .005708
The results of the query in the SQL*Plus script show me exactly where my time was spent, associated with each business task, identified by module and action name. The query results are a profile (assuming that I know the hierarchical relationship of the procedures and the first row returned represents the total line that usually displays at the bottom instead), so I can easily see that if my goal is optimizing response time, procedure r needs my attention.
In addition to storing the elapsed time information in the database, ILO turned on extended SQL tracing so a trace file was generated. Oracle's trace data stream allows me to drill down into procedure p to see all of the database and system calls made that comprised the response time. Since the module and action names are emitted in the trace file as well, I'm also able to drill down specifically into calls corresponding just to procedure r.
First, I would like to see where my response time went for each module/action pair. Summarizing the response time data in the trace file looks like this:
Module:Action        DURATION       %  CALLS      MEAN       MIN       MAX

-------------------  --------  ------  -----  --------  --------  --------

Procedure P:r        8.332521   98.4%    545  0.015289  0.000000  1.968123

Procedure P:s        0.132008    1.6%      4  0.033002  0.000000  0.132008

Procedure P:q        0.000000    0.0%     16  0.000000  0.000000  0.000000

Month End Posting:p  0.000000    0.0%     66  0.000000  0.000000  0.000000

SQL*Plus:            0.000000    0.0%      2  0.000000  0.000000  0.000000

-------------------  --------  ------  -----  --------  --------  --------

TOTAL (5)            8.464529  100.0%    633  0.013372  0.000000  1.968123
In this profile, the data shown for parent procedure p does not include any of the response time contributions of the children. The total elapsed time represented in the trace file is about 8.46 seconds. That doesn't exactly match the values shown in my ILO query, but that's not a problem because the numbers are close enough for my analysis. For more information about the reasons for the difference, see Optimizing Oracle Performance (O'Reilly, 2003).
![]() Note In this example I am using mrskew from the MR Tools suite sold by Method R Corporation to generate the summary information. Oracle's tkprof and Trace Analyzer tools do provide some aggregation, but they don't provide the profile that you need.
Note In this example I am using mrskew from the MR Tools suite sold by Method R Corporation to generate the summary information. Oracle's tkprof and Trace Analyzer tools do provide some aggregation, but they don't provide the profile that you need.
Next, I would like to see where the time was spent while executing just procedure r. To do this, I'll drill down into the trace file data, summarizing only the calls executed while module and action were set to Month End Posting and r respectively:
Call        DURATION       %  CALLS      MEAN       MIN       MAX

----------  --------  ------  -----  --------  --------  --------

FETCH       8.332521  100.0%    542  0.015374  0.000000  1.968123

PARSE       0.000000    0.0%      1  0.000000  0.000000  0.000000

CLOSE       0.000000    0.0%      1  0.000000  0.000000  0.000000

EXEC        0.000000    0.0%      1  0.000000  0.000000  0.000000

----------  --------  ------  -----  --------  --------  --------

TOTAL (4)   8.332521  100.0%    545  0.015289  0.000000  1.968123
Now I see clearly what the database is doing during the 8.33 seconds of time spent. All of the time was spent in the FETCH database call. That's not really surprising, since all r does is execute a single query of ALL_OBJECTS. But the value is still here—I know where the time is spent. But the trace file contains a lot more detail than this, so drilling down further can provide valuable insight. I would like to know which lines in the trace file represent the largest time contributions to my r procedure. Are all the FETCH calls the same duration? Here's the answer to that question (again provided by mrskew):
Line Number  DURATION       %  CALLS      MEAN       MIN       MAX

-----------  --------  ------  -----  --------  --------  --------

       4231  1.968123   23.6%      1  1.968123  1.968123  1.968123

       2689  0.380023    4.6%      1  0.380023  0.380023  0.380023

       4212  0.316020    3.8%      1  0.316020  0.316020  0.316020

       4233  0.304019    3.6%      1  0.304019  0.304019  0.304019

       2695  0.156010    1.9%      1  0.156010  0.156010  0.156010

        281  0.144009    1.7%      1  0.144009  0.144009  0.144009

        362  0.100007    1.2%      1  0.100007  0.100007  0.100007

        879  0.064004    0.8%      1  0.064004  0.064004  0.064004

       1348  0.056003    0.7%      1  0.056003  0.056003  0.056003

       2473  0.052003    0.6%      1  0.052003  0.052003  0.052003

 532 others  4.792300   57.5%    532  0.009008  0.000000  0.044003

-----------  --------  ------  -----  --------  --------  --------

TOTAL (542)  8.332521  100.0%    542  0.015374  0.000000  1.968123
In fact, all of the FETCH calls are not the same duration. The single FETCH call on line 4231 of the trace file comprised almost 24% of the total response time of 8.33 seconds. Instrumentation and profiling allow me to drill down exactly where I need to be to make improvements to my software. In this contrived example, optimizing procedure r means optimizing the query, SELECT * FROM ALL_OBJECTS. The long FETCH call in this case was an anomaly due to the recursive SQL but does serve well to show the method.
Summary
In the software development lifecycle, you should treat PL/SQL with the same disciplines as any other software language—especially the discipline of instrumentation. In order to write fast code that continues to be fast throughout the life of the application, you must properly instrument the code during development. Tools for low level debugging and profiling exist and are useful during development, but these are not well suited for use in production environments.
When performance problems arise in a production environment, an analyst needs to quickly find the area of code that is the largest contributor to response time. Proper instrumentation will provide data for a profile that clearly shows this information, leading to a successful analysis and resolution of the problem. You can know that you're measuring the right things and that you've instrumented the right way, when you are able to generate profiles of your code in action that clearly point to the portions of the code where the largest amount of time is being spent. Adding good instrumentation to your code isn't difficult, and ILO, the Instrumentation Library for Oracle, makes it painless.