
C H A P T E R 3
Optimizing Instance Memory
Optimizing the memory you allocate to an Oracle database is one of the most critical tasks you need to perform as a DBA. Over the years, Oracle DBAs were used to spending vast amounts of their time analyzing memory usage by the database and trying to come up with the best possible allocation of memory. In Oracle Database 11g, the burden of allocating Oracle's memory is shifted almost completely to the database itself. This chapter shows you how to take advantage of Oracle's automatic memory management feature, so you can leave the database to optimize memory usage, while you focus on more important matters.
This chapter starts off by explaining how to set up automatic memory management for a database. The chapter also shows you how to set minimum values for certain components of memory even under automatic memory management. It also includes recipes that explain how to create multiple buffer pools, how to monitor Oracle's usage of memory, and how to use the Oracle Enterprise Manager's Database Control (or Grid Control) tool to get advice from Oracle regarding the optimal sizing of memory allocation. You'll also learn how to optimize the use of the Program Global Area (PGA), a key Oracle memory component, especially in data warehouse environments.
In Oracle Database 11g, Oracle has introduced an exciting new result caching feature. Oracle can now cache the results of both SQL queries and PL/SQL functions in the shared pool component of Oracle's memory. We discuss that server result cache in this chapter. In addition, you'll also find a recipe that explains how to take advantage of Oracle's client-side result caching feature. Finally, we show how to use the exciting new Oracle feature called the Oracle Database Smart Flash Cache.
3-1. Automating Memory Management
Problem
You want to automate memory management in your Oracle database. You have both OLTP and batch jobs running in this database. You want to take advantage of the automatic memory management feature built into Oracle Database 11g.
Solution
Here are the steps to implement automatic memory management in your database, if you've already set either the SGA_TARGET or the PGA_AGGREGATE_TARGET parameters (or both). We assume that we are going to allocate 2,000 MB to the MEMORY_MAX_TARGET parameter and 1,000 MB to the MEMORY_TARGET parameter.
- Connect to the database with the SYSDBA privilege.
- Assuming you're using the
SPFILE, first set a value for theMEMORY_MAX_TARGETparameter:SQL> alter system set memory_max_target=2G scope=spfile;
System altered.You must specify the
SCOPEparameter in thealter systemcommand, becauseMEMORY_MAX_TARGETisn't a dynamic parameter, which means you can't change it on the fly while the instance is running. - Note that if you've started the instance with a traditional
init.oraparameter file instead of theSPFILE, you must add the following to yourinit.orafile:memory_max_target = 2000M
memory_target = 1000M - Bounce the database.
- Turn off the
SGA_TARGETand thePGA_AGGREGATE_TARGETparameters by issuing the followingALTER SYSTEMcommands:SQL> alter system set sga_target = 0;
SQL> alter system set pga_aggregate_target = 0; - Turn on automatic memory management by setting the
MEMORY_TARGETparameter:SQL> alter system set memory_target = 1000M;
From this point on, the database runs under the automatic memory management mode, with it shrinking and growing the individual allocations to the various components of Oracle memory according to the requirements of the ongoing workload. You can change the value of the MEMORY_TARGET parameter dynamically anytime, as long as you don't exceed the value you set for the MEMORY_MAX_TARGET parameter.
![]() Tip The term “target” in parameters such as
Tip The term “target” in parameters such as memory_target and pga_memory_target means just that—Oracle will try to stay under the target level, but there's no guarantee that it'll never go beyond that. It may exceed the target allocation on occasion, if necessary.
You don't have to set the SGA_TARGET and PGA_AGGREGATE_TARGET parameters to 0 in order to use automatic memory management. In Recipe 3-3, we show how to set minimum values for these parameters even when you choose to implement automatic memory management. That recipe assumes you're implementing automatic memory management, but that for some reason, you need to specify your own minimum values for components such as the SGA and the PGA.
How It Works
In earlier releases of the Oracle database, DBAs used to set values for the various SGA components, or would specify values for the SGA and the PGA. Starting with the Oracle Database 11g release, Oracle enables you to completely automate the entire instance memory allocation, by just setting a single initialization parameter, MEMORY_TARGET, under what's known as automatic memory management. In this Recipe, we show you how to set up the automatic memory management feature in your database.
If you're creating a new Oracle database with the help of the Database Configuration Assistant (DBCA), you're given a choice among automatic memory management, shared memory management, and manual memory management. Select the automatic memory management option, and specify the values for two automatic memory-related parameters: MEMORY_TARGET and MEMORY_MAX_TARGET. The first parameter sets the current value of the memory allocation to the database, and the second parameter sets the limit to which you can raise the first parameter if necessary.
Oracle's memory structures consist of two distinct memory areas. The system global area (SGA) contains the data and control information and is shared by all server and background processes. The SGA holds the data blocks retrieved from disk by Oracle. The program global area (PGA) contains data and control information for a server process. Each server process is allocated its own chunk of the PGA. Managing Oracle's memory allocation involves careful calibration of the needs of the database. Some database instances need more memory for certain components of the memory. For example, a data warehouse will need more PGA memory in order to perform huge sorts that are common in such an environment. Also, during the course of a day, the memory needs of the instance might vary; during business hours, for example, the instance might be processing more online transaction processing (OLTP) work, whereas after business hours, it might be running huge batch jobs that involve data warehouse processing, jobs that typically need higher PGA allocations per each process.
In prior versions of the Oracle database, DBAs had to carefully decide the optimal allocation of memory to the individual components of the memory one allocated to the database. Technically, you can still manually set the values of the individual components of the SGA as well as set a value for the PGA, or partially automate the process by setting parameters such as SGA_TARGET and PGA_AGGREGATE_TARGET. Although Oracle still allows you to manually configure the various components of memory, automatic memory management is the recommended approach to managing Oracle's memory allocation. Once you specify a certain amount of memory by setting the MEMORY_TARGET and MEMORY_MAX_TARGET parameters, Oracle automatically tunes the actual memory allocation, by redistributing memory between the SGA and the PGA.
![]() Tip When you create a database with the Database Configuration Assistant (DBCA), automatic memory management is the default.
Tip When you create a database with the Database Configuration Assistant (DBCA), automatic memory management is the default.
Oracle Database 11g lets you automate all the memory allocations for an instance, including shared memory and the PGA memory, if you choose to implement automatic memory management by setting the MEMORY_TARGET and MEMORY_MAX_TARGET parameters. Under an automatic memory management regime, Oracle automatically tunes the total SGA size, the SGA component sizes, the instance PGA size, and the individual PGA size. This dynamic memory tuning by the Oracle instance optimizes database performance, as memory allocations are changed automatically by Oracle to match changing database workloads. Automatic memory management means that once you set the MEMORY_TARGET parameter, you can simply ignore the following parameters by not setting them at all:
If you're moving from a system where you were using the SGA_TARGET and PGA_AGGREGATE_TARGET parameters, you can follow the procedures shown in the “Solution” section of this recipe to move to the newer automatic memory management mode of managing Oracle's memory allocation. Note that while setting the MEMORY_TARGET parameter is mandatory for implementing automatic memory management, the MEMORY_MAX_TARGET parameter isn't—if you don't set this parameter, Oracle sets its value internally to that of the MEMORY_TARGET parameter. Also, the MEMORY_MAX_TARGET parameter acts as the upper bound for the MEMORY_TARGET parameter. Oracle has different minimum permissible settings for the MEMORY_TARGET parameter, depending on the operating system. If you try to set this parameter below its minimum allowable value, the database will issue an error. Some of the memory components can't shrink quickly and some components must have a minimum size for the database to function properly. Therefore, Oracle won't let you set too low a value for the MEMORY_TARGET parameter. The following example shows this:
SQL> alter system set memory_target=360m scope=both;

alter system set memory_target=360m scope=both

*

ERROR at line 1:

ORA-02097: parameter cannot be modified because specified value is invalid

ORA-00838: Specified value of MEMORY_TARGET is too small, needs to be at least

544M


SQL> alter system set memory_target=544m scope=both;


alter system set memory_target=544m scope=both

*

ERROR at line 1:

ORA-02097: parameter cannot be modified because specified value is invalid

ORA-00838: Specified value of MEMORY_TARGET is too small, needs to be at least

624M


SQL>  alter system set memory_target=624m scope=both;


System altered.


SQL>
You'll notice that Oracle issued an error when we tried to set a very low value for the MEMORY_TARGET parameter. Note that Oracle took iterations to decide to let you know the minimum allowable level for the MEMORY_TARGET parameter.
How does one go about setting the value of the MEMORY_MAX_TARGET parameter? It's simple—you just pick a value that's high enough to accommodate not only the current workloads, but also the future needs of the database. Since the MEMORY_TARGET parameter is dynamic, you can alter it on the fly and if necessary, re-allocate memory among multiple instances running on a server. Just be sure that you set the value of the MEMORY_MAX_TARGET parameter to a size that's at least equal to the combined value of the present settings of the SGA_TARGET and the PGA_AGGREGATE_TARGET parameters (if you're migrating from the 10g release). Always make sure to check with your system administrator, so you don't allocate too high an amount of memory for your Oracle instance, which could result in problems such as paging and swapping at the operating system level, which will affect not only your Oracle database, but also everything else that's running on that server.
3-2. Managing Multiple Buffer Pools
Problem
You're using automatic memory management, but have decided to allocate a minimum value for the buffer pool component. You'd like to configure the buffer pool so it retains frequently accessed segments, which may run the risk of being aged out of the buffer pool.
Solution
You can use multiple buffer pools instead of Oracle's single default buffer pool, to ensure that frequently used segments stay cached in the buffer pool without being recycled out of the buffer pool. In order to implement multiple buffer pools in your database, you need to do two things: create two separate buffer pools—the KEEP buffer pool and the RECYCLE buffer pool. Once you do this, you must specify the BUFFER_POOL keyword in the STORAGE clause when you create a segment. For example, if you want a segment to be cached (or pinned) in the buffer pool, you must specify the KEEP buffer pool.
![]() Note Neither the
Note Neither the KEEP nor the RECYCLE pool is part of the default BUFFER CACHE. Both of these pools are outside the default buffer cache.
Here's how you create the two types of buffer pools.
In the SPFILE or the init.ora file, specify the two parameters and the sizes you want to assign to each of the pools:
db_keep_cache_size=1000m

db_recycle_cache_size=100m
Here's how you specify the default buffer pool for a segment:
SQL> alter table employees

     storage (buffer_pool=keep);


Table altered.

SQL>
How It Works
Configuring a KEEP buffer pool is an ideal solution in situations where your database contains tables that are referenced numerous times. You can store such frequently accessed segments in the KEEP buffer cache. By doing this, you not only isolate those segments to a specific part of the buffer pool, but also ensure that your physical I/O is minimized as well. How large the KEEP buffer pool ought to be depends on the total size of the objects you want to assign to the pool. You can get a rough idea by summing up the size of all candidate objects for this pool, or you can check the value of the DBA_TABLES view (BLOCKS column) to figure this out.
While we're on this topic, we'd like to point out the counterpart to the KEEP buffer pool—the RECYCLE buffer pool. Normally, the Oracle database uses a least recently used algorithm to decide which objects it should jettison from the buffer cache, when it needs more free space. If your database accesses very large objects once or so every day, you can keep these objects from occupying a big chunk of your buffer cache, and instead make those objects age right out of the buffer cache after they've been accessed. You can configure such behavior by allowing candidate objects to use the RECYCLED buffer pool either when you create those objects, or even later on, by setting the appropriate storage parameters, as shown in the following examples (note that you must first set the DB_RECYCLE_CACHE_SIZE initialization parameter, as shown in the “Solution” section of this recipe.
You can execute the following query to figure out how many blocks for each segment are currently in the buffer cache:
SQL> select o.object_name, count(*) number_of_blocks

     from dba_objects o, v$bh v

     where o.data_object_id = v.objd

     and o.owner !='SYS'

     group by o.object_name

     order by count(*);
When your database accesses large segments and retrieves data to process a query, it may sometimes age out other segments from the buffer pool prematurely. If you need these prematurely aged-out segments later on, it requires additional I/O. What exactly constitutes a large table or index segment is subject to your interpretation. It's probably safe to think of the size of the object you're concerned with by considering its size relative to the total memory you have allocated to the buffer cache. Oracle figures that if a single segment takes up more than 10% of (non-sequential) physical reads, it's a large segment, for the purpose of deciding if it needs to use the KEEP or RECYCLE buffer pools. So, a handful of such large segments can occupy a significant proportion of the buffer cache and hurt the performance of the database.
If you have other segments that the database accesses, let's say, every other second, they won't age out of the buffer pool since they are constantly in use. However, there may be other segments that will be adversely affected by the few large segments the database has read into its buffer cache. It's in such situations that your database can benefit most by devoting the RECYCLE pool for the large segments. Of course, if you want to absolutely, positively ensure that key segments never age out at all, then you can create the KEEP buffer cache and assign these objects to this pool.
3-3. Setting Minimum Values for Memory
Problem
You're using automatic memory management, but you think that the database sometimes doesn't allocate enough memory for the PGA_AGGREGATE_TARGET component.
Solution
Although automatic memory management is supposed to do what it says—automate memory allocation—there are times when you realize that Oracle isn't allocating certain memory components optimally. You can set a minimum value for any of the main Oracle memory components—buffer cache, shared pool, large pool, Java pool, and the PGA memory. For example, even after specifying automatic memory management, you can specify a target for the instance PGA with the following command, without having to restart the database:
SQL> alter system set pga_aggregate_target=1000m;
Oracle will, from this point forward, never decrease the PGA memory allocation to less than the value you've set—this value implicitly sets a minimum value for the memory parameter. The database will continue to automatically allocate memory to the various components of the SGA, but first it subtracts the memory you've allocated explicitly to the PGA—in this case, 1,000 MB, from the MEMORY_TARGET parameter's value. What remains is what the database will allocate to the instance's SGA.
How It Works
Ever since Oracle introduced the SGA_TARGET (to automate shared memory management) in Oracle Database 10g and the MEMORY_TARGET parameter (to automate shared memory and PGA memory management) in Oracle Database 11g, some DBAs have complained that these parameters sometimes weren't appropriately sizing some of the components of Oracle memory, such as the buffer cache.
There's some evidence that under automatic memory management, the database could lag behind an event that requires a sudden increase in the allocation to either one of the individual components of the SGA or to the PGA. For example, you may have a spurt of activity in the database that requires a quick adjustment to the shared pool component of memory—the database may get to the optimal shared pool size allocation level only after it notices the events that require the higher memory. As a result, the database may undergo a temporary performance hit. Several DBAs have, as a result, found that automatic memory management will work fine, as long as you set a minimum value for, say, the buffer cache or the PGA or both, by specifying explicit values for the SGA_TARGET and the PGA_AGGREGATE_TARGET initialization parameters, instead of leaving them at their default value of zero. The database will still use automatic memory management, but will now use the specific values you set for any of the memory components as minimum values. Having said this, in our experience, automatic memory management works as advertised most of the time; however, your mileage may vary, depending on any special time-based workload changes in a specific database. At times like this, it's perfectly all right to set minimum values that represent your own understanding of your processing requirements, instead of blindly depending on Oracle's automatic memory algorithms.
3-4. Monitoring Memory Resizing Operations
Problem
You've implemented automatic memory management in your database and would like to monitor how the database is currently allocating the various dynamically tuned memory components.
Solution
Under an automatic memory management mode, you can view the current allocations of memory in any instance by querying the V$MEMORY_DYNAMIC_COMPONENTS view. Querying this view provides vital information to help you tune the MEMORY_TARGET parameter. Here's how you execute a query against this view:
SQL> select * from v$memory_target_advice order by memory_size;


MEMORY_SIZE MEMORY_SIZE_FACTOR ESTD_DB_TIME ESTD_DB_TIME_FACTOR    VERSION

----------- ------------------ ------------ ------------------- ----------

        468                .75        43598              1.0061          0

        624                  1        43334                   1          0

        780               1.25        43334                   1          0

        936                1.5        43330               .9999          0

       1092               1.75        43330               .9999          0

       1248                  2        43330               .9999          0


6 rows selected.


SQL>
Your current memory allocation is shown by the row with the MEMORY_SIZE_FACTOR value of 1 (624 MB in our case). The MEMORY_SIZE_FACTOR column shows alternate sizes of the MEMORY_TARGET parameter as a multiple of the current MEMORY_TARGET parameter value. The ESTD_DB_TIME column shows the time Oracle estimates it will need to complete the current workload with a specific MEMORY_TARGET value. Thus, the query results show you how much faster the database can process its work by varying the value of the MEMORY_TARGET parameter.
How It Works
Use the V$MEMORY_TARGET_ADVICE view to get a quick idea about how optimal your MEMORY_TARGET allocation is. You need to run a query based on this view after a representative workload has been processed by the database, to get useful results. If the view reports that there are no gains to be had by increasing the MEMORY_TARGET setting, you don't have to throw away precious system memory by allocating more memory to the database instance. Oftentimes, the query may report that potential performance, as indicated by the ESTD_DB_TIME column of the V$MEMORY_TARGET_ADVICE view, doesn't decrease at a MEMORY_SIZE_FACTOR value that's less than 1. You can safely reduce the setting of the MEMORY_TARGET parameter in such cases.
You can also use the V$MEMORY_RESIZE_OPS view to view how the instance resized various memory components over a past interval of 800 completed memory resizing operations. You'll see that the database automatically increases or shrinks the values of the SGA_TARGET and PGA_AGGREGATE_TARGET parameters based on the workload it encounters. The following query shows how to use the V$MEMORY_RESIZE_OPS view to understand Oracle's dynamic allocation of instance memory:
SQL> select component,oper_type,oper_mode,parameter, final_size,target_size

     from v$memory_resize_ops


COMPONENT               OPER_TYPE   OPER_MODE      PARAMETER      FINAL_SIZE   TARGET_SIZE

---------------------  -----------  ---------   ---------------  ------------  ------------


DEFAULT buffer cache    GROW        DEFERRED   db_cache_size        180355072     180355072

shared pool             GROW        DEFERRED   shared_pool_size     264241152     264241152

…

20 rows selected.

SQL>
The OPER_TYPE column can take two values - GROW or SHRINK, depending on whether the database grows or shrinks individual memory components as the database workload fluctuates over time. It's this ability to respond to these changes by automatically provisioning the necessary memory to the various memory components that makes this “automatic” memory management. The DBA will do well by monitoring this view over time, to ensure that automatic memory management works well for his or her databases.
3-5. Optimizing Memory Usage
Problem
You've set up automatic memory management in your databases and would like to optimize memory usage with the help of Oracle's memory advisors.
Solution
Regardless of whether you set up automatic memory management (AMM) or automatic shared memory management (ASMM), or even a manual memory management scheme, you can use Oracle's Memory Advisors to guide your memory tuning efforts. In this example, we show how to use Oracle Enterprise Manager Database Control to easily tune memory usage. Here are the steps:
- Go to the Database Home page in Database Control. Click Advisor Central at the bottom of the page.
- In the Memory Advisors page that appears, click Advice next to the Total Memory Size box under Automatic Memory Management.
The Memory Size Advice graph appears in a separate window, as shown in Figure 3-1. In this graph, the improvement in DB time is plotted against the total memory that you've currently set for the MEMORY_TARGET parameter. The higher the value of improvement in DB time, the better off will be the performance. The graph shows how performance (improvement in DB time) will vary as you change the MEMORY_TARGET parameter value. The total memory you allocate can't be more than the maximum allowed memory for this instance, which is indicated by the dotted straight line in the graph.
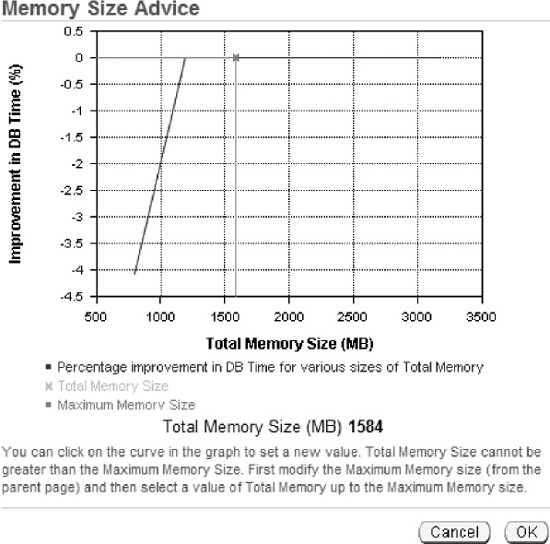
Figure 3-1. The Memory Size Advice graph in Database Control
How It Works
When you implement automatic memory management, Oracle automatically adjusts memory between the various components of total memory—the SGA and the PGA—during the course of the instance, depending on the workload characteristics of the instance. Instead of running queries using various views to figure out if your current memory allocation is optimal, you can follow a couple of easy steps to figure things out quickly. You can review the Automatic Database Diagnostic Monitor(ADDM) reports to see if they contain any comments or recommendations about inadequate memory. ADDM recommends that you add more memory to the MEMORY_TARGET parameter, if it considers that the current memory allocation is insufficient for optimal performance.
If the ADDM reports recommend that you increase the size of the MEMORY_TARGET parameter, the next question is by how much you should increase the memory allocation. Oracle's built-in Memory Advisors come in handy for just this purpose. Even in the absence of a recommendation by the ADDM, you can play with the Memory Advisors to get an idea of how an increase or decrease in the MEMORY_TARGET parameter will impact performance.
You can also choose to optimize your PGA memory allocation from the same Memory Advisors page by clicking PGA at the top of the page. In the case of the PGA, in the PGA Target Advice page, the graphs plots the PGA cache hit percentage against the PGA target size. Ideally, you'd want the PGA cache ratio somewhere upward of around 70%. The PGA Target Advice page will help you determine approximately what value you should assign to the PGA_AGGREGATE_TARGET parameter to achieve your performance goals.
3-6. Tuning PGA Memory Allocation
Problem
You've decided to set a specific minimum memory size for the PGA_AGGREGATE_TARGET parameter, although you're using Oracle's automatic memory management to allocate memory. You'd like to know the best way to figure out the optimal PGA memory allocation.
Solution
There are no hard and fast rules for allocating the size of the PGA_AGGREGATE_TARGET parameter. Having said that, if you're operating a data warehouse, you're more likely to need much larger amounts of memory set apart for the PGA component of Oracle's memory allocation. You can follow these basic steps to allocate PGA memory levels:
- Use a starting allocation more or less by guessing how much memory you might need for the PGA.
- Let the database run for an entire cycle or two of representative workload. You can then access various Oracle views to figure out if your first stab at the PGA estimation was on target.
How It Works
Although automatic memory management is designed to optimally allocate memory between the two major components of Oracle memory—the SGA and the PGA—it's certainly not uncommon for many DBAs to decide to set their own values for both the SGA and the PGA, either as part of the alternative mode of memory management, automatic shared memory management, wherein you set the SGA_TARGET and the PGA_AGGREGATE_TARGET parameters explicitly to manage memory, or even under the newer automatic memory management system. Unlike the SGA_TARGET parameter, where cache hit ratios could mislead you as to the efficacy of the instance, you'll find that an analysis of the hit ratios for the PGA_AGGREGATE_TARGET parameter are not only valid, but also highly useful in configuring the appropriate sizes for this parameter.
The Oracle database uses PGA memory to perform operations such as sorting and hashing. The memory you allocate to the PGA component is used by various SQL work areas running in the database (along with other users of the PGA memory such as PL/SQL and Java programs). Ideally, you'd want all work areas to have an optimal PGA memory allocation. When memory allocation is ideal, a work area performs the entire operation in memory. For example, if a SQL operation involves sorting operations, under optimal PGA allocation, all of the sorting is done within the PGA memory allocated to that process. If the PGA memory allocation isn't optimal, the work areas make one or more passes over the data—this means they have to perform the operations on disk, involving time consuming I/O. The more passes the database is forced to make, the more I/O and the longer it takes to process the work.
Oracle computes the PGA cache hit percentage with the following formula:
Bytes Processed * 100 /(Bytes processed + Extra Bytes Processed)
Bytes Processed is the total number of bytes processed by all the PGA memory using SQL operations since the instance started. You should seek to get this ratio as close to 100 as possible—if your PGA cache hit percentage is something like 33.37%, it's definitely time to increase PGA memory allocation by raising the value you've set for the PGA_AGGREGATE_TARGET parameter. Fortunately, the PGA_AGGREGATE_TARGET parameter is dynamic, so you can adjust this on the fly without a database restart, to address a sudden slowdown in database performance due to heavy sorting and hashing activity.
You can issue the following simple query to find out the PGA cache hit percentage as well as a number of PGA performance-related values.
SQL>select  * from v$pgastat;

NAME                                     VALUE             UNIT

--------------------------------       -------------     ----------

aggregate PGA target parameter             570425344     bytes

aggregate PGA auto target                  481397760     bytes

total PGA inuse                             35661824     bytes

total PGA allocated                         70365184     bytes

maximum PGA allocated                      195681280     bytes

over allocation count                              0     bytes processed

extra bytes read/written                           0     bytes

cache hit percentage                             100     percent

SQL>
Since we're using our test database here, the cache hit percentage is a full 100%, but don't expect that in a real-life database, especially if it is processing a lot of data warehouse–type operations!
You can also use the V$SQL_WORKAREA_HISTOGRAM view to find out how much of its work the database is performing in an optimal fashion. If a work area performs its work optimally, that is, entirely within PGA memory, it's counted as part of the OPTIMAL_COUNT column. If it makes one or more passes, it will go under the ONEPASS_COUNT or the MULTIPASS_COUNT columns. Here's a query that shows how to do this:
SQL> select optimal_count, round(optimal_count*100/total, 2) optimal_perc,

  2  onepass_count, round(onepass_count*100/total, 2) onepass_perc,

  3  multipass_count, round(multipass_count*100/total, 2) multipass_perc

  4  from

  5   (select decode(sum(total_executions), 0, 1, sum(total_executions)) total,

  6   sum(OPTIMAL_EXECUTIONS) optimal_count,

  7   sum(ONEPASS_EXECUTIONS) onepass_count,

  8   sum(MULTIPASSES_EXECUTIONS) multipass_count

  9   from  v$sql_workarea_histogram

 10* where low_optimal_size > (64*1024))

SQL> /
OPTI_COUNT OPTI_PERC ONEPASS_CT ONEPASS_PERC MULTIPASS_CT MULTIPASS_PERC
----------- ----------- ----------- ------------- ------------- ---------------
8069 100 0 0 0 0
One pass is slower than none at all, but a multi-pass operation is a sure sign of trouble in your database, especially if it involves large work areas. You'll most likely find that your database has slowed to a crawl and is unable to scale efficiently when the database is forced to make even a moderate amount of multi-pass executions that involve large work areas, such as those that are sized 256 MB to 2 GB. To make sure that you don't have any huge work areas running in the multi-pass mode, issue the following query:
SQl> select low_optimal_size/1024 low,

     (high_optimal_size+1)/1024 high,

     optimal_executions, onepass_executions, multipasses_executions

     from v$sql_workarea_histogram

     where total_executions !=0;
You can also execute simple queries involving views such as V$SYSSTAT and V$SESSTAT as shown here, to find out exactly how many work areas the database has executed with an optimal memory size (in the PGA), one-pass memory size, and multi-pass memory sizes.
SQL>select name profile, cnt, decode(total, 0, 0, round(cnt*100/total)) percentage

    from (SELECT name, value cnt, (sum(value) over ()) total

    from V$SYSSTAT

    where name like 'workarea exec%'),
Remember that this query shows the total number of work areas executed under each of the three different execution modes (optimal, one-pass, and multi-pass), since the database was started. To get the same information for a specific period of time, you can use queries involving Automatic Session History (ASH).
You can also view the contents of the Automatic Workload Repository (AWR) for information regarding how the database used its PGA memory for any interval you choose. If you regularly create these reports and save them, you can have a historical record of how well the PGA allocation has been over a period of time. You can also view the ADDM report for a specific time period to evaluate what proportion of work the database is executing in each of the three modes of execution we discussed earlier. In a data warehouse environment, where the database processes huge sorts and hashes, the optimal allocation of the PGA memory is one of the most critical tasks a DBA can perform.
3-7. Configuring the Server Query Cache
Problem
You'd like to set up the server query cache that's part of Oracle's memory allocation.
Solution
You can control the behavior of the server query cache by setting three initialization parameters: RESULT_CACHE_MAX_SIZE, RESULT_CACHE_MAX_RESULT, and RESULT_CACHE_REMOTE_EXPIRATION. For example, you can use the following set of values for the three server result cache-related initialization parameters:
RESULT_CACHE_MAX_SIZE=500M      /* Megabytes

RESULT_CACHE_MAX_RESULT=20     /* Percentage

RESULT_CACHE_REMOTE_EXPIRATION=3600       /* Minutes
You can disable the server result cache by setting the RESULT_CACHE_MAX_SIZE parameter to 0 (any non-zero value for this parameter enables the cache).
If you set the RESULT_CACHE_MODE initialization parameter to FORCE, the database caches all query results unless you specify the /*+ NO_RESULT_CACHE */ hint to exclude a query's results from the cache. The default (and the recommended) value of this parameter is MANUAL, meaning that the database caches query results only if you use the appropriate query hint or table annotation (explained later). You can set this parameter at the system level or at the session level, as shown here:
SQL> alter session set result_cache_mode=force;
You can remove cached results from the server result cache by using the FLUSH procedure from the DBMS_RESULT_CACHE package, as shown here:
SQL> execute dbms_result_cache.flush
How It Works
The server result cache offers a great way to store results of frequently executed SQL queries and PL/SQL functions. This feature is easy to configure with the help of the three initialization parameters we described in the “Solution” section. However, remember that Oracle doesn't guarantee that a specific query or PL/SQL function result will be cached no matter what.
In some ways, you can compare the Oracle result cache feature to other Oracle result storing mechanisms such as a shared PL/SQL collection, as well as a materialized view. Note, however, that whereas Oracle stores a PL/SQL collection in private PGA areas, it stores the result cache in the shared pool as one of the shared pool components. As you know, the shared pool is part of the SGA. Materialized views are stored on disk, whereas a result cache is in the much faster random access memory. Thus, you can expect far superior performance when you utilize the result cache for storing result sets, as opposed to storing pre-computed results in a materialized view. Best of all, the result cache offers the Oracle DBA a completely hands-off mode of storing frequently accessed result sets—you don't need to create any objects, as in the case of materialized views, index them, or refresh them. Oracle takes care of everything for you.
The server query cache is part of the shared pool component of the SGA. You can use this cache to store both SQL query results as well as PL/SQL function results. Oracle can cache SQL results in the SQL result cache and PL/SQL function results in the PL/SQL function result cache. You usually use the server query cache to make the database cache queries that are frequently executed but need to access a large number of rows per execution. You configure the server query cache by setting the following initialization parameters in your database.
RESULT_CACHE_MAX_SIZE: This sets the memory allocated to the server result cache.RESULT_CACHE_MAX_RESULT: This is the maximum amount of memory a single result in the cache can use, in percentage terms. The default is 5% of the server result cache.RESULT_CACHE_REMOTE_EXPIRATION: By default, any result that involves remote objects is not cached. Thus, the default setting of theRESULT_CACHE_REMOTE_EXPIRATIONparameter is 0. You can, however, enable the caching of results involving remote objects by setting an explicit value for theRESULT_CACHE_REMOTE_EXPIRATIONparameter.
Setting the three initialization parameters for the server result cache merely enables the cache. To actually use the cache for your SQL query results, or for PL/SQL function results, you have to either enable the cache database-wide, or for specific queries, as the following recipes explain.
Once the database stores a result in the server result cache, it retains it there until you either remove it manually with the DBMS_RESULT_CACHE.FLUSH procedure, or until the cache reaches its maximum size set by the RESULT_CACHE_MAX_SIZE parameter. The database will remove the oldest results from the cache when it needs to make room for newer results when it exhausts the capacity of the server result cache.
3-8. Managing the Server Result Cache
Problem
You've enabled the server result cache, but you aren't sure if queries are taking advantage of it. You also would like to find out how well the server result cache is functioning.
Solution
You can check the status of the server result cache by using the DBMS_RESULT_CACHE package. For example, use the following query to check whether the cache is enabled:
SQL> select dbms_result_cache.status() from dual;


DBMS_RESULT_CACHE.STATUS()

-----------------------------------------------------

ENABLED

SQL>
You can view a query's explain plan to check whether a query is indeed using the SQL query cache, after you enable that query for caching, as shown in the following example. The explain plan for the query shows that the query is indeed making use of the SQL query cache component of the result cache.
SQL> select  /*+ RESULT_CACHE */ department_id, AVG(salary)

     from hr.employees

     group by department_id;

.

.

.
--------------------------------------------------------------
| Id | Operation | Name |Rows
--------------------------------------------------------------
| 0 | SELECT STATEMENT | | 11
| 1 | RESULT CACHE | 8fpza04gtwsfr6n595au15yj4y |
| 2 | HASH GROUP BY | | 11
| 3 | TABLE ACCESS FULL| EMPLOYEES | 107
--------------------------------------------------------------
You can use the MEMORY_REPORT procedure of the DBMS_RESULT_CACHE package to view how Oracle is allocating memory to the result cache, as shown here:
SQL> SET SERVEROUTPUT ON

SQL> execute dbms_result_cache.memory_report


R e s u l t  C a c h e  M e m o r y  R e p o r t

[Parameters]

Block Size = 1024 bytes

Maximum Cache Size = 950272 bytes (928 blocks)

Maximum Result Size = 47104 bytes (46 blocks)

[Memory]

Total Memory = 46340 bytes [0.048% of the Shared Pool]

... Fixed Memory = 10696 bytes [0.011% of the Shared Pool]

... State Object Pool = 2852 bytes [0.003% of the Shared Pool]

... Cache Memory = 32792 bytes (32 blocks) [0.034% of the Shared Pool]

....... Unused Memory = 30 blocks

....... Used Memory = 2 blocks

........... Dependencies = 1 blocks

........... Results = 1 blocks

............... SQL = 1 blocks


PL/SQL procedure successfully completed.

SQL>
You can monitor the server result cache statistics by executing the following query:
SQL> select name, value from V$RESULT_CACHE_STATISTICS;


NAME                          VALUE

--------------------          ----------

Block Size (Bytes)            1024

Block Count Maximum           3136

Block Count Current             32

Result Size Maximum (Blocks)   156

Create Count Success             2

Create Count Failure             0

Find Count                       0

Invalidation Count               0

Delete Count Invalid             0

Delete Count Valid               0

SQL>
The Create Count Success column shows the number of queries that the database has cached in the server result cache, and the Invalidation Count column shows the number of times the database has invalidated a cached result.
How It Works
You can monitor and manage the server result cache with the DBMS_RESULT_CACHE package provided by Oracle. This package lets you manage both components of the server result cache, the SQL result cache and the PL/SQL function result cache. You can use the DBMS_RESULT_CACHE package to manage the server result cache memory allocation, as well as to bypass and re-enable the cache (when recompiling PL/SQL packages, for example), flush the cache, and to view statistics relating to the server query cache memory usage.
The server result cache is part of Oracle's shared pool component of the SGA. Depending on the memory management system in use, Oracle allocates a certain proportion of memory to the server result cache upon starting the database. Here are the rules that Oracle uses for deciding what percentage of the shared pool it allocates to the server result cache:
- If you're using automatic memory management by setting the
MEMORY_TARGETparameter, Oracle allocates 0.25% of theMEMORY_TARGETparameter's value to the server result cache. - If you're using automatic shared memory management with the
SGA_TARGETparameter, the allocation is 0.5% of theSGA_TARGETparameter. - If you're using manual memory management by setting the
SHARED_POOL_SIZEparameter, the allocation is 1% of theSHARED_POOL_SIZEparameter.
In an Oracle RAC environment, you can size the server cache differently on each instance, just as you do with the MEMORY_TARGET and other instance-related parameters. Similarly, when you disable the server result cache by setting the RESULT_CACHE_MAX_SIZE to 0, you must do so on all the instances of the cluster.
The server result cache can potentially reduce your CPU overhead by avoiding recomputation of results, where data may have to be fetched repeatedly from the buffer cache, which results in a higher number of logical I/Os. When you opt to cache the results in the cache instead of pre-computing them and storing them in materialized views, you can also potentially reduce the database disk I/O as well. Just remember that the primary purpose of the result cache isn't to store just any results in memory—it's mainly designed to help with the performance of queries that involve static or mostly static data. Thus, a data warehouse or decision support system is likely to derive the greatest benefit from this new performance feature.
3-9. Caching SQL Query Results
Problem
You've configured the server result cache in your database. You would now like to configure a set of queries whose result you would like to be cached in the server result cache.
Solution
Set the RESULT_CACHE_MODE initialization parameter to the appropriate value for making queries eligible for caching in the server result cache. You can set the RESULT_CACHE_MODE to the value FORCE, to force all SQL results to be cached by the database. Oracle recommends that you set the RESULT_CACHE_MODE parameter value to MANUAL, which happens to be the default setting. The RESULT_CACHE_MODE parameter is dynamic, so you can set this parameter with the ALTER SYSTEM (or the ALTER SESSION) command.
When you set the RESULT_CACHE_MODE parameter to the value MANUAL, the database caches the results of only specific queries—queries that you enable for caching by using either a query hint or a table annotation. The following example shows how to use the query hint method to specify a query's results to be cached in the server result cache.
SQL> select /*+ RESULT_CACHE */ prod_id, sum(amount_sold)

     from  sales

     group by prod_id

     order by prod_id;
The query hint /*+RESULT_CACHE */ tells the database to cache the results of the previous query. You can turn off the result caching for this query by using the /+ NO_RESULT_CACHE */ hint, as shown in the following example.
SQL> select /*+ NO_RESULT_CACHE */ prod_id, SUM(amount_sold)

     from  sales

     group by prod_id

     order by prod_id;
When you run this query, the server won't cache the results of this query any longer, because you've specified the MANUAL setting for the RESULT_CACHE_MODE initialization parameter.
The alternative way to specify the caching of a query's results is to use the table annotation method. Under this method, you specify the RESULT_CACHE attribute when you create a table or alter it. You can annotate a CREATE TABLE or ALTER TABLE statement with the RESULT_CACHE attribute in two different modes : DEFAULT or FORCE, as shown in the following examples:
SQL> create table stores (...) RESULT_CACHE (MODE DEFAULT);

SQL> alter table stores RESULT_CACHE (MODE FORCE);
We explain the implications of setting the RESULT_CACHE_MODE initialization parameter to FORCE in the “How it Works” section.
How It Works
If you set the value of the RESULT_CACHE_MODE parameter to FORCE, Oracle executes all subsequent queries only once. Upon subsequent executions of those queries, the database retrieves the results from the cache. Obviously, you don't want to store the results of each and every SQL statement, because of the performance implications, as well as the fact that the server result cache may run out of room. Thus Oracle recommends that you specify the MANUAL setting for the RESULT_CACHE_MODE parameter.
If you can set the result caching behavior with the use of SQL hints, why use table annotations? Table annotations are an easy way to specify caching without having to modify the application queries directly by adding the SQL hints. It's easier to simply issue an ALTER TABLE statement for a set of tables, to enable the caching of several queries that use that set of tables. Note that when you annotate a table, those annotations apply to the entire query, but not for fragments of that query.
If you annotate a table and specify a SQL hint for query caching, which method will Oracle choose to determine whether to cache a query's results? Query hints are given precedence by the database over table annotations. However, the relationship between SQL hints and table annotations is complex, and whether the database caches a query's results also depends on the specific value of the table annotation, as summarized in the following discussion.
Table Annotations and Query Hints
As mentioned earlier, you can use both SQL hints and table annotations to specify which query results you want the result cache to store, with hints overriding annotations. Use either the ALTER TABLE or the CREATE TABLE statements to annotate tables with the result cache mode. Here's the syntax for a CREATE or ALTER TABLE statement when annotating a table or a set of tables:
CREATE|ALTER TABLE [<schema>.]<table> ... [RESULT_CACHE (MODE {FORCE|DEFAULT})]
Note the following important points about table annotations:
- The mode value
DEFAULTis, of course, the default value, and this merely removes any table annotations you may have set and doesn't permit caching of results that involve this table. - If you set at least one table to the
DEFAULTmode, any query involving that table won't be allowed to store its results in the cache. - If you set all the tables in a query to the
FORCEmode, Oracle will always consider that query for caching—unless you turn off the caching with theNO_RESULT_CACHEhint within the query. - If you set at least one table in a query to
DEFAULTby annotating aCREATE TABLEstatement, as shown here, Oracle caches results of this query only if you've either set theRESULT_CACHE_MODEparameter toFORCEor specified theRESULT_CACHEhint.
SQL> CREATE TABLE sales (id number) RESULT_CACHE (MODE DEFAULT);
Note that the previous statement is equivalent to the following statement, because the default value of the attribute RESULT_CACHE is DEFAULT.
SQL> CREATE TABLE sales (id number);
You can check that the database created the table SALES with the RESULT_CACHE attribute set to the value DEFAULT:
SQL> select table_name, result_cache from user_tables where table_name ='SALES';


TABLE_NAME                     RESULT_

------------------------------ -------

SALES                          DEFAULT


SQL>
If you specify the table creation statement with the RESULT_CACHE(MODE FORCE) option, this will prevail over the MANUAL setting of the RESULT_CACHE_MODE initialization parameter that you've set at the session level. The following example illustrates how this works.
- First alter the table
STORESto specify theRESULT_CACHEattribute with theMODE FORCEoption:SQL> alter table stores result_cache (mode force); - Then ensure that you've set the
RESULT_CACHE_MODEinitialization parameter to the valueMANUAL. - Then execute the following query:
SQL> select prod_id, sum(amount_sold)

     from stores

     group by prod_id

     having prod_id=999;
On subsequent executions, the database will retrieve the results for the preceding query from the server result cache. The reason this is so is that when you specify the RESULT_CACHE (MODE FORCE) annotation, it overrides the MANUAL setting for the RESULT_CACHE_MODE parameter. Remember that when you set this parameter to the MANUAL mode, Oracle will cache query results only if you specify a query hint or annotation. The query shown here doesn't involve the use of a hint, but its results are cached because the RESULT_CACHE (MODE FORCE) annotation makes the database behave the same way as it does when the RESULT_CACHE_MODE parameter is set to FORCE—it caches the query results of all eligible queries.
Query hints, however, ultimately trump the RESULT_CACHE (MODE FORCE) annotation, as shown in the following example.
First alter the table STORES to specify the RESULT_CACHE attribute with the MODE FORCE option:
SQL> alter table stores result_cache (mode force);
Ensure that you've set the RESULT_CACHE_MODE initialization parameter to the value MANUAL.
Execute the following query:
SQL>select /*+ no_result_cache */ *

     from stores

     order by time_id desc;
In this example, even though you've annotated the STORES table to allow caching with the MODE FORCE option, the /*+ no_result_cache */ hint overrides the annotation and prevents the caching of the results of any query that involves the STORES table.
Requirements for Using the Result Cache
There are a few read consistency requirements that a query must satisfy, in order for the database to use the result cache:
- In cases involving a snapshot, if a read-consistent snapshot builds a result, it must retrieve the latest committed state of the data, or the query must use a flashback query to point to a specific point in time.
- Whenever a session transaction is actively referencing the tables or views in a query, the database won't cache the results from this query for read consistency purposes.
In addition to the read consistency requirements for result caching, the following objects or functions, when present in a query, make that query ineligible for caching:
CURRVALandNEXTVALpseudo columns- The
CURRENT_DATE,CURRENT_TIMESTAMP,USERENV_CONTEXT,SYS_CONTEXT(with non-constant variables),SYSDATE, andSYS_TIMESTAMP - Temporary tables
- Tables owned by
SYSandSYSTEM
3-10. Caching Client Result Sets
Problem
You use a lot of OCI applications that involve repetitive queries. You would like to explore how you can cache the result sets on the client.
Solution
You can enable client-side query caching of SQL query results by enabling the client result cache. The client result cache works similarly to the server result cache in many ways, but is separate from the server cache. You set the client result cache by setting the following initialization parameters:
CLIENT_RESULT_CACHE_SIZE: To enable the client result cache, set this parameter to 32 KB or higher, up to a maximum of 2 GB. By default, this parameter is set to zero, meaning the client query cache is disabled. Unlike in the case of the server result cache, theCLIENT_RESULT_CACHE_SIZEparameter value sets the maximum size of result set cache per process, not for the entire instance. Since this parameter isn't a dynamic one, a reset requires that you bounce the instance. You have to determine the size of this parameter based on the potential number of results that'll be cached, as well as the average size of the result set, which depends both on the size of the rows and the number of rows in the result set. Tip Oracle cautions you not to set the
 CLIENT_RESULT_CACHE_SIZEduring database creation, due to potential errors.CLIENT_RESULT_CACHE_LAG: This parameter lets you specify the maximum amount of time the client result cache can fall behind a change that affects the result set values. By default, the value of this parameter is set to 3,000 milliseconds, so you can omit this parameter if this time interval is adequate for you. Changes in this parameter also need a restart of the database, because it's a static parameter.
In addition, you must specify the value of the initialization parameter COMPATIBLE at 11.0.0 or higher to enable the client result cache. If you want to cache views on the client side, the value of the COMPATIBLE parameter must be 11.2.0.0 or higher.
In addition to the initialization parameters you must set on the database server, Oracle lets you also include an optional client-side configuration file to specify values that override the values of the client query cache–related parameters in the initialization file. If you specify any of these parameters, the value of that parameter will override the value of the corresponding parameter in the server initialization file. You can specify one or more of the following parameters in the optional client configuration file, which you can include in the sqlnet.ora file on the client:
OCI_RESULT_CACHE_MAX_SIZE: Maximum size (in bytes) for the query cache for each individual process
OCI_RESULT_CACHE_MAX_RSET_SIZE: Maximum size of a result set in bytes in any process
OCI_RESULT_CACHE_MAX_RSET_ROWS: Maximum size of the result set in terms of rows, in any process
You can't set any query cache lag–related parameters in the client-side file. Once you set the appropriate initialization parameters and the optional client-side configuration file, you must enable and disable queries for caching with either the /*+ result_cache +/ (and the /*+ no_result_cache +/) hint, or table annotations. Once you do this, the database will attempt to cache all eligible queries in the client query cache.
How It Works
You can deploy client-side query result caching to speed up the responses of queries that your database frequently executes in an OCI application. The database keeps the result set data consistent with any database changes, including session changes. You can potentially see a huge performance improvement for repetitive queries because the database retrieves the results from the local OCI client process rather than having to re-access the server via the network and re-execute the same query there and fetch those results. When an OCI application issues an OCIStmtExecute() or OCIStmtFetch() call, Oracle processes those calls locally on the client, if the query results are already cached in the client query cache.
The big advantage of using a client-side query cache is that it conserves your server memory usage and helps you scale up your applications to serve more processes. The client query cache is organized on a per-process basis rather than a per-session basis. Multiple client sessions can share the same cached result sets, all of which can concurrently access the same result sets through multiple threads and multiple statements. The cache automatically invalidates the cached result sets if an OCI process finds significant database changes on the database server. Once a result set is invalidated, the query will be executed again and a fresh result set is stored in the cache.
![]() Tip Oracle recommends that you use client-side caching only for read-only or mostly read-only queries.
Tip Oracle recommends that you use client-side caching only for read-only or mostly read-only queries.
You can optionally set the RESULT_CACHE_MODE parameter (see Recipe 3-7) to control caching behavior, but by default, this parameter is set to the value MANUAL, so you can leave it alone. You really don't want to set this parameter to its alternative value FORCE, which compels the database to cache the results of every eligible SQL query¬—obviously, the cache will run out of room before too long! You can then specify either the appropriate query hint at the SQL level or table annotations at the table level to control the client-side result caching. What if you've already set up server-side result caching through the server query cache? No matter. You can still enable client result caching. Just remember that by default, client-side caching is disabled and server-side result caching is enabled.
When implementing client query caching, it's important that an OCIStmtExecute() call is made so a statement handle can match a cached result. The very first OCIStmtExecute() call for an OCI statement handle goes to the server regardless of the existence of a cached result set. Subsequent OCIStmtExecute() calls will use the cached results if there's a match. Similarly, only the first OCIStmtFetch() call fetches rows until it gets the “Data Not Found” error—subsequent fetch calls don't need to fetch the data until they get this error, if the call matches the cached result set. Oracle recommends that your OCI applications either cache OCI statements or use statement caching for OCI statement handles, so they can return OCI statements that have already been executed. The cached set allows multiple accesses from OCI statement handles from single or multiple sessions.
As with the server-side cache, you can set the RESULT_CACHE_MODE parameter to FORCE to specify query caching for all queries. Oracle recommends you set this parameter to the alternative value of MANUAL and use SQL hints (/*+ result_cache */) in the SQL code the application passes to the OCIStmtPrepare(), and OCIStmtPrepare2() calls. You can also use table annotations, as explained in Recipe 3-7, to specify caching when you create or alter a table. All queries that include that table will follow the caching specifications subsequently.
You can query the V$CLIENT_RESULT_CACHE_STATS view for details such as the number of cached result sets, number of cached result sets invalidated, and the number of cache misses. The statistic Create Count Success, for example, shows the number of cached result sets the database didn't validate before caching all rows of the result set. The statistic Create Count Failure shows the number of the cached result sets that didn't fetch all rows in the result set.
3-11. Caching PL/SQL Function Results
Problem
You've set up a server query cache in your database and would like to implement the caching of certain PL/SQL function results.
Solution
Oracle's server query cache (Recipe 3-7) helps you cache both normal SQL query results as well as PL/SQL function results. By using the server result cache, you can instruct the database to cache the results of PL/SQL functions in the SGA. Other sessions can use these cached results, just as they can use cached query results with the query result cache. Once you've configured the server query cache by setting the appropriate initialization parameters (please see Recipe 3-7), you are ready to make use of this feature.
You must specify the RESULT_CACHE clause inside a function to make the database cache the function's results in the PL/SQL function result cache. When a session invokes a function after you enable caching, it first checks to see if the cache holds results for the function with identical parameter values. If so, it fetches the cached results and doesn't have to execute the function body. Note that if you declare a function first, you must also specify the RESULT_CACHE clause in the function declaration, in addition to specifying the clause within the function itself.
Listing 3-1 shows how to cache a PL/SQL function's results.
Listing 3-1. Creating a PL/SQL Function with the /*+result_cache*/ Hint
SQL> create or replace package store_pkg is

      type store_sales_record is record (

      store_name stores.store_name%TYPE,

     mgr_name   employees.last_name%type,

     store_size  PLS_INTEGER

     );

     function get_store_info (store_id PLS_INTEGER)

      RETURN store_info_record

      RESULT_CACHE;

     END store_pkg;

    /

Create or replace package body store_pkg is

    FUNCTION get_store_sales (store_id PLS_INTEGER)

    RETURN store_sales_record

    RESULT_CACHE RELIES_ON (stores, employees)

  IS

    rec  store_sales_record;

  BEGIN

    SELECT store_name INTO rec.store_name

    FROM stores

    WHERE store_id = store_id;

    SELECT e.last_name INTO rec.mgr_name

    FROM stores d, employees e

    WHERE d.store_id = store_id

    AND d.manager_id = e.employee_id;

     SELECT COUNT(*) INTO rec.store_size

    FROM EMPLOYEES

    WHERE store_id = store_id;

     RETURN rec;

  END get_store_sales;

END store_pkg;

/
Let's say you invoke the function with the following values:
SQL> execute store_pkg.get_store_sales(999)
The first execution will cache the PL/SQL function's results in the server result cache. Any future executions of this function with the same parameters (999) won't require the database to re-execute this function—it merely fetches the results from the server result cache.
Note that in addition to specifying the RESULT_CACHE clause in the function declaration, you can optionally specify the RESULT_CACHE RELIES ON clause in the function body, as we did in this example. In this case, specifying the RESULT_CACHE_RELIES_ON clause means that the result cache relies on the tables STORES and EMPLOYEES. What this means is that whenever these tables change, the database invalidates all the cached results for the get_store_info function.
How It Works
The PL/SQL function result cache uses the same server-side result cache as the query result cache, and you set the size of the cache using the RESULT_CACHE_MAX_SIZE and RESULT_CACHE_MAX_RESULT initialization parameters, with the first parameter fixing the maximum SGA memory that the cache can use, and the latter fixing the maximum percentage of the cache a single result can use. Unlike the query result cache, the PL/SQL function cache may quickly gather numerous results for caching, because the cache will store multiple values for the same function, based on the parameter values. If there's space pressure within the cache, older cached function results are removed to make room for new results.
Oracle recommends that you employ the PL/SQL function result cache to cache the results of functions that execute frequently but rely on static or mostly static data. The reason for specifying the static data requirement is simple: Oracle automatically invalidates cache results of any function whose underlying views or tables undergo committed changes. When this happens, the invocation of the function will result in a fresh execution.
Whenever you introduce a modified version of a package on which a result cache function depends (such as in Listing 3-1), the database is supposed to automatically flush that function's cached results from the PL/SQL function cache. In our example, when you hot-patch (recompile) the package store_pkg, Oracle technically must flush the cached results associated with the get_store_info function. However, sometimes the database may fail to automatically flush these results. In order to ensure that the cached results of the function are removed, follow these steps whenever you recompile a PL/SQL unit such as a package that includes a cache-enabled function.
- Place the result cache in the bypass mode.
SQL> execute DBMS_RESULT_CACHE.bypass(true); - Clear the cache with the
flushprocedure.SQL> execute DBMS_RESULT_CACHE.flush; - Recompile the package that contains the cache-enabled function.
SQL> alter package store_pkg compile; - Re-enable the result cache with the
bypassprocedure.SQL> execute DBMS_RESULT_CACHE.bypass(false);
![]() Tip If you're using both the SQL query cache and PL/SQL function result cache simultaneously, remember that both caches are actually part of the same server query cache. In cases such as this, ensure that you've sized the
Tip If you're using both the SQL query cache and PL/SQL function result cache simultaneously, remember that both caches are actually part of the same server query cache. In cases such as this, ensure that you've sized the RESULT_CACHE_SIZE parameter high enough to hold cached results from both SQL queries and PL/SQL functions.
If you're operating in an Oracle RAC environment, you must run the cache enabling and disabling steps on each RAC instance.
Of course, when you bypass the cache temporarily in this manner, during that time the cache is bypassed, the database will execute the function, instead of seeking to retrieve its results from the cache. The database will also bypass the result cache on its own for a function if a session is in the process of performing a DML statement on a table or view that the function depends on. This automatic bypassing of the result cache by the database ensures that users won't see uncommitted changes of another session in their own session, thus ensuring read consistency.
You can use the V$RESULT_CACHE_STATISTICS, V$RESULT_CACHE_MEMORY, V$RESULT_CACHE_OBJECTS, and V$RESULT_CACHE_DEPENDENCY views to monitor the usage of the server result cache, which includes both the SQL result cache as well as the PL/SQL function result cache.
Important Considerations
While a PL/SQL function cache gets you results much faster than repetitive execution of a function, PL/SQL collections (arrays)–based processing could be even faster because the PL/SQL runtime engine gets the results from the collection cache based in the PGA rather than the SGA. However, since this requires additional PGA memory for each session, you'll have problems with the collections approach as the number of sessions grows large. The PL/SQL function is easily shareable by all concurrent sessions, whereas you can set up collections for sharing only through additional coding.
You must be alert to the possibility that if your database undergoes frequent DML changes, the PL/SQL function cache may not be ideal for you—it's mostly meant for data that never changes, or does so only infrequently. Even if you set the RESULT_CACHE_REMOTE_EXPIRATION parameter to a high value, any DML changes will force the database to invalidate the cached PL/SQL function cache result sets.
Oracle will invalidate result cache output when it becomes out of date, so when a DML statement modifies the rows of a table that is part of a PL/SQL function that you've enabled for the function cache, the database invalidates the cached results of that function. This could happen if the specific rows that were modified aren't part of the PL/SQL function result set. Again, remember that this limitation could be “bypassed” by using the PL/SQL function cache in databases that are predominantly read-only.
Restrictions on the PL/SQL Function Cache
In order for its results to be cached, a fuction must satisfy the following requirements:
- The function doesn't use an
OUTor anIN OUTparameter. - An
INparameter of a function has one of these types:BLOB,CLOB,NCLOB,REF CURSOR, Collection Object, and Record. - The function isn't a pipelined table function.
- The function isn't part of an anonymous block.
- The function isn't part of any module that uses invoker's rights as opposed to definer's rights.
- The function's return type doesn't include the following types:
BLOB,CLOB,NCLOB,REF CURSOR, Object, Record, or a PL/SQL collection that contains one of the preceding unsupported return types.
3-12. Configuring the Oracle Database Smart Flash Cache
Problem
Your AWR (Automatic Workload Repository) report indicates that you need a much larger buffer cache. You also notice that the shared pool is sized correctly, and so you can't set a higher minimum level for the buffer cache by reducing the shared pool memory allocation. In addition, you're limited in the amount of additional memory you can allocate to Oracle.
Solution
Depending on your operating system, you can use the new Oracle Database Smart Flash Cache feature, in cases where the database indicates that it needs a much larger amount of memory for the buffer cache. Right now, the Flash Cache feature is limited to Solaris and Oracle Linux operating systems.
Set the following parameters to turn the Flash Cache feature on:
DB_FLASH_CACHE_FILE: This parameter sets the pathname and the file name for the flash cache. The file name you specify will hold the flash cache. You must use a flash device for the flash cache file, and it could be located in the operating system file system, a raw disk, or an Oracle ASM disk group—for example:DB_FLASH_CACHE_FILE= "/dev/sdc"
DB_FLASH_CACHE_FILE = "/export/home/oracle/file_raw" /* raw file
DB_FLASH_CACHE_FILE = "+dg1/file_asm" /* using ASM storage- DB_FLASH_CACHE_SIZE: This parameter sets the size of the flash cache storage. Here's an example:
DB_FLASH_CACHE_SIZE = 8GB
You can toggle between a system with a flash cache and one without, by using the alter system command as shown here:
SQL> alter system set db_flash_cache_size = 0;       /* disables the flash cache

SQL> alter system set db_flash_cache_size = 8G;      /* reenables the flash cache
Note that although you can successfully enable and disable the flash cache dynamically as shown here, Oracle doesn't support this method.
![]() Note If you're using Oracle RAC, in order to utilize the Flash Cache feature, you must enable it on all the nodes of the cluster.
Note If you're using Oracle RAC, in order to utilize the Flash Cache feature, you must enable it on all the nodes of the cluster.
How It Works
Oracle Database Smart Flash Cache, a feature of the Oracle Database 11.2 release, is included as part of the enterprise edition of the database server. Flash Cache takes advantage of the I/O speed of flash-based devices, which perform much better than disk-based storage. For example, small disk-based reads offer a 4-millisecond response, whereas a flash-based device takes only 0.4 milliseconds to perform the same read.
Note that Flash Cache is really a read-only cache—when clean (unmodified) data blocks are evicted from the buffer cache due to space pressure, those blocks are then moved to the flash cache. If they're required later on, the database will move transferred data blocks back to the SGA from the flash cache. It's not always realistic to assume that you and the Oracle database will have access to unlimited memory. What if you can allocate only a maximum of 12 GB for your Oracle SGA, but it turns out that if you have 50 GB of memory, the database will run a whole lot faster? Oracle Database Smart Flash Cache is designed for those types of situations.
Oracle recommends that you size the flash cache to a value that's a multiple of your buffer cache size. There's no hard and fast rule here: use a trial and error method by just setting it to anywhere between one and ten times the size of the buffer cache size and calibrate the results. Oracle also suggests that if you encounter the db file sequential read wait event as a top wait event and if you have sufficient CPU capacity, you should consider using the flash cache.
Once you enable the flash cache, Oracle moves data blocks from the buffer cache to the flash cache (the file you've created) and saves metadata about the blocks in the database buffer cache. Depending on the number of blocks moved into the flash cache, you may want to bump up the size of the MEMORY_TARGET parameter so the accumulated metadata doesn't impact the amount of memory left for the other components.
Oracle offers two devices for flash cache storage—Sun Storage F5100 Flash Array and the Sun Flash Accelerator F20 PCIe Card. Since you can specify only a single flash device, you will need a volume manager. It turns out that Oracle ASM is the best volume manager for these devices, based on Oracle's tests.
If you're using the flash cache in an Oracle RAC environment, you must create a separate flash cache file path for each of the instances, and you will also need to create a separate ASM disk group for each instance's flash cache.
Oracle testing of the Database Smart Flash Cache feature shows that it's ideally suited for workloads that are I/O bound. If you have a very heavy amount of concurrent read-only transactions, the disk system could be saturated after some point. Oracle Database Smart Flash Cache increases such a system's throughput by processing more IOPS (I/O per second). Oracle's testing results of this feature also show that response times increased by five times when Smart Flash Cache was introduced to deal with workloads facing significant performance deterioration due to maxing out of their disk I/O throughput. As of the writing of this book, Oracle makes these claims only for workloads that are exclusively or mostly read-only operations. While Oracle is still in the process of testing the flash cache for write-intensive workloads, note that even for read-only operations, the reduced load on your disk system due to using the flash cache will mean that you'll have more I/O bandwidth to handle your writes.
3-13. Tuning the Redo Log Buffer
Problem
You'd like to know how to tune the redo log buffer, as you've reviewed several AWR reports that pointed out that the redo log buffer setting for your production database is too small.
Solution
You configure the size of the redo log buffer by setting the value of the initialization parameter LOG_BUFFER. This parameter is static, so any changes to it require a restart of the database. You set the parameter in your init.ora file as follows:
log_buffer=4096000
You can also change the size of the log buffer, with the following ALTER SYSTEM statement:
SQL> alter system set log_buffer=4096000 scope=spfile;


System altered

SQL>
The default value of the LOG_BUFFER parameter is way too small for many databases. Oracle states that you don't normally need to set a value larger than 1 MB for this parameter. However, you shouldn't hesitate to raise it to a much larger amount, if it's warranted by circumstances.
How It Works
When the Oracle server processes change data blocks in the buffer cache, those changes are written to the redo logs in the form of redo log entries, before they are written to disk. The redo log entries enable the database to redo or reconstruct the database changes by using various operations such as INSERT, UPDATE, and DELETE, as well as DDL operations. The Oracle redo logs are thus critical for any database recovery, because it's these redo log entries that enable the database to apply all the changes made to the database from a point in time in the past. The changed data doesn't directly go to the redo logs, however; Oracle first writes the changes to a memory area called the redo log buffer. It's the value of this memory buffer that you can configure with the LOG_BUFFER parameter. The Oracle log writer (LGWR) process writes the redo log buffer entries to the active redo log file (or group of files). LGWR flushes the contents of the buffer to disk whenever the buffer is one-third full, or if the database writer requests the LGWR to write to the redo log file. Also, upon each COMMIT or ROLLBACK by a server process, the LGWR process writes the contents of the buffer to the redo log file on disk.
The redo log buffer is a re-usable cache, so as entries are written out to the redo log file, user processes copy new entries into the redo log buffer. While the LGWR usually works fast enough so there's space in the buffer, a larger buffer will always have more room for new entries. Since there's no cost whatsoever to increasing the LOG_BUFFER size, feel free to set it to higher than the suggested maximum of 1 MB for this parameter.
If your database is processing large updates, the LGWR has to frequently flush the redo log buffer to the redo log files even in the absence of a COMMIT statement, so as to keep the buffer no more than a third full. Raising the size of the redo log buffer is an acceptable solution in this situation, and allows the LGWR to catch up with the heavy amount of entries into the redo log buffer. This also offsets a slow I/O system in some ways, if you think the performance of the LGWR process is not fast enough. There are a couple of ways in which you keep the pressure on the redo log buffer down: you can batch COMMIT operations for all batch jobs and also specify the NOLOGGING option where possible, say during regular data loads. When you specify the NOLOGGING option during a data load, Oracle doesn't need to use the redo log files, and hence it also bypasses the redo log buffer as well.
It's fairly easy to tune the size of the LOG_BUFFER parameter. Just execute the following statement to get the current “redo log space request ratio”:
SQL> select round(t.value/s.value,5) "Redo Log Space Request Ratio"

     from v$sysstat s, v$sysstat t

     where s.name = 'redo log space requests'

     and t.name = 'redo entries'
The redo log space request ratio is simply the ratio of total redo log space requests to redo entries. You can also query the V$SYSSTAT view to find the value of the statistic redo buffer allocation retries. This statistic shows the number of times processes waited for space in the redo log buffer:
SQL> select name,value from V$SYSSTAT

     where name= 'redo buffer allocation retries';
Execute this SQL query multiple times over a period of time. If the value of the “redo buffer allocation retries” statistic is rising steadily over this period, it indicates that the redo log buffer is under space pressure and as a result, processes are waiting to write their redo log entries to the redo log buffer. You must increase the size of the redo log buffer if you continue to see this.