
C H A P T E R 4
Monitoring System Performance
Monitoring system and database performance is a complex task, and there can be many aspects to managing performance, including memory, disk, CPU, database objects, and database user sessions—just for starters. This chapter zeroes in on using Oracle’s Automatic Workload Repository (AWR) to gather data about the activities occurring within your database, and help convert that raw data into useful information to help gauge performance within your database for a specific period of time. Usually, when there are performance issues occurring within a database, it's easy to know when the performance problems are occurring because database activity is “slow” during that given time frame. Knowing this time frame is the starting point to perform the analysis using the AWR information.
The AWR is created automatically when you create your Oracle database, and automatically gathers statistics on the activities occurring within your database. Some of this data is real-time or very near real-time, and some of the data represents historical statistics on these activities. The most current data on active sessions is stored in the Active Session History (ASH) component of the performance statistics repository. The more historical snapshots of data are generally known as the AWR snapshots.
The AWR process captures hourly snapshots by default from Oracle's dynamic performance views, and stores them within the AWR. This gives the DBA the ability to view database activity over any period of time, whether it is a single-hour time frame, up to all activity that is stored within the AWR. For instance, if you have a period of time where your database is performing poorly, you can generate an AWR report that will give statistics on the database activity for only that specific period of time.
The ASH component of the AWR is really meant to give the DBA a more real-time look at session information that is not captured within the AWR snapshots. The session information stored within the ASH repository is data that is sampled every second from the dynamic performance views.
Oracle has had similar information within the database for many years with its predecessors UTLBSTAT/UTLESTAT and Statspack, but the report data hasn't been generated or saved automatically until AWR came along with Oracle 10g. This information can now help monitor your database performance much more easily, whether it be analyzing real-time data on activities currently going on within your database, or historical information that could be days, weeks, or even months old, depending on the configuration of the AWR within your database.
4-1. Implementing Automatic Workload Repository (AWR)
Problem
You want to store historical database performance statistics on your database for tuning purposes.
Solution
By implementing and using the Automatic Workload Repository (AWR) within your database, Oracle will store interval-based historical statistics in your database for future reference. This information can be used to see what was going on within your database within a given period of time. By default, the AWR should be enabled within your database. The key initialization parameter to validate is the STATISTICS_LEVEL parameter:
SQL> show parameter statistics_level


NAME                                 TYPE     VALUE

------------------------------------ -------- ------------------------------

statistics_level                     string   TYPICAL
This parameter can be set to BASIC, TYPICAL (which is the default), and ALL. As long as the parameter is set to TYPICAL or ALL, statistics will be gathered for the AWR. If the parameter is set to BASIC, you simply need to modify the parameter in order to start gathering AWR statistics for your database:
alter system set statistics_level=TYPICAL scope=both;
How It Works
The predecessor of AWR, which is Statspack, requires manual setup and configuration to enable the statistics gathering. As stated, there generally is no setup required, unless the STATISTICS_LEVEL parameter has been changed to the BASIC setting. By default, an AWR snapshot is taken every hour on your database, and is stored, by default, for eight days. These are configurable settings that can be modified, if desired. See Recipe 4-2 for information on modifying the default settings of the AWR snapshots.
In addition to simply seeing the value of the STATISTICS_LEVEL parameter, you can also view the V$STATISTICS_LEVEL view to see this information, which has information on the STATISTICS_LEVEL setting, as well as all other relevant statistical components within your database:
SELECT statistics_name, activation_level, system_status

FROM v$statistics_level;


STATISTICS_NAME                          ACTIVAT SYSTEM_S

---------------------------------------- ------- --------

Buffer Cache Advice                      TYPICAL ENABLED

MTTR Advice                              TYPICAL ENABLED

Timed Statistics                          TYPICAL ENABLED

Timed OS Statistics                      ALL     DISABLED

Segment Level Statistics                 TYPICAL ENABLED

PGA Advice                               TYPICAL ENABLED

Plan Execution Statistics                ALL     DISABLED

Shared Pool Advice                       TYPICAL ENABLED

Modification Monitoring                  TYPICAL ENABLED

Longops Statistics                       TYPICAL ENABLED

Bind Data Capture                        TYPICAL ENABLED

Ultrafast Latch Statistics               TYPICAL ENABLED

Threshold-based Alerts                   TYPICAL ENABLED

Global Cache Statistics                  TYPICAL ENABLED

Active Session History                   TYPICAL ENABLED
Undo Advisor, Alerts and Fast Ramp up    TYPICAL ENABLED

Streams Pool Advice                      TYPICAL ENABLED

Time Model Events                        TYPICAL ENABLED

Plan Execution Sampling                  TYPICAL ENABLED

Automated Maintenance Tasks              TYPICAL ENABLED

SQL Monitoring                           TYPICAL ENABLED

Adaptive Thresholds Enabled              TYPICAL ENABLED

V$IOSTAT_* statistics                    TYPICAL ENABLED

Session Wait Stack                       TYPICAL ENABLED


24 rows selected.
The type of information that is stored in the AWR includes the following:
- Statistics regarding object access and usage
- Time model statistics
- System statistics
- Session statistics
- SQL statements
The information gathered is then grouped and formatted by category. Some of the categories found on the report include the following:
- Instance efficiency
- Top 5 timed events
- Memory and CPU statistics
- Wait information
- SQL statement information
- Miscellaneous operating system and database statistics
- Database file and tablespace usage information
![]() Note To use AWR functionality, the following must apply. First, you must be licensed for the Oracle Diagnostics Pack, otherwise you need to use Statspack. Second, the
Note To use AWR functionality, the following must apply. First, you must be licensed for the Oracle Diagnostics Pack, otherwise you need to use Statspack. Second, the CONTROL_MANAGEMENT_PACK_ACCESS parameter must be set to DIAGNOSTIC+TUNING or DIAGNOSTIC.
4-2. Modifying the Statistics Interval and Retention Periods
Problem
You need to set an interval or retention period for your AWR snapshots to values other than the default.
Solution
By using the DBMS_WORKLOAD_REPOSITORY PL/SQL package, you can modify the default snapshot settings for your database. In order to first validate your current retention and interval settings for your AWR snapshots, run the following query:
SQL> column awr_snapshot_retention_period format a40

SQL> SELECT EXTRACT(day from retention) || ':' ||

       EXTRACT(hour from retention) || ':' ||

       EXTRACT (minute from retention)  awr_snapshot_retention_period,

       EXTRACT (day from snap_interval) *24*60+

       EXTRACT (hour from snap_interval) *60+

       EXTRACT (minute from snap_interval) awr_snapshot_interval

FROM dba_hist_wr_control;


AWR_SNAPSHOT_RETENTION_PERIOD  AWR_SNAPSHOT_INTERVAL

------------------------------ ---------------------

8:13:45                                           60
The retention period output just shown is in day:hour:minute format. So, our current retention period is 8 days, 13 hours, and 45 minutes. The interval, or how often the AWR snapshots will be gathered, is 60 minutes in the foregoing example. To then modify the retention period and interval settings, you can use the MODIFY_SNAPSHOT_SETTINGS procedure of the DBMS_WORKLOAD_REPOSITORY package. To change these settings for your database, issue a command such as the following example, which modifies the retention period to 30 days (specified by number of minutes), and the snapshot interval at which snapshots are taken to 30 minutes. Of course, you can choose to simply set one parameter or the other, and do not have to change both settings. The following example shows both parameters simply for demonstration purposes:
SQL> exec DBMS_WORKLOAD_REPOSITORY.MODIFY_SNAPSHOT_SETTINGS(retention=>43200, interval=>30);


PL/SQL procedure successfully completed.
You can then simply rerun the query from the DBA_HIST_WR_CONTROL data dictionary view in order to validate that your change is now in effect:
SQL> /


AWR_SNAPSHOT_RETENTION_PERIOD            AWR_SNAPSHOT_INTERVAL

---------------------------------------- ---------------------

30:0:0                                                      30
How It Works
It is generally a good idea to modify the default settings for your database, as eight days of retention is often not enough when diagnosing possible database issues or performing database tuning activities on your database. If you have been notified of a problem for a monthly process, for example, the last time frame that denoted an ordinary and successful execution of the process would no longer be available, unless snapshots were stored for the given interval. Because of this, it is a good idea to store a minimum of 45 days of snapshots, if at all possible, or even longer if storage is not an issue on your database. If you want your snapshots to be stored for an unlimited amount of time, you can specify a zero value, which tells Oracle to keep the snapshot information indefinitely (actually, for 40,150 days, or 110 years). See the following example:
SQL> exec DBMS_WORKLOAD_REPOSITORY.MODIFY_SNAPSHOT_SETTINGS(retention=>0);


PL/SQL procedure successfully completed.


SQL> /


AWR_SNAPSHOT_RETENTION_PERIOD            AWR_SNAPSHOT_INTERVAL

---------------------------------------- ---------------------

40150:0:0                                                   30
The default snapshot interval of one hour is usually granular enough for most databases, as when there are more frequent or closer to real-time needs, you can use the Active Session History (ASH) information. By increasing the default snapshot interval to greater than one hour, it can actually make it more difficult to diagnose performance issues, as statistics for the increased window may make it harder to distinguish and identify performance issues for a given time period.
4-3. Generating an AWR Report Manually
Problem
You want to generate an AWR report, and know the time frame on which to gather information.
Solution
In order to generate an AWR report, run the awrrpt.sql script found under the $ORACLE_HOME/rdbms/admin directory. In this example, we needed to enter information for the following:
- Report type (text or html)
- Number of days you want displayed from which to choose snapshots
- The starting snapshot number for the period on which you want to generate a report
- The ending snapshot number for the period on which you want to generate a report
- The name of the report (enter a name if you do not want the default report name and location)
The lines in bold type here denote points where user input is required:
$ sqlplus / as sysdba @awrrpt


Current Instance

~~~~~~~~~~~~~~~~

   DB Id    DB Name      Inst Num Instance

----------- ------------ -------- ------------

2334201269 ORCL               1 ORCL


Specify the Report Type

~~~~~~~~~~~~~~~~~~~~~~~

Would you like an HTML report, or a plain text report?

Enter 'html' for an HTML report, or 'text' for plain text

Defaults to 'html'

Enter value for report_type: text


Type Specified:  text


Instances in this Workload Repository schema

~~~~~~~~~~~~~~~~~~~~~~~~~~~~~~~~~~~~~~~~~~~~


   DB Id     Inst Num DB Name      Instance     Host

------------ -------- ------------ ------------ ------------

* 2334201269        1 ORCL         ORCL         ora


Using 2334201269 for database Id

Using          1 for instance number


Specify the number of days of snapshots to choose from

~~~~~~~~~~~~~~~~~~~~~~~~~~~~~~~~~~~~~~~~~~~~~~~~~~~~~~

Enter value for num_days: 7

Listing the last 7 days of Completed Snapshots


                                                        Snap

Instance     DB Name        Snap Id    Snap Started    Level

------------ ------------ --------- ------------------ -----

ORCL         ORCL               257 28 May 2011 00:00      2


                                258 28 May 2011 13:39      2

                                259 28 May 2011 15:00      2

                                260 28 May 2011 16:00      2

                                261 28 May 2011 17:00      2

                                262 28 May 2011 18:00      2

                                263 28 May 2011 19:00      2

                                264 28 May 2011 20:00      2
                                265 28 May 2011 21:00      2

                                266 28 May 2011 22:00      2

                                267 28 May 2011 23:00      2

                                268 29 May 2011 00:00      2


                                269 29 May 2011 11:52      2

                                270 29 May 2011 13:00      2

                                271 29 May 2011 14:00      2

                                272 29 May 2011 15:00      2

                                273 29 May 2011 16:00      2

                                274 29 May 2011 17:00      2


                                275 30 May 2011 17:00      2

                                276 30 May 2011 18:00      2

                                277 30 May 2011 19:00      2

                                278 30 May 2011 20:00      2


Specify the Begin and End Snapshot Ids

~~~~~~~~~~~~~~~~~~~~~~~~~~~~~~~~~~~~~~

Enter value for begin_snap: 258

Begin Snapshot Id specified: 258


Enter value for end_snap: 268

End   Snapshot Id specified: 268


Specify the Report Name

~~~~~~~~~~~~~~~~~~~~~~~

The default report file name is awrrpt_1_258_268.txt.  To use this name,

press <return> to continue, otherwise enter an alternative.


Enter value for report_name: /tmp/awrrpt_1_258_268.txt


Using the report name /tmp/awrrpt_1_258_268.txt


< Output of report is shown across the screen >


End of Report

Report written to /tmp/awrrpt_1_258_268.txt
How It Works
In the foregoing example, note that between some of the snapshots listed there is a blank line. Since we are getting information based on the dynamic performance views of the data dictionary, you cannot specify a snapshot period that spans bounces of the database instance, as all statistics in the dynamic performance views are lost when a database instance is shut down. Therefore, choose a snapshot period only for the life of an instance; otherwise you can experience the following error:
Enter value for begin_snap: 274

Begin Snapshot Id specified: 274


Enter value for end_snap: 275

End   Snapshot Id specified: 275


declare

*

ERROR at line 1:

ORA-20200: The instance was shutdown between snapshots 274 and 275

ORA-06512: at line 42
Although it is recommended to use the awrrpt.sql script to generate the desired AWR report, you can manually use the AWR_REPORT_TEXT or AWR_REPORT_HTML functions within the DBMS_WORKLOAD_REPOSITORY package to generate an AWR report, if needed. You need to also have your database's DBID and instance number handy as well when running either of these functions. See the following for an example:
SELECT  dbms_workload_repository.awr_report_text

        (l_dbid=>2334201269,l_inst_num=>1,l_bid=>258,l_eid=>268)

FROM dual;
4-4. Generating an AWR Report via Enterprise Manager
Problem
You want to generate an AWR report from within Enterprise Manager.
Solution
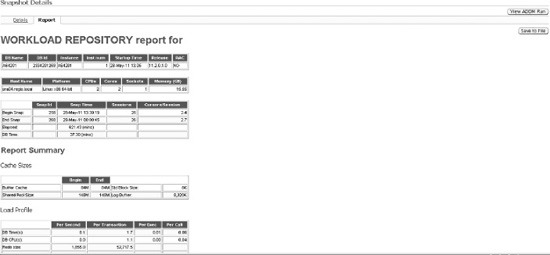
Within Enterprise Manager, depending on your version, the manner in which to generate an AWR report may differ. There is also generally more than one way to generate an AWR report. In Figure 4-1, this particular screen shows that you enter the beginning and ending snapshot ranges, and after you click the Generate Report button, an AWR HTML report will immediately be displayed within your browser window. A sample screen of the resulting AWR report is shown in Figure 4-2.
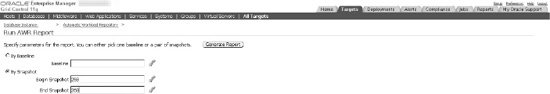
Figure 4-1. Generating an AWR report within Enterprise Manager
How It Works
The AWR report via Enterprise Manager can be generated if you have Database Control configured, or if you are using Grid Control. You need to be licensed for the Oracle Diagnostics Pack in order to be able to use this feature.
4-5. Generating an AWR Report for a Single SQL Statement
Problem
You want to see statistics for a single SQL statement, and do not want all other associated statistics generated from an AWR report.
Solution
You can run the awrsqrpt.sql script, which is very similar to awrrpt.sql. You will be prompted for all of the same information, except you will have an additional prompt for a specific SQL ID value—for example:
Specify the SQL Id

~~~~~~~~~~~~~~~~~~

Enter value for sql_id: 5z1b3z8rhutn6

SQL ID specified:  5z1b3z8rhutn6
The resulting report zeroes in on information specifically for your SQL statement, including CPU Time, Disk Reads, and Buffer Gets. It also gives a detailed execution plan for review. See the following snippet from the report:
Stat Name                                Statement   Per Execution % Snap

---------------------------------------- ---------- -------------- -------

Elapsed Time (ms)                           210,421      105,210.3     9.4

CPU Time (ms)                                22,285       11,142.3     1.6

Executions                                        2            N/A     N/A

Buffer Gets                               1,942,525      971,262.5    12.5

Disk Reads                                1,940,578      970,289.0    14.0

Parse Calls                                       9            4.5     0.0

Rows                                              0            0.0     N/A

User I/O Wait Time (ms)                     195,394            N/A     N/A

Cluster Wait Time (ms)                            0            N/A     N/A

Application Wait Time (ms)                        0            N/A     N/A

Concurrency Wait Time (ms)                        0            N/A     N/A

Invalidations                                     0            N/A     N/A

Version Count                                     2            N/A     N/A

Sharable Mem(KB)                                 22            N/A     N/A


Execution Plan

-------------------------------------------------------------------------------------------

| Id  | Operation            | Name     | Rows  | Bytes | Cost (%CPU)| Time     |PQ Dis

--------------------------------------------------------------------------------------------

|   0 | SELECT STATEMENT     |          |       |       | 73425 (100)|          |

|   1 |  PX COORDINATOR      |          |       |       |            |          |

|   2 |   PX SEND QC (RANDOM)| :TQ10000 |     1 |    39 | 73425   (1)| 00:14:42 | P->S

|   3 |    PX BLOCK ITERATOR |          |     1 |    39 | 73425   (1)| 00:14:42 | PCWC

|   4 |     TABLE ACCESS FULL| EMPPART  |     1 |    39 | 73425   (1)| 00:14:42 | PCWP

--------------------------------------------------------------------------------------------


Full SQL Text


SQL ID       SQL Text

------------ ------------------------------------------------------------------

5z1b3z8rhutn /* SQL Analyze(98, 0) */ select * from emppart where empno > 12345
How It Works
Utilizing this feature is a handy way to get historical statistics for a given SQL statement. For current statements, you can continue to use other mechanisms such as AUTOTRACE, but after a SQL statement has been run, using the awrsqrpt.sql script provides an easy mechanism to help analyze past run statements and help retroactively tune poorly performing SQL statements.
4-6. Creating a Statistical Baseline for Your Database
Problem
You want to establish baseline statistics that represent a normal view of database operations.
Solution
You can create AWR baselines in order to establish a saved workload view for your database, which can be used later for comparison to other AWR snapshots. The purpose of a baseline is to establish a normal workload view of your database for a predefined time period. Performance statistics for an AWR baseline are saved in your database, and are not purged automatically. There are two types of baselines—fixed and moving.
Fixed Baselines
The most common type of baseline is called a fixed baseline. This is a single, static view that is meant to represent a normal system workload. To manually create an AWR baseline, you can use the CREATE_BASELINE procedure of the DBMS_WORKLOAD_REPOSITORY PL/SQL package. The following example illustrates how to create a baseline based on a known begin and end date and time for which the baseline will be created:
SQL> exec dbms_workload_repository.create_baseline -

    (to_date('2011-06-01:00:00:00','yyyy-mm-dd:hh24:mi:ss'), -

    to_date('2011-06-01:06:00:00','yyyy-mm-dd:hh24:mi:ss'),'Batch Baseline #1'),


PL/SQL procedure successfully completed.
For the foregoing baseline, we want to establish a normal workload for a data warehouse batch window, which is between midnight and 6 a.m. This baseline will be held indefinitely unless explicitly dropped (see Recipe 4-7 for managing AWR baselines). Any fixed baseline you create stays in effect until a new baseline is created. If you want to have a set expiration for a baseline, you can simply specify the retention period for a baseline when creating it by using the EXPIRATION parameter, which is specified in days:
exec dbms_workload_repository.create_baseline( -

start_time=>to_date('2011-06-01:00:00:00','yyyy-mm-dd:hh24:mi:ss'), -

end_time=>to_date('2011-06-01:06:00:00','yyyy-mm-dd:hh24:mi:ss'), -

baseline_name=>'Batch Baseline #1', -

expiration=>30);
You can also create a baseline based on already created AWR snapshot IDs. In order to do this, you could run the CREATE_BASELINE procedure as follows:
exec dbms_workload_repository.create_baseline( -

start_snap_id=>258,end_snap_id=>268,baseline_name=>'Batch Baseline #1', -

expiration=>30);
Moving Baselines
Like the fixed baseline, the moving baseline is used to capture metrics over a period of time. The big difference is the metrics for moving baselines are captured based on the entire AWR retention period. For instance, the default AWR retention is eight days (see Recipe 4-2 on changing the AWR retention period). These metrics, also called adaptive thresholds, are captured based on the entire eight-day window. Furthermore, the baseline changes with each passing day, as the AWR window for a given database moves day by day. Because of this, the metrics over a given period of time can change as a database evolves and performance loads change over time. A default moving baseline is automatically created—the SYSTEM_MOVING_BASELINE. It is recommended to increase the default AWR retention period, as this may give a more complete set of metrics on which to accurately analyze performance. The maximum size of the moving window is the AWR retention period. To modify the moving window baseline, use the MODIFY_BASELINE_WINDOW_SIZE procedure of the DBMS_WORKLOAD_REPOSITORY package, as in the following example:
SQL>  exec dbms_workload_repository.modify_baseline_window_size(30);


PL/SQL procedure successfully completed.
How It Works
Setting the AWR retention period is probably the most important thing to configure when utilizing the moving baseline, as all adaptive threshold metrics are based on information from the entire retention period. When setting the retention period for the moving baseline, remember again that it cannot exceed the AWR retention period, else you may get the following error:
SQL> exec dbms_workload_repository.modify_baseline_window_size(45);

BEGIN dbms_workload_repository.modify_baseline_window_size(45); END;

*

ERROR at line 1:

ORA-13541: system moving window baseline size (3888000) greater than retention

(2592000)

ORA-06512: at "SYS.DBMS_WORKLOAD_REPOSITORY", line 686

ORA-06512: at line 1
If you set your AWR retention to an unlimited value, there still is an upper bound to the moving baseline retention period, and you could receive the following error if you set your moving baseline retention period too high, and your AWR retention period is set to unlimited:
exec dbms_workload_repository.modify_baseline_window_size(92);

BEGIN dbms_workload_repository.modify_baseline_window_size(92); END;

*

ERROR at line 1:

ORA-13539: invalid input for modify baseline window size (window_size, 92)

ORA-06512: at "SYS.DBMS_WORKLOAD_REPOSITORY", line 686

ORA-06512: at line 1
For fixed baselines, the AWR retention isn't a factor, and is a consideration only based on how far back in time you want to compare a snapshot to your baseline. After you have set up any baselines, you can get information on baselines from the data dictionary. To get information on the baselines in your database, you can use a query such as the following one, which would show you any fixed baselines you have configured, as well as the automatically configured moving baseline:
  SELECT baseline_name, start_snap_id start_id,

         TO_CHAR(start_snap_time, 'yyyy-mm-dd:hh24:mi') start_time,

         end_snap_id end_id,

         TO_CHAR(end_snap_time, 'yyyy-mm-dd:hh24:mi') end_time,

         expiration

  FROM dba_hist_baseline

  ORDER BY baseline_id;


BASELINE_NAME          START_ID START_TIME           END_ID END_TIME         EXPIRATION

-------------------- ---------- ---------------- ---------- ---------------- ----------

SYSTEM_MOVING_WINDOW        255 2011-05-27:22:00        358 2011-06-08:22:00

Batch Baseline #1           258 2011-05-28:13:39        268 2011-05-29:00:00      30
From the foregoing results, the moving baseline includes the entire range of snapshots based on the AWR retention period; therefore the expiration is shown as NULL. You can get similar information by using the SELECT_BASELINE_DETAILS function of the DBMS_WORKLOAD_REPOSITORY package. You do need the baseline_id number to pass into the function to get the desired results:
SELECT start_snap_id, start_snap_time, end_snap_id, end_snap_time,

       pct_total_time pct  FROM (SELECT * FROM

       TABLE(DBMS_WORKLOAD_REPOSITORY.select_baseline_details(12)));


START_SNAP_ID START_SNAP_TIME           END_SNAP_ID END_SNAP_TIME                 PCT

------------- ------------------------- ----------- ------------------------- ----------

          258 28-MAY-11 01.39.19.296 PM         268 29-MAY-11 12.00.45.211 AM     100
To get more specific information on the moving baseline in the database, you are drilling down into the statistics for the adaptive metrics. For instance, to see an average and maximum for each metric related to reads based on the moving window, you could use the following query:
column metric_name format a50

SELECT metric_name, average, maximum FROM

(SELECT * FROM TABLE

(DBMS_WORKLOAD_REPOSITORY.select_baseline_metric('SYSTEM_MOVING_WINDOW')))

where lower(metric_name) like '%read%'

order by metric_name;


METRIC_NAME                                           AVERAGE    MAXIMUM

-------------------------------------------------- ---------- ----------

Average Synchronous Single-Block Read Latency      .159658155 53.8876404

Consistent Read Changes Per Sec                    2.99232446 3984.11246

Consistent Read Changes Per Txn                    117.812978     239485

Consistent Read Gets Per Sec                       202.570936  64677.436

Consistent Read Gets Per Txn                       3930.41373 372602.889

Logical Reads Per Sec                              224.984307 64690.6884

Logical Reads Per Txn                              4512.34119     840030

Logical Reads Per User Call                        276.745756     135804

Physical Read Bytes Per Sec                        1249601.48  528672777

Physical Read IO Requests Per Sec                  6.44664078 2040.73828
Physical Read Total Bytes Per Sec                  1272159.18  528699475

Physical Read Total IO Requests Per Sec            7.82238122 2042.31792

Physical Reads Direct Lobs Per Sec                 .006030572  4.6953047

Physical Reads Direct Lobs Per Txn                 .231642268        141

Physical Reads Direct Per Sec                      59.3280451 64535.1513

Physical Reads Direct Per Txn                      602.336945 371825.222

Physical Reads Per Sec                             152.539244 64535.2511

Physical Reads Per Txn                             2966.04803 371831.889
4-7. Managing AWR Baselines via Enterprise Manager
Problem
You want to create and manage AWR baselines using Enterprise Manager.
Solution
Using Enterprise Manager, you can easily configure or modify baselines. In Figure 4-3, you can see the window where you can establish or modify your existing baselines, including any fixed baselines, as well as the system moving baseline. To create a new fixed baseline, you would click the Create button, which would navigate you to the screen shown in Figure 4-4, where you can configure your new fixed baseline. Within this screen, you name your baseline, and choose between a snapshot-based or time-based baseline.

Figure 4-3. Managing baselines within Enterprise Manager
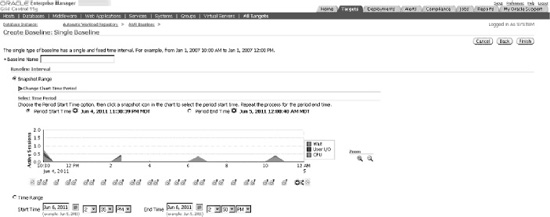
Figure 4-4. Creating new fixed baseline within Enterprise Manager
When deciding to modify your existing baselines, the screen options differ between modifying fixed baselines, and modifying the system moving baseline. Figure 4-5 shows the modifiable options for a fixed baseline. As you can see, the only real modification that can be made is the actual baseline name itself. Figure 4-6 shows how to change the moving baseline window within Enterprise Manager. As mentioned before, the actual screens may differ between versions of the Enterprise Manager tool.

Figure 4-5. Modifying a fixed baseline within Enterprise Manager

Figure 4-6. Modifying the moving baseline within Enterprise Manager
How It Works
For any fixed baseline created or the system moving baseline, you can also simply generate an AWR report based on a particular baseline. Figure 4-1 shows how to generate a snapshot-based AWR report by clicking the By Snapshot button. Using this same screen, you can also generate an AWR report for a baseline simply by clicking the By Baseline button.
If you want to delete a baseline from within Enterprise Manager, simply click the radio button of the baseline you wish to delete, and then click the Delete button, as depicted in Figure 4-7. Figure 4-8 shows how to actually delete the baseline. You can choose to keep or purge the baseline data by clicking the appropriate radio button.

Figure 4-7. Choosing a baseline to delete

Figure 4-8. Deleting a baseline
4-8. Managing AWR Statistics Repository
Problem
You have AWR snapshots and baselines in place for your database, and need to perform regular maintenance activities for your AWR information.
Solution
By using the DBMS_WORKLOAD_REPOSITORY package, you can perform most maintenance on your baselines, including the following:
- Renaming a baseline
- Dropping a baseline
- Dropping a snapshot range
To rename a baseline, use the RENAME_BASELINE procedure of the DBMS_WORKLOAD_REPOSITORY package:
SQL>  exec dbms_workload_repository.rename_baseline -

      ('Batch Baseline #9','Batch Baseline #10'),


PL/SQL procedure successfully completed.
To drop a baseline, simply use the DROP_BASELINE procedure:
SQL> exec dbms_workload_repository.drop_baseline('Batch Baseline #1'),


PL/SQL procedure successfully completed.
If you have decided you have AWR snapshots you no longer need, you can reduce the number of AWR snapshots held within your database by dropping a range of snapshots using the DROP_BASELINE procedure:
SQL>  exec dbms_workload_repository.drop_snapshot_range(255,256);


PL/SQL procedure successfully completed.
How It Works
In addition to the DBMS_WORKLOAD_REPOSITORY package, there are other things you can do to analyze your AWR information in order to help manage all of the AWR information in your database, including the following:
- Viewing AWR information from the data dictionary
- Moving AWR information to a repository in another database location
If you wanted to store AWR information for an entire grid of databases in a single database, Oracle provides scripts that can be run in order to extract AWR information from a given database, based on a snapshot range, and in turn, load that information into a different database.
To extract a given snapshot range of AWR information from your database, you need to run the awrextr.sql script. This script is an interactive script, and asks for the same kind of information as when you generate an AWR report using the awrrpt.sql script. You need to answer the following questions when running this script:
- DBID (defaults to DBID of current database)
- Number of days of snapshots to display for extraction
- The beginning snapshot number to extract
- The ending snapshot number to extract
- Oracle directory in which to place the resulting output file holding all the AWR information for the specified snapshot range; the directory must be entered in upper case.
- Output file name (defaults to
awrdatplus snapshot range numbers)
Keep in mind that the output file generated by this process does take up space, which can vary based on the number of sessions active at snapshot time. Each individual snapshot needed for extraction can take up 1 MB or more of storage, so carefully gauge the amount of snapshots needed. If necessary, you can break the extraction process into pieces if there is inadequate space on a given target directory.
In addition, for each output file generated, a small output log file is also generated, with information about the extraction process, which can be useful in determining if the information extracted matches what you think has been extracted. This is a valuable audit to ensure you have extracted the AWR information you need.
Once you have the extract output file(s), you need to transport them (if necessary) to the target server location for loading into the target database location. The load process is done using the awrload.sql script. What is needed for input into the load script includes the following:
- Oracle directory in which to place the resulting output file holding all the AWR information for the specified snapshot range; the directory must be entered in upper case.
- File name (would be the same name as entered in number 6 of the extraction process (for the
awrextr.sqlscript); when entering the file name, exclude the.dmpsuffix, as it will be appended automatically. - Target schema (default schema name is
AWR_STAGE) - Target tablespace for object that will be created (provides list of choices)
- Target temporary tablespace for object that will be created (provides list of choices)
After the load of the data is complete, the AWR data is moved to the SYS schema in the data dictionary tables within the target database. The temporary target schema (for example, AWR_STAGE) is then dropped.
In order to generate an AWR report generated from one database that is then loaded into a different database, use the AWR_REPORT_TEXT function of the DBMS_WORKLOAD_REPOSITORY package. For example, let's say we loaded and stored snapshots 300 through 366 into our separate AWR database. If we wanted to generate an AWR report for the information generated between snapshots 365 and 366 for a given database, we would run the following command, with the DBID of the originating, source database, as well as the beginning and ending snapshot numbers as follows:
SELECT  dbms_workload_repository.awr_report_text

        (l_dbid=>2334201269,l_inst_num=>1,l_bid=>365,l_eid=>366)

FROM dual;
4-9. Creating AWR Baselines Automatically
Problem
You want to periodically create baselines in your database automatically.
Solution
You can create an AWR repeating template, which gives you the ability to have baselines created automatically based on a predefined interval and time frame. By using the CREATE_BASELINE_TEMPLATE procedure within the DBMS_WORKLOAD_REPOSITORY package, you can have a fixed baseline automatically created for this repeating interval and time frame. See the following example to set up an AWR template:
SQL> alter session set nls_date_format = 'yyyy-mm-dd:hh24:mi:ss';


SQL> exec DBMS_WORKLOAD_REPOSITORY.create_baseline_template( -

>    day_of_week          => 'WEDNESDAY', -

>    hour_in_day          => 0, -

>    duration             => 6, -

>    start_time           => '2011-06-14:00:00:00', -

>    end_time             => '2011-06-14:06:00:00', -

>    baseline_name_prefix => 'Batch Baseline ', -

>    template_name        => 'Batch Template', -

>    expiration           => 365);


PL/SQL procedure successfully completed.
For the foregoing template, a fixed baseline will be created based on the midnight to 6 a.m. window every Wednesday. In this case, this template creates baselines for a normal batch window time frame.
If you are using Enterprise Manager, you can create a template using the same parameters. See Figure 4-9 for an example.

Figure 4-9. Creating an AWR template
How It Works
If you need to drop your template, you simply use the DROP_BASELINE_TEMPLATE procedure from the DBMS_WORKLOAD_REPOSITORY package. See the following example:
SQL> exec dbms_workload_repository.drop_baseline_template('Batch Template'),


PL/SQL procedure successfully completed.
If you wish to view information on any templates you have created, you can query the DBA_HIST_BASELINE_TEMPLATE view. See the following sample query:
column template_name format a14

column prefix format a14

column hr format 99

column dur format 999

column exp format 999


SELECT template_name, baseline_name_prefix prefix,

to_char(start_time,'mm/dd/yy:hh24') start_time,

to_char(end_time,'mm/dd/yy:hh24') end_time,

substr(day_of_week,1,3) day, hour_in_day hr, duration dur, expiration exp,

to_char(last_generated,'mm/dd/yy:hh24') last

FROM dba_hist_baseline_template;


TEMPLATE_NAME  PREFIX         START_TIME  END_TIME    DAY  HR  DUR  EXP LAST

-------------- -------------- ----------- ----------- --- --- ---- ---- -----------

Batch Template Batch Baseline 06/14/11:00 06/14/11:06 WED   0    6  365 06/14/11:00
4-10. Quickly Analyzing AWR Output
Problem
You have generated an AWR report, and want to quickly interpret key portions of the report to determine if there are performance issues for your database.
Solution
The AWR report, like its predecessors Statspack and UTLBSTAT/UTLESTAT for earlier versions of Oracle, has a multitude of statistics to help you determine how your database is functioning and performing. There are many sections of the report. The first three places on the report to gauge how your database is performing are as follows:
- DB Time
- Instance Efficiency
- Top 5 Timed Events
The first section displayed on the report shows a summary of the snapshot window for your report, as well as a brief look at the elapsed time, which represents the snapshot window, and the DB time, which represents activity on your database. If the DB time exceeds the elapsed time, it denotes a busy database. If it is a lot higher than the elapsed time, it may mean that some sessions are waiting for resources. While not specific, it can give you a quick view to see if your overall database is busy and possibly overtaxed. We can see from the following example of this section that this is a very busy database by comparing the elapsed time to the DB time:
              Snap Id      Snap Time      Sessions Curs/Sess

            --------- ------------------- -------- ---------

Begin Snap:     18033 11-Jun-11 00:00:43        59       2.3

  End Snap:     18039 11-Jun-11 06:00:22        69       2.4

   Elapsed:              359.66 (mins)

   DB Time:            7,713.90 (mins)
The instance efficiency section gives you a very quick view to determine if things are running adequately on your database. Generally, most percentages within this section should be above 90%. The Parse CPU to Parse Elapsd metric shows how much time the CPU is spending parsing SQL statements. The lower this metric is, the better. In the following example, it is about 2%, which is very low. If this metric ever gets to 5%, it may mean investigation is warranted to determine why the CPU is spending this much time simply parsing SQL statements.
Instance Efficiency Percentages (Target 100%)

~~~~~~~~~~~~~~~~~~~~~~~~~~~~~~~~~~~~~~~~~~~~~

            Buffer Nowait %:   99.64       Redo NoWait %:   99.99

            Buffer  Hit   %:   91.88    In-memory Sort %:   99.87

            Library Hit   %:   98.92        Soft Parse %:   94.30

         Execute to Parse %:   93.70         Latch Hit %:   99.89

Parse CPU to Parse Elapsd %:    2.10     % Non-Parse CPU:   99.75
The third place to get a quick glance at your database performance is the Top 5 Timed Events section. This section gives you a quick look at exactly where the highest amount of resources are being consumed within your database for the snapshot period. Based on these results, it may show you that there is an inordinate amount of time spent performing full-table scans, or getting data across a network database link. The following example shows that the highest amount of resources is being used performing index scans (noted by “db file sequential read”). We can see there is significant time on “local write wait”, “enq: CF – contention”, and “free buffer waits”, which gives us a quick view of what possible contention and wait events are for our database, and gives us immediate direction for investigation and analysis.
Top 5 Timed Foreground Events                              Avg

~~~~~~~~~~~~~~~~~~~~~~~~~~~~~                             wait   % DB

Event                                 Waits    Time (s)   (ms)   Time Wait Class

------------------------------ ------------ ----------- ------ ------ ----------

db file sequential read           3,653,606      96,468     26   20.8   User I/O

local write wait                     94,358      67,996    721   14.7   User I/O

enq: CF - contention                 18,621      46,944   2521   10.1      Other

free buffer waits                 3,627,548      38,249     11    8.3 Configurat

db file scattered read            2,677,267      32,400     12    7.0   User I/O
How It Works
After looking at the DB Time, Instance Efficiency, and Top 5 Timed Events sections, if you want to look in more detail at the sections of a given AWR report, refer to Recipe 7-17 in Chapter 7 for more information. Because the sheer volume of information in the AWR report is so daunting, it is strongly recommended to create baselines that represent a normal processing window. Then, AWR snapshots can be compared to the baselines, and metrics that may just look like a number on a given AWR report will stand out when a particular metric is significantly above or below a normal range.
4-11. Manually Getting Active Session Information
Problem
You need to do performance analysis on sessions that run too frequently or are too short to be available on available AWR snapshots. The AWR snapshots are not taken often enough to capture the information that you need.
Solution
You can use the Oracle Active Session History (ASH) information in order to get real-time or near real-time session information. While the AWR information is very useful, it is bound by the reporting periods, which are by default run every hour on your database. The ASH information has active session information, and is sampled every second from V$SESSION, and can show more real-time or near real-time session information to assist in doing performance analysis on your database. There are a few ways to get active session information from the database:
- Running the canned ASH report
- Running an ASH report from within Enterprise Manager (see Recipe 4-12)
- Getting ASH information from the data dictionary (see Recipe 4-13)
The easiest method to get information on active sessions is to run the ashrpt.sql script, which is similar in nature to the awrrpt.sql script that is run when generating an AWR report. When you run the ashrpt.sql script, it asks you for the following:
- Report type (text or HTML)
- Begin time for report (defaults to current time minus 15 minutes)
- End time for report (defaults to current time)
- Report name
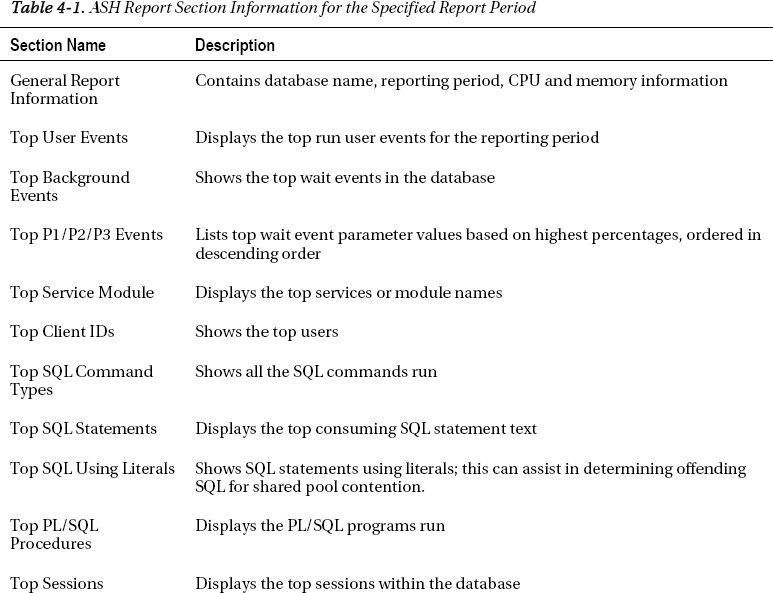
There are many sections to the ASH report. See Table 4-1 for a brief description of each section. See the following snippet from many of the sections of the ASH report. Some sections have been shortened for brevity.
Top User Events            DB/Inst: ORCL/ORCL  (Jun 18 12:00 to 12:45)


                                                               Avg Active

Event                               Event Class     % Activity   Sessions

----------------------------------- --------------- ---------- ----------

CPU + Wait for CPU                  CPU                  35.36       1.66

db file scattered read              User I/O             33.07       1.55

db file sequential read             User I/O             21.33       1.00

read by other session               User I/O              6.20       0.29

direct path read temp               User I/O              2.59       0.12

          -------------------------------------------------------------


Top Background Events      DB/Inst: ORCL/ORCL  (Jun 18 12:00 to 12:45)


                                                               Avg Active

Event                               Event Class     % Activity   Sessions

----------------------------------- --------------- ---------- ----------

Log archive I/O                     System I/O           12.77       0.68

CPU + Wait for CPU                  CPU                   6.38       0.34

log file parallel write             System I/O            5.66       0.30

log file sequential read            System I/O            4.91       0.26

log file sync                       Commit                1.06       0.06

          -------------------------------------------------------------
Top Event P1/P2/P3 Values  DB/Inst: ORCL/ORCL  (Jun 18 12:00 to 12:45)


Event                          % Event  P1 Value, P2 Value, P3 Value % Activity

------------------------------ ------- ----------------------------- ----------

Parameter 1                Parameter 2                Parameter 3

-------------------------- -------------------------- --------------------------

db file scattered read           17.30           "775","246084","16"       0.14

file#                      block#                     blocks


Datapump dump file I/O            6.32         "1","32","2147483647"       6.32

count                      intr                       timeout


RMAN backup & recovery I/O        5.83         "1","32","2147483647"       5.80

count                      intr                       timeout


Top Service/Module         DB/Inst: ORCL/ORCL  (Jun 18 12:00 to 12:45)


Service        Module                   % Activity Action               % Action

-------------- ------------------------ ---------- ------------------ ----------

SYS$BACKGROUND UNNAMED                       31.00 UNNAMED                 31.00

               DBMS_SCHEDULER                18.87 GATHER_STATS_JOB        18.87

               Data Pump Worker              18.87 APP_IMPORT              18.87

SYS$BACKGROUND MMON_SLAVE                     1.95 Auto-Flush Slave A       1.42

          -------------------------------------------------------------


Top SQL Command Types      DB/Inst: ORCL/ORCL  (Jun 18 12:00 to 12:45)


                                           Distinct            Avg Active

SQL Command Type                             SQLIDs % Activity   Sessions

---------------------------------------- ---------- ---------- ----------

INSERT                                            2      18.88       1.00

SELECT                                           27       2.36       0.12

          -------------------------------------------------------------


Top SQL Statements        DB/Inst: ORCL/ORCL  (Jun 18 12:00 to 12:45)


       SQL ID    Planhash % Activity Event                             % Event

------------- ----------- ---------- ------------------------------ ----------

av2f2stsjfr5k  3774074286       1.16 CPU + Wait for CPU                   0.80

select a.tablespace_name, round(sum_free/sum_bytes,2)*100 pct_free from

(select tablespace_name, sum(bytes) sum_bytes from sys.dba_data_files group by t

ablespace_name) a, (select tablespace_name, sum(bytes) sum_free , max(bytes)

bigchunk from sys.dba_free_space group by tablespace_name) b where a.table
Top Sessions              DB/Inst: ORCL/ORCL  (Jun 18 12:00 to 12:45)


   Sid, Serial# % Activity Event                             % Event

--------------- ---------- ------------------------------ ----------

User                 Program                          # Samples Active     XIDs

-------------------- ------------------------------ ------------------ --------

      365, 3613      18.87 CPU + Wait for CPU                  12.29

D_USER               oracle@oraprod (DW01)         1,755/2,700 [ 65%]        8


                           Datapump dump file I/O               6.32

                                                      903/2,700 [ 33%]        8


      515, 8721      18.87 db file scattered read              17.26

SYS                  oracle@oraprod (J000)         2,465/2,700 [ 91%]        1


Top Blocking Sessions      DB/Inst: ORCL/ORCL  (Jun 18 12:00 to 12:45)


   Blocking Sid % Activity Event Caused                      % Event

--------------- ---------- ------------------------------ ----------

User                 Program                          # Samples Active     XIDs

-------------------- ------------------------------ ------------------ --------

      549,    1       2.09 enq: CF - contention                 2.03

SYS                  oracle@oraprod (CKPT)           248/2,700 [  9%]        0


Top DB Objects             DB/Inst: ORCL/ORCL  (Jun 18 12:00 to 12:45)


      Object ID % Activity Event                             % Event

--------------- ---------- ------------------------------ ----------

Object Name (Type)                                    Tablespace

----------------------------------------------------- -------------------------

        1837336       3.25 db file scattered read               3.25

STG.EMPPART.EMPPART10_11P (TAB EMP_S


        1837324       3.05 db file scattered read               3.05

STG.EMPPART.EMPPART10_10P (TAB EMP_S


Top DB Files               DB/Inst: ORCL/ORCL  (Jun 18 12:00 to 12:45)


        File ID % Activity Event                             % Event

--------------- ---------- ------------------------------ ----------

File Name                                             Tablespace

----------------------------------------------------- -------------------------

            200       6.31 Datapump dump file I/O               6.31

/opt/vol01/ORCL/app_s_016.dbf                          APP_S


          -------------------------------------------------------------
Activity Over Time        DB/Inst: ORCL/ORCL  (Jun 18 12:00 to 12:45)


                         Slot                                   Event

Slot Time (Duration)    Count Event                             Count % Event

-------------------- -------- ------------------------------ -------- -------

12:00:00   (5.0 min)    2,672 CPU + Wait for CPU                1,789   12.52

                              db file scattered read              290    2.03

                              enq: CF - contention                290    2.03

12:05:00   (5.0 min)    2,586 CPU + Wait for CPU                1,396    9.77

                              RMAN backup & recovery I/O          305    2.14

                              db file scattered read              287    2.01

12:10:00   (5.0 min)    2,392 CPU + Wait for CPU                1,068    7.48

                              Log archive I/O                     423    2.96

                              RMAN backup & recovery I/O          356    2.49

...

          -------------------------------------------------------------
How It Works
Retrieving ASH information is necessary if you need to get session information more current than you can retrieve from the AWR report. Again, AWR information is generated only hourly by default. ASH information is gathered every second from V$SESSION, and stores the most useful session information to help gauge database performance at any given moment.
The ASH information is stored within a circular buffer in the SGA. Oracle documentation states that the buffer size is calculated as follows:
Max [Min [ #CPUs * 2 MB, 5% of Shared Pool Size, 30MB ], 1MB ]
The amount of time that the information is stored within the data dictionary depends on the activity within your database. You may need to view the DBA_HIST_ACTIVE_SESS_HISTORY historical view in order to get the ASH information you need if your database is very active. For an example of querying the DBA_HIST_ACTIVE_SESS_HISTORY view, see Recipe 4-13. To quickly see how much data is held in your historical view, you could simply get the earliest SAMPLE_TIME from the DBA_HIST_ACTIVE_SESS_HISTORY view:
SELECT min(sample_time) FROM dba_hist_active_sess_history;


MIN(SAMPLE_TIME)

---------------------------------------------------------------------------

20-MAR-11 11.00.27.433 PM
The MMON background process, which manages the AWR hourly snapshots, also flushes ASH information to the historical view at the same time. If there is heavy activity on the database, and the buffer fills between the hourly AWR snapshots, the MMNL background process will wake up and flush the ASH data to the historical view.
The V$ACTIVE_SESSION_HISTORY and DBA_HIST_ACTIVE_SESS_HISTORY views contain much more detailed information than just the samples shown within this recipe, and you can drill down and get much more information at the session level, if desired, including information regarding actual SQL statements, the SQL operations, blocking session information, and file I/O information.
4-12. Getting ASH Information from Enterprise Manager
Problem
You want to get to ASH information from within Enterprise Manager because you use Enterprise Manager for performance tuning activities.
Solution
The ASH report generated from within Enterprise Manager has the same sections as specified in Table 4-1 (see Recipe 4-11). To generate an ASH report from within Enterprise Manager, you generally need to be in the Performance tab, depending on your particular version of Enterprise Manager. As with running the ashrpt.sql script, you need to specify the beginning and ending time frames for the report period desired. See Figure 4-10 for an example of the screen used to generate an ASH report, and Figure 4-11 for a sample of the ASH report output:
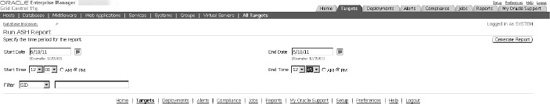
Figure 4-10.Generating ASH report from Enterprise Manager

Figure 4-11. Sample ASH report from Enterprise Manager
How It Works
When generating an ASH report, you have the option to filter on specific criteria. In Figure 4-12, see the Filter drop-down menu. If you have a very active database, and already want to zero in on a specific SQL_ID, for example, you can choose the SQL_ID option from the Filter drop-down menu, and enter the SQL_ID value. The resulting report will show information based only on the filtered criteria.
The choices to filter on include the following:
- SID
- SQL_ID
- Wait Class
- Service
- Module
- Action
- Client
Many of the foregoing filters can be found in the V$SESSION view. For a list of the possible wait classes, you can query the DBA_HIST_EVENT_NAME view as shown in the following example:
SELECT DISTINCT wait_class FROM dba_hist_event_name;


WAIT_CLASS

----------------------------------------------------------------

Concurrency

User I/O

Administrative

System I/O

Scheduler

Configuration

Other

Application

Cluster

Network

Idle

Commit

Figure 4-12. Customizing ASH report by filter
4-13. Getting ASH Information from the Data Dictionary
Problem
You want to see what ASH information is kept in Oracle's data dictionary.
Solution
There are a couple of data dictionary views you can use to get ASH information. The first, V$ACTIVE_SESSION_HISTORY, can be used to get information on current or recent sessions within your database. The second, DBA_HIST_ACTIVE_SESS_HISTORY, is used to store older, historical ASH information.
If you wanted to see all the events and their total wait time for activity within the past 15 minutes in your database, you could issue the following query:
SELECT s.event, sum(s.wait_time + s.time_waited) total_wait

FROM v$active_session_history s

WHERE s.sample_time between sysdate-1/24/4 AND sysdate

GROUP BY s.event

ORDER BY 2 desc;


EVENT                                                            TOTAL_WAIT

---------------------------------------------------------------- ----------

                                                                   20002600

db file scattered read                                             15649078

read by other session                                               9859503

db file sequential read                                              443298

direct path read temp                                                156463

direct path write temp                                               139984

log file parallel write                                               49469

db file parallel write                                                21207

log file sync                                                         11793
SGA: allocation forcing component growth                              11711

control file parallel write                                            4421

control file sequential read                                           2122

SQL*Net more data from client                                           395

SQL*Net more data to client                                              66
If you wanted to get more session-specific information, and wanted to see the top 5 sessions that were using the most CPU resources within the last 15 minutes, you could issue the following query:
column username format a12

column module format a30


SELECT * FROM

(

SELECT s.username, s.module, s.sid, s.serial#, count(*)

FROM v$active_session_history h, v$session s

WHERE h.session_id = s.sid

AND   h.session_serial# = s.serial#

AND   session_state= 'ON CPU' AND

      sample_time > sysdate - interval '15' minute

GROUP BY s.username, s.module, s.sid, s.serial#

ORDER BY count(*) desc

)

where rownum <= 5;


USERNAME   MODULE                              SID    SERIAL#   COUNT(*)

---------- ---------------------------- ---------- ---------- ----------

SYS        DBMS_SCHEDULER                      536          9         43

APPLOAD    etl1@app1 (TNS V1-V3)              1074       3588         16

APPLOAD    etl1@app1 (TNS V1-V3)              1001       4004         12

APPLOAD    etl1@app1 (TNS V1-V3)               968        108          5

DBSNMP     emagent@ora1 (TNS V1-V3)            524          3          2
The SESSION_STATE column has two valid values, ON CPU and WAITING, which denote whether a session is active or is waiting for resources. If you wanted to see the sessions that are waiting for resources, you could issue the same query as previously, with a SESSION_STATE of WAITING.
If you wanted to see the most heavily used database objects for a given sample period, you could join V$ACTIVE_SESSION_HISTORY to the DBA_OBJECTS view to get that information. In the following example, we are getting a list of the top 5 database objects in use, along with the event associated with that database object, over the past 15 minutes:
SELECT * FROM

(

SELECT o.object_name, o.object_type, s.event,

       SUM(s.wait_time + s.time_waited) total_waited

FROM v$active_session_history s, dba_objects o

WHERE s.sample_time between sysdate - 1/24/4 and sysdate

AND s.current_obj# = o.object_id

GROUP BY o.object_name, o.object_type, s.event

ORDER BY 4 desc

)
WHERE rownum <= 5;


OBJECT_NAME                  OBJECT_TYPE     EVENT                     TOTAL_WAITED

---------------------------- --------------- ------------------------- ------------

WRI$_ALERT_OUTSTANDING       TABLE           Streams AQ: enqueue block    110070196

                                             ed on low memory

APP_ETL_IDX1                 INDEX           read by other session         65248777

APP_SOURCE_INFO              TABLE PARTITION db file scattered read        33801035

EMPPART_PK_I                 INDEX PARTITION read by other session         28077262

APP_ORDSTAT                  TABLE PARTITION db file scattered read        15569867
How It Works
The DBA_HIST_ACTIVE_SESS_HISTORY view can give you historical information on sessions that have aged out of the V$ACTIVE_SESSION_HISTORY view. Let's say you had a day when performance was particularly bad on your database. You could zero in on historical session information for a given time frame, provided it is still held within the DBA_HIST_ACTIVE_SESS_HISTORY view. For instance, if you wanted to get the users that were consuming the most resources for a given day when performance was poor, you could issue the following query:
SELECT * FROM

(

SELECT u.username, h.module, h.session_id sid,

       h.session_serial# serial#, count(*)

FROM dba_hist_active_sess_history h, dba_users u
WHERE h.user_id = u.user_id

AND   session_state= 'ON CPU'

AND  (sample_time between to_date('2011-05-15:00:00:00','yyyy-mm-dd:hh24:mi:ss')

AND   to_date('2011-05-15:23:59:59','yyyy-mm-dd:hh24:mi:ss'))

AND u.username != 'SYS'

GROUP BY u.username, h.module, h.session_id, h.session_serial#

ORDER BY count(*) desc

)

where rownum <= 5;


USERNAME     MODULE                                SID    SERIAL#   COUNT(*)

------------ ------------------------------ ---------- ---------- ----------

APPLOAD1     etl1@app1 (TNS V1-V3)                1047        317       1105

APPLOAD1     etl1@app1 (TNS V1-V3)                1054        468        659

APPLOAD1     etl1@app1 (TNS V1-V3)                1000        909        387

STG          oracle@ora1 (TNS V1-V3)               962       1707        353

APPLOAD1     etl1@app1 (TNS V1-V3)                 837      64412        328
To then zero in on the database objects, you could issue the following query for the same time frame:
SELECT * FROM

(

SELECT o.object_name, o.object_type, s.event,

       SUM(s.wait_time + s.time_waited) total_waited

FROM dba_hist_active_sess_history s, dba_objects o
WHERE s.sample_time

between to_date('2011-05-15:00:00:00','yyyy-mm-dd:hh24:mi:ss')

AND   to_date('2011-05-15:23:59:59','yyyy-mm-dd:hh24:mi:ss')

AND s.current_obj# = o.object_id

GROUP BY o.object_name, o.object_type, s.event

ORDER BY 4 desc

)

WHERE rownum <= 5;


OBJECT_NAME                  OBJECT_TYPE     EVENT                     TOTAL_WAITED

---------------------------- --------------- ------------------------- ------------

EMPPART                      TABLE PARTITION PX Deq Credit: send blkd    8196703427

APPLOAD_PROCESS_STATUS       TABLE           db file scattered read       628675085

APPLOAD_PROCESS_STATUS       TABLE           read by other session        408577335

APP_SOURCE_INFO              TABLE PARTITION db file scattered read       288479849

APP_QUALITY_INFO             TABLE PARTITION Datapump dump file I/O       192290534