
![]()
Managing and Monitoring Best Practices
by Leighton Nelson
Oracle Enterprise Manager Cloud Control 12c is built from the ground up to manage and monitor your enterprise infrastructure and applications across the entire IT stack. To effectively manage your environment, various techniques and best practices should be followed. Monitoring your environment ensures that no component goes unwatched. By using events, metrics, and incidents, you can provide yourself a comprehensive picture of the environment at any point in time.
This chapter presents some of the best practices to apply to monitoring and managing your environment with EM12c. The following best-practice areas are discussed:
- Metric thresholds
- Monitoring templates
- Administration groups
- Template collections
- Synchronization schedules
- Incident management
Metric Thresholds
Metric thresholds are the main features when it comes to monitoring. They enable you to be proactive so you can identify issues and address them in a timely manner. Enterprise Manager Cloud Control includes many types of metrics, which can be used for monitoring targets. Several classes of metrics are available, depending on the type of target. Metric thresholds should be configured so that alerts are triggered and sent via notifications to administrators.
Two levels of severity are associated with metric thresholds: warning and critical. For example, you may set a metric threshold for a tablespace in the database to send a warning alert when the tablespace becomes more than 80 percent full. Then you might set another threshold to send a critical alert when the tablespace becomes more than 95 percent full. A warning threshold will allow enough time to address issues before they become critical. Critical alerts would indicate an impending problem and require immediate action.
When defining your thresholds, first determine the important components on which thresholds should be set. This could include database instances, listeners, and filesystems. Metrics can then be selected from EM12c for each target type.
To view all metric thresholds and their values for a database instance, follow these steps:
- From the Oracle Database drop-down menu, choose Monitoring
 All Metrics, as shown in Figure 7-1.

Figure 7-1. Viewing a list of metric thresholds
- A display of metrics and thresholds similar to that in Figure 7-2 displays. Set thresholds only for the metrics that you care about. Selecting too many metrics could generate a lot of “white noise” and cause critical alerts to be overlooked. You should also disable metrics that you don't need for reporting or monitoring purposes in order to reduce storage consumption.

Figure 7-2. Database metrics and their current threshold settings
Threshold values should be obtained by gathering data during performance or load testing. View the available metric history to obtain these values while the performance is acceptable. Also define metrics for target availability such as database instance status. The values selected for critical thresholds should be chosen conservatively so that you are alerted under only extremely serious conditions, such as when a tablespace is over 97 percent full.
To set values for a metric, follow these steps:
- Click a metric category such as Tablespaces Full. These categories are listed to the left in Figure 7-2.
- Click a specific metric such as Tablespace Space Used (%).
- Click the Modify Thresholds button. You should see a dialog box like the one in Figure 7-3.

Figure 7-3. Entering threshold values for a metric
- Enter the values for the metric.
EM12c includes out-of-the-box thresholds that can be used as the basis for your own monitoring. Customize these as necessary to ensure that they meet service-level agreements for your business. Thresholds can then be fine-tuned over time if they are not meeting requirements, or in response to service-level changes.
While the one-by-one method in this section provides a quick way to set thresholds for a single target, the method becomes increasingly difficult and time-consuming as the number of targets across the enterprise increases. Thus, my recommended method of setting metric thresholds is to employ monitoring templates.
Monitoring Templates
Monitoring templates are collections of metric thresholds for a specific target type. Metric thresholds should be set on monitoring templates, which are then applied to one or more targets. For example, a monitoring template can be created for production database instances that may include the following metrics and warning/critical thresholds:
- Tablespace Space Used (%) > 80/97
- Archive Area Space Used (%) > 75/90
- Dump Area Used (%) > 90/95
- Status = DOWN
The monitoring template can then be applied to all production database instances, easing the task of standardizing your monitoring settings. Separate monitoring templates can be created for each target type. For example, you can create a listener template, a host template, and so forth.
The metric thresholds set in your monitoring templates should not be fine-grained, but rather broad enough to meet general service levels for the majority of targets. If finer granularity is required, additional templates can be created and applied to those targets that require them. Think in terms of creating the minimum number of templates to cover the maximum possible targets. Don’t gratuitously create more templates than you need, because it’s just more work then to manage them. Create what you need, but no more than you need.
To create a monitoring template, follow these steps:
- Run the Enterprise Manager Cloud Control console.
- Choose Enterprise Monitoring Monitoring Templates, as shown in Figure 7-4.

Figure 7-4. Preparing to create a new monitoring template
- The Monitoring Templates page opens. Click the Create button to create a template.
- Choose a representative target for the monitoring settings that you want to create, as shown in Figure 7-5. This target will be used as the basis for metrics and policies in the monitoring template. For example, to create a Database Instance monitoring template, select an existing database instance target from which to copy existing monitoring settings. Alternatively, you may select a target type and enter the settings manually.

Figure 7-5. Creating a monitoring template
- Enter a meaningful name for the template, and optionally a description, as shown in Figure 7-6. (Writing a short description to jog your memory later is a good idea.)

Figure 7-6. Naming your template
- Click the Metric Thresholds tab to open the data entry area shown in Figure 7-7.
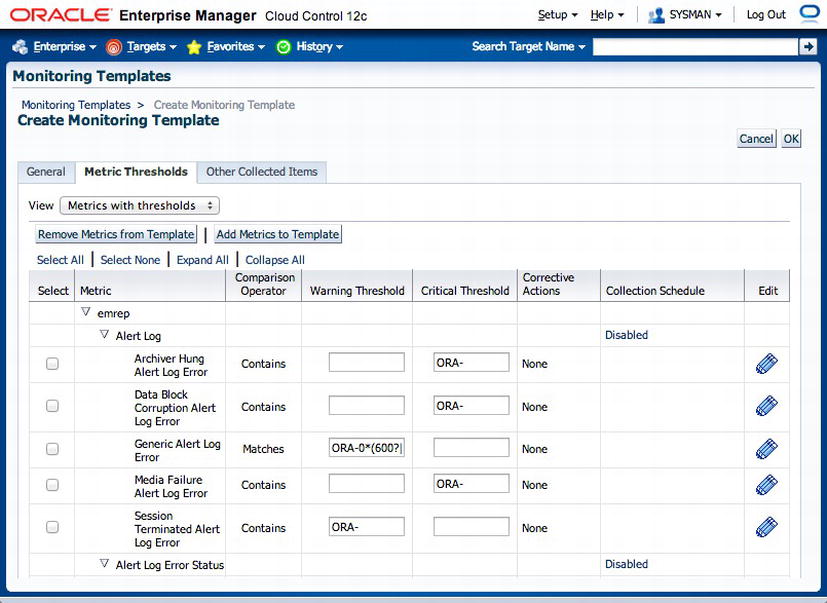
Figure 7-7. Specifying threshold values
- Enter or modify the values for the metrics that you want to set. Select only the metrics that you care about. Remember, values for the metrics should be set according to your operational goals. You can also remove selected metrics altogether if you don’t want them to be collected. If a threshold value is not set for a metric, no alerts will be sent for the metric.
In addition to specifying thresholds for your metrics, you can modify the collection schedules for the metrics if those schedules are not in line with your operating goals. For example, the Archive Area Used (%) metric collection schedule by default is set to collect every 15 minutes. If your database instance has a high transaction rate that generates a lot of archive redo logs, you may want to modify the collection schedule for the metric to collect at 10-minute intervals instead. Click the link in the Collection Schedule column to modify the schedule. Figure 7-8 shows a close-up of an Archive Area threshold. The Every 15 Minutes link is what you would click to modify the schedule.

Figure 7-8. Click the Every 15 Minutes link to modify the schedule for checking Archive Area thresholds
Create additional monitoring templates for each target type that you wish to monitor. In a RAC environment, you might create templates for listener, cluster database, ASM instance, and host.
While monitoring templates are the preferred method for standardized threshold settings, you do have the additional overhead involved in applying a template to different target types. In addition, if you change a metric in a monitoring template, the template will have to be reapplied to its targets. Conversely, if metric threshold values are changed for a specific target, the changes are not synchronized to the monitoring template.
EM12c provides template collections to help alleviate the manual effort of applying monitoring templates to different target types. You can create template collections to group thresholds for targets of different types.
Administration groups allow you to easily automate the management and monitoring of targets by applying metrics, compliance standards, and cloud policies to targets based on monitoring template collections. Members are dynamically added to an administration group automatically, based on a set of defined global properties. Any target that matches the criteria is added to the group, and template collections can be associated with those targets. As a best practice, use administration groups for managing targets in Enterprise Manager.
![]() Tip Administration groups are a wonderful, new feature in EM12c. However, you can assign only one notification group per target, so this feature has some limitations. In some cases, you may want multiple notifications per target, and for that you need the original Enterprise Manager groups feature. For example, a target’s monitoring requirement might be to assign incidents to a production DBA group during business hours, and to generate e-mails to an on-call DBA group after hours. This sort of complicated scenario can be satisfied only with the original Enterprise Manager groups feature.
Tip Administration groups are a wonderful, new feature in EM12c. However, you can assign only one notification group per target, so this feature has some limitations. In some cases, you may want multiple notifications per target, and for that you need the original Enterprise Manager groups feature. For example, a target’s monitoring requirement might be to assign incidents to a production DBA group during business hours, and to generate e-mails to an on-call DBA group after hours. This sort of complicated scenario can be satisfied only with the original Enterprise Manager groups feature.
Planning the Hierarchy
Before administration groups are created, you should plan your administration group hierarchy. This hierarchy comprises different, logically divided targets arranged in one or more levels based on global target properties. You may also specify multiple target types that define an administration group.
It is important that the hierarchy be planned so that it is in line with your organization’s operational and monitoring standards. You should have an understanding of how targets are monitored so that similarly managed targets are grouped together. For example, you may want to create a group for Production targets and another group for Non-Production targets based on the LifeCycle Status property. In addition, you may want to create other levels in the hierarchy that are subgroups of Production and Non-Production based on the following target properties:
- Department
- Line of business
- Location
- CSI number
- Cost center
- Contact
The decision of whether to create more levels in the hierarchy should depend on the monitoring characteristics of the intended groups. For example, do you need to maintain separate metrics for HR and Sales groups, or can they be monitored using similar metrics? The diagram shown in Figure 7-9 is an example of an administration group hierarchy based on the LifeCycle Status, Location, and Line of Business target properties.

Figure 7-9. Administration group hierarchy with three levels based on Lifecycle, Location, and Line of Business properties
There can be only one administration group hierarchy. This limit of one prevents conflicts that would arise from multiple hierarchies. Furthermore, a target can belong to only a single group in the hierarchy.
A target cannot be added directly to a group. Instead, group membership is determined by the target’s properties (for example, LifeCycle Status). These properties can be set at target discovery and promotion time, or at a later time if the targets have already been discovered. Target properties can be set by using the Enterprise Manager console or the emcli command-line interface with the set_target_property_value verb. For more information about the emcli commands, see Chapter 2 of the Oracle Enterprise Manager Command Line Interface documentation.
![]() Tip Think of planning your hierarchy in terms of two steps: 1) Define your hierarchy. 2) Assign properties to your targets. The “magic” happens then, as your targets are automatically slotted into your hierarchy at the appropriate levels.
Tip Think of planning your hierarchy in terms of two steps: 1) Define your hierarchy. 2) Assign properties to your targets. The “magic” happens then, as your targets are automatically slotted into your hierarchy at the appropriate levels.
After targets join the administration groups, you can associate template collections so that each group’s members have similar metrics, policies, and standards. Template collections are a set of template metrics composed of several target types. They are discussed later in the chapter.
Separate template collections should be created for each administration group. Before creating administration groups, you should first create monitoring templates. Each monitoring template is specific to a single target type. Therefore, you will need to create a template collection consisting of several monitoring templates: one for each target type. For example, a Production Targets administration group consisting of hosts, listeners, database, and ASM instances will require a template collection consisting of four distinct monitoring templates.
If the administration group hierarchy consists of more than two levels, the order in which template collections are applied is important. Template collections at the leaf levels override metrics from the parent levels. Each group will have its own template collection, and those from the parent levels are propagated to their respective subgroups.
After template collections have been applied, you should associate the collections with the groups. This ensures that each group contains a standard set of metrics, standards, and policies. Once that is done, the targets are synchronized so that any future changes to monitoring templates are automatically applied to the associated targets.
Implementing the Hierarchy
Once you have defined your administration groups, you can implement them by using the Enterprise Manager console. Choose Setup ![]() Add Target
Add Target ![]() Administration Groups, as shown in Figure 7-10. (Note that Administration Groups is displayed to the left.)
Administration Groups, as shown in Figure 7-10. (Note that Administration Groups is displayed to the left.)
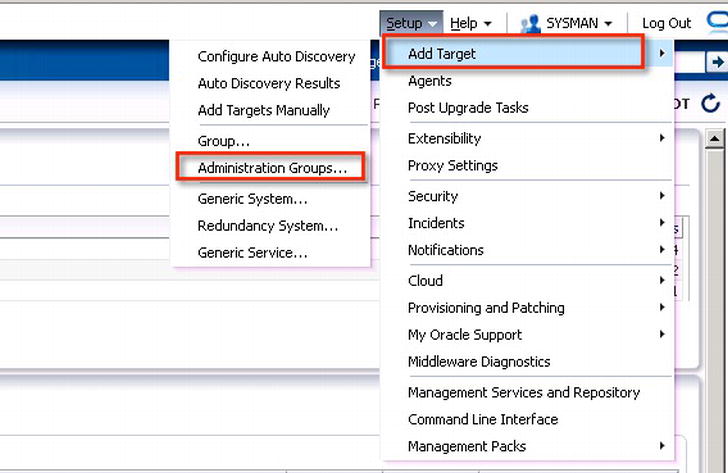
Figure 7-10. Choosing to add administration groups
Within the administration group home page (shown in Figure 7-11), you can now define the group hierarchy determined in the planning phase. You can also create template collections and associate them with the administration groups. Click the Hierarchy tab to define the hierarchy.

Figure 7-11. Creating an administration group hierarchy based on LifeCycle Status from the Enterprise Manager console
Levels are added from top to bottom. Click Add (+) under the Hierarchy Levels section on the left and select a global property that will be used to define the administration group. In Figure 7-11, you see that the LifeCycle Status property denotes the divisions under the administration group, and the Line of Business property denotes the next level of division. By default, those two choices cause a node for each group to be automatically created based on the predefined values for LifeCycle Status.
![]() Note If the Target Type property is used to create an administration group, include database, listener, and ASM in the same group instead of three separate groups.
Note If the Target Type property is used to create an administration group, include database, listener, and ASM in the same group instead of three separate groups.
If the intention is to have a single Production Target group and a Non-Production group, some of the groups can be merged. For example, merging Production and Mission Critical into one group called Production and then merging Development, Test, and Staging into a Non-Production Targets group will result in the hierarchy shown in Figure 7-12.

Figure 7-12. Merged properties for Non-Production and Production groups
Click on the details of each group in a node to change the names of the groups to something more meaningful than the autogenerated names they take on by default. If the targets are in multiple time zones, set the time zone for each group as well. All subgroups will default to the same time zone. The time zone is used for group charts and job scheduling purposes.
Repeat the process just described to create any additional levels that are required. Create the levels identified during the planning phase that are needed to effectively manage your targets. Use the Preview panel to zoom in and zoom out, pan and center on any branch of the hierarchy. Click the double right arrow to expand the Preview controls, shown in Figure 7-13.

Figure 7-13. Preview controls for panning, zooming, and layout
Review the administration group hierarchy carefully after it has been defined. Once it has been created, you can modify only the target property values, which will result in the hierarchy expanding or shrinking in the same level.
Consider experimenting with different hierarchy organizations in a test Enterprise Manager environment. That gives you a chance to review your monitoring and management strategy before taking it to production.
If target properties have already been set prior to creating the administration group hierarchy, you can click the Calculate Members button to have the groups automatically populated. Once you are satisfied with the hierarchy, click the Create button.
![]() Caution If you want to add or remove target properties after the hierarchy has been created, the administration group will have to be deleted and re-created.
Caution If you want to add or remove target properties after the hierarchy has been created, the administration group will have to be deleted and re-created.
The next step is to set those target properties defined in the administration group hierarchy on the targets. This can be done by using the Enterprise Manager console. Or, you can chose the command-line approach using emcli and the set_target_property_value command. If you are setting properties for a small number of targets, use the console. Otherwise, EMCLI is recommended for setting the properties for batches of targets.
To determine which targets have their properties set, go to the All Targets menu. The default view shows the Target Name, Target Type, Target Status, and Pending Activation columns. Click the View drop-down, as shown in Figure 7-14, to add columns that correspond to target properties of the administration groups.
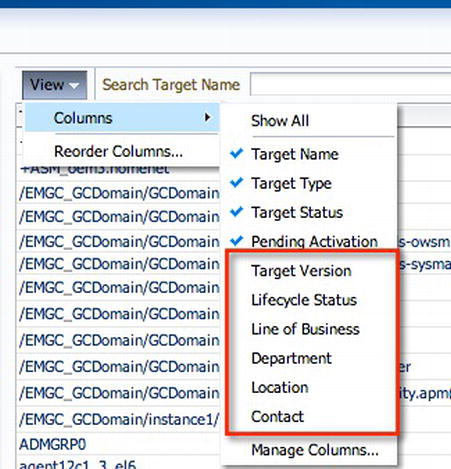
Figure 7-14. Customize the All Targets view to display additional target properties
To set the target properties for nondatabase targets using the console, right-click the target name and choose Target Setup ![]() Properties. For database instances, right-click the target name and choose Oracle Database or Cluster Database, and then Target Setup and Properties. As seen in Figure 7-15, the administration group properties and values chosen for the hierarchy are displayed above the table of all target properties. Click the Edit button to edit the properties.
Properties. For database instances, right-click the target name and choose Oracle Database or Cluster Database, and then Target Setup and Properties. As seen in Figure 7-15, the administration group properties and values chosen for the hierarchy are displayed above the table of all target properties. Click the Edit button to edit the properties.
![]() Note The display of values chosen above the table of target properties is a feature available starting in version 12.1.0.2.0.
Note The display of values chosen above the table of target properties is a feature available starting in version 12.1.0.2.0.
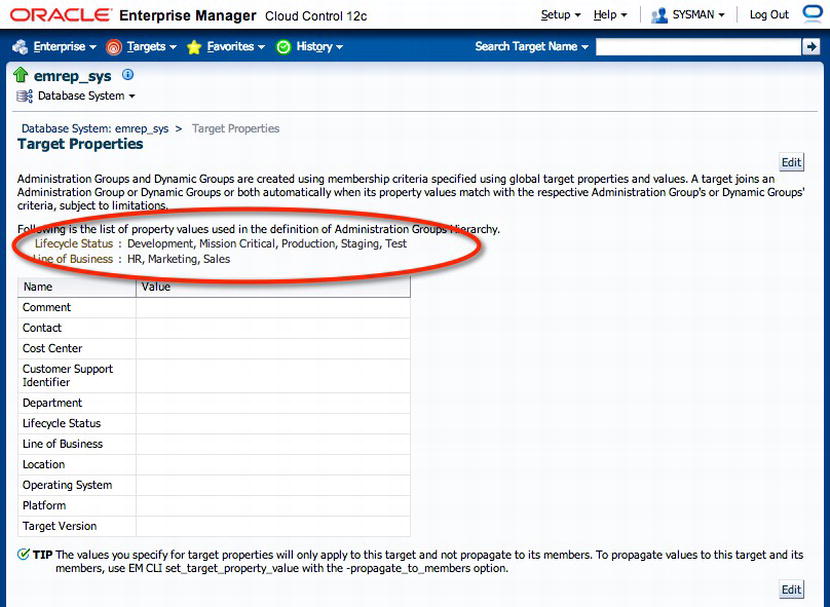
Figure 7-15. Target properties defined in administration group hieararchy
![]() Note Set target properties during target addition or promotion. Doing so ensures that members will join the administration groups automatically after they have been created.
Note Set target properties during target addition or promotion. Doing so ensures that members will join the administration groups automatically after they have been created.
Target properties set on noncluster aggregate targets are not automatically applied to member targets. This is to prevent ambiguity if the target already belongs to another administration group. To set target properties for noncluster aggregate targets, use emcli with set_target_property_values and the –propagate_to_members option. That way, members of the aggregate also join the same administration group.
![]() Note Noncluster aggregate targets include the Database System target type, which consists of database instances, listeners, ASM instances, and high-availability services. Cluster targets such as database clusters, host clusters, and redundancy systems will automatically inherit the target properties for both current and new members.
Note Noncluster aggregate targets include the Database System target type, which consists of database instances, listeners, ASM instances, and high-availability services. Cluster targets such as database clusters, host clusters, and redundancy systems will automatically inherit the target properties for both current and new members.
Any new members of an aggregate will require that their target properties be set manually. The example to follow shows how to propagate the LifeCycle Status and Line of Business target properties to the emrep_sys aggregate:
$ emcli set_target_property_value -property_records
  ="emrep_sys:oracle_dbsys:LifeCycle Status:Production" -propagate_to_members
This command will cause members of the emrep_sys aggregate (database instance, listener, and ASM) to have identical LifeCycle Status and Line of Business properties.
When using emcli, the target properties are case-sensitive. For example, setting a property using Lifecycle Status instead of LifeCycle Status (note the uppercase C) will generate an error. To see the valid list of target properties that can be set for a particular target, issue the emcli get_target_properties command with the target_type option. The following example shows all valid properties for the oracle_dbsys aggregate target:
$ emcli get_target_properties -target_type="oracle_dbsys"
CommentContact
Cost Center
Customer Service Identifier
Department
LifeCycle Status
Line of Business
Location
Operating System
Platform
Target Version
Target properties fetched successfully
Be sure to visit each target you plan to monitor, and be sure to set for that target each of the properties used to build your administration group hierarchy. Any target whose properties are not set will not be part of an administration group, and therefore will not be monitored using the defined monitoring standards.
MULTIPLE TARGETS
When setting target properties for multiple related targets, you can use emcli with the aggregate/cluster target name to simplify the process. For example, to set the same Line of Business property for the database instance, listener, ASM home, and Oracle home for the orcl_sys database system in one command, you would do the following:
emcli set_target_property_value -property_records
="orcl_sys:oracle_dbsys:Line of Business:Marketing" –propagate_to_members
Template Collections
As mentioned earlier, template collections are used to provide a consistent set of metrics to a group of similar targets. Monitoring templates are created by target type, and are bundled together to form a template collection. A separate collection should be created for each node in the hierarchy. For example, a Production Targets group would be associated with a Production Targets template collection consisting of monitoring metrics of different target types. Once these templates have been associated, Use of template collections helps you to automate the deployment of monitoring standards using the metric thresholds and policies defined in the monitoring templates.
To create a template collection, choose Setup ![]() Add Targets
Add Targets ![]() Administration Group. Click the Template Collections tab to create the collections, as shown in Figure 7-16. This assumes that you have already created your monitoring templates for your targets. See the Oracle Enterprise Manager Cloud Control 12c Administrator’s Guide for details on setting up monitoring templates.
Administration Group. Click the Template Collections tab to create the collections, as shown in Figure 7-16. This assumes that you have already created your monitoring templates for your targets. See the Oracle Enterprise Manager Cloud Control 12c Administrator’s Guide for details on setting up monitoring templates.
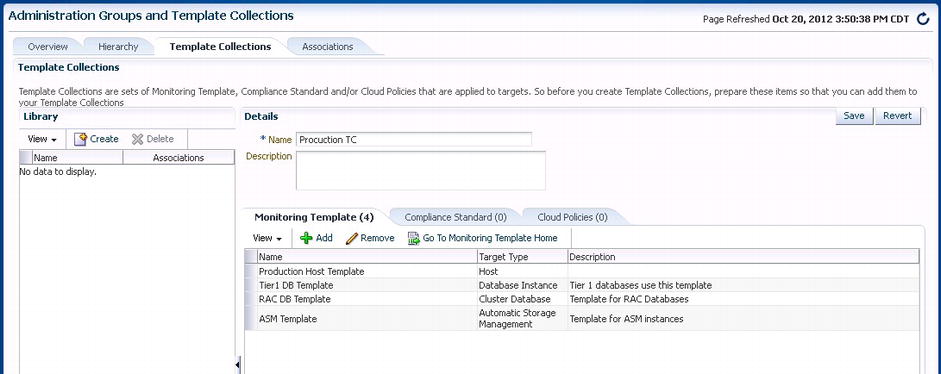
Figure 7-16. Adding template collections
There should be one monitoring template for each target type in the administration group node. Monitoring templates should be carefully designed so as to provide effective monitoring while reducing white noise. Review the monitoring templates after they have been created to ensure that key components are being monitored.
After all required template collections have been created, click the Associations tab to associate each node in the hierarchy with a template collection starting at the second level (the level after the All Administration Group). All targets that are members of the node as well as targets within the subgroups will inherit the metrics of the templates. You can see that this association of nodes with template collections greatly enhances the ability to automatically enforce standards within the IT infrastructure. Review each node in the hierarchy to verify that the state has a valid association. Look for the words Valid Association, as shown in Figure 7-17.

Figure 7-17. Template collection associations applied to the Non-Production_TC and HR_TC groups
The Non-Production_TC and HR_TC nodes in Figure 7-17’s hierarchy have valid associations, while the Marketing and Sales groups have no valid associations. This is because the Sales and Marketing groups have inherited the Non-Production_TC template collection that has been directly associated with the Non-Production group. There is no template collection directly associated with Marketing, nor with Sales. The HR_TC group, however, has been associated with its own template collection. Thus, it shows the Valid Association status.
It is important to understand that the aggregate metrics are applied based on the combination of monitoring templates. If HR_TC has metrics in common with the top-level Non-Production group, those in the lower level take precedence. Use the View Aggregate Settings option shown in Figure 7-18 to see all the metrics that will be applied to the targets.

Figure 7-18. Accessing the View Aggregate Settings option from the Administration Groups and Template Collections page
Check if there are targets that are not being monitored using the standards defined via administration groups and template collections. Click the Actions drop-down menu at the top left of the Associations tab, and then choose Unassigned Targets Report, as shown in Figure 7-19. You will then be shown the targets that are missing one or more properties defined according to the administration group hierarchy. Remember, all targets have to match all membership criteria defined for the administration group hierarchy. That means that if you choose LifeCycle Status and Line of Business as the target properties for the administration hierarchy, then targets require both properties to be set before they will join an administration group.

Figure 7-19. How to access the Unassigned Targets Report option from the administration group
Synchronization Schedule
After template collections have been successfully associated with administration groups, the monitoring templates are immediately applied to the targets in the administration groups. If there are pending synchronization operations, the synchronization schedule comes into effect. Pending operations typically result from changes to a monitoring template that is part of a template collection associated with an administration group. In addition, if there are modifications to a template collection associated with an administration group, synchronization will occur on the next date based on the global synchronization schedule.
Create a global synchronization schedule by specifying the start date, time zone, and frequency in days. Choose Setup ![]() Add Targets
Add Targets ![]() Administration Groups. Select the Associations tab, and then click Synchronization Schedule. It is recommended to set up a schedule that is outside peak hours to minimize any impact on the system. The schedule interval is specified in days, so any pending operations will occur on the next date and time specified. Figure 7-20 is an example of a synchronization schedule set for 12:01AM daily.
Administration Groups. Select the Associations tab, and then click Synchronization Schedule. It is recommended to set up a schedule that is outside peak hours to minimize any impact on the system. The schedule interval is specified in days, so any pending operations will occur on the next date and time specified. Figure 7-20 is an example of a synchronization schedule set for 12:01AM daily.
![]() Note Even though the synchronization schedule is set, synchronization does not always occur. It occurs only when there are pending operations.
Note Even though the synchronization schedule is set, synchronization does not always occur. It occurs only when there are pending operations.

Figure 7-20. The Global Synchronization Schedule setup page in Enterprise Manager Cloud Control 12c
Once the synchronization schedule has been created and has successfully completed at least once, you can periodically check the Synchronization Status region of the topmost administration group (see Figure 7-21). That region displays the synchronization status of all targets in the hierarchy.

Figure 7-21. The Synchronization Status in Administration Group page
In Figure 7-21, in the Synchronization Status box in the middle of the page, you can see the number of targets with statuses of Synchronized, Pending, Failed, Excluded, and N/A for monitoring templates, compliance standards, and cloud policies. Follow the recommendations in Table 7-1 for targets in Pending, Failed, or N/A status.
Table 7-1. Recommendations for Action Based on Synchronization Status
| Synchronization Status | What to Do |
|---|---|
| Pending Targets | Ensure that you have a global synchronization schedule defined. The presence of a Next Synchronization date indicates that one is defined. If you see N/A instead, define a schedule. |
| Failed Targets | Drill down to get details of the specific failures. Fix them where possible. Then either resync manually, or allow the next scheduled synchronization to take place. |
| N/A Targets | Targets have no associated monitoring template. Drill down to get the target type, and add monitoring templates to the template collection. |
Incident Management Recommendations
Monitoring the database environment also means making sure that if any of your targets encounter any issues, you are made aware of them quickly—ideally before any of your clients become aware. It also means that if any operations occur that are of interest (normal or otherwise), that they will be addressed as needed.
What about impending problems? We need to be made aware of these too, and resolve them before they become disasters. EM12c provides the tools for the solution in the form of events, incidents, rules, and rule sets. In this section, you will see how to effectively employ these features to simplify and automate the monitoring requirements.
Events, Incidents, and Problems
An event is a discrete occurrence that affects a single monitored target in Enterprise Manager—for example, when a listener goes down or a filesystem fills up or an archiver hangs. Other occurrences such as job operation status changes (completed, failed, stopped, suspended) also fall under the category of events.
An incident can be thought of as a set of one of more correlated events. An incident typically represents the occurrence of a significant disruption of service requiring specific actions—including tracking, assignment, escalation, and resolution. Management of significant occurrences as a single unit is done via incidents and not events. A host target may generate high CPU (%) and memory utilization events (see Figure 7-22). A single event occurrence by itself may not indicate an incident, but a collection of related events may point to an incident that describes a resource problem.

Figure 7-22. Incident/event relationship for multiple events
In addition to events and incidents, there is the concept of problems. Problems can be viewed as the source or root cause of incidents. They currently manifest themselves as errors in Oracle software. Problems are outside the scope of this discussion, as they can really be anything that causes an interruption or degradation of service. Rodents running loose under your server room floor, for example, can be a problem if they chew through wires and cause downtime.
![]() Note One of the challenges of a DBA’s job is to constantly deal with problems that cannot all be foreseen. Indeed, the presence of a heretofore new problem is part of the “spice” that makes DBA work enjoyable and rewarding. Yet at the same time, we strive for the routine. Such is the inherent tension in our line of work.
Note One of the challenges of a DBA’s job is to constantly deal with problems that cannot all be foreseen. Indeed, the presence of a heretofore new problem is part of the “spice” that makes DBA work enjoyable and rewarding. Yet at the same time, we strive for the routine. Such is the inherent tension in our line of work.
Effectively managing incidents helps us to achieve better operational efficiency, helping us take control of the overall health of our system. Using a centralized incident management console allows us to view, manage, diagnose, and resolve incidents from a single location. A complete discussion of incident management is handled in Chapter 12. The diagram in Figure 7-23 shows the workflow of events and incidents using EM12c.

Figure 7-23. Event, incident, problem workflow
Now that you understand events and incidents, you can begin to look at how to use them. Rules tell us the action or actions that should be performed when an event or incident meets certain criteria. These actions include sending an e-mail or page, opening a service-desk ticket, escalating the incident, or even generating another incident.
You can also specify different actions to take depending on the severity of the event. For example, if a Filesystem Space Used (%) rule generates a warning event, you may wish to send an e-mail notification. Then, if the same rule generates a critical event, you may send a page notification, to wake up the on-call DBA.
Many other actions can be performed for each type of rule. Table 7-2 summarizes each type of rule, and their usages for different scenarios.
Table 7-2. Rule Types and Their Best Uses

Individual rules can be combined into sets for easier management. Rule sets possess the following attributes:
- Name: An identifier for the rule set
- Description: A brief statement of the rule set’s purpose
- Applies To: A list of objects to which the rules in the set apply
- Owner: The administrator in Enterprise Manager who created the rule set
- Enabled: An indicator of whether the rule set has been applied
- Type: Denotes an Enterprise or Private rule set
Think about the order of rules within a rule set, and group similar rules together. Consider rules to create incidents, perhaps by sending an e-mail or creating a trouble ticket. Also consider rules to manage incidents, perhaps by escalating them. Duration-based rules should be put last.
Groups and systems should be used as targets for rule sets. It is recommended to use administration groups if they have been defined. Your defining an administration group hierarchy will enable rules to be applied automatically to new targets as they are added to administration groups by specifying their target properties.
Rules for the same group should be combined into one rule set. For example, in Figure 7-24, the PROD-GROUP rule set is applied to all targets whose LifeCycle Status = 'Production'.

Figure 7-24. Rule set application
You can, and should, automatically create incidents by using rules. You will want to set up rules in your rule set that will create incidents based on events. These rules should be defined first in the rule set.
Enterprise Manager comes with out-of-the-box rule sets that create incidents for some significant events such as target down or target unreachable. One such rule set is named Incident Management Ruleset for All Targets, shown in Figure 7-25.
Avoid using the out-of-the-box rule sets. Instead, create your own based on these stock rule sets by using the Create Like option in the Enterprise Manager console. Once you have created your rule set, you can disable the out-of-the-box rule sets.

Figure 7-25. Out-of-the-box rule set named Incident Management Ruleset for All Targets, as seen in the Enterprise Manager console
The users monitoring a target should be configured so that their passwords do not expire or get locked. That’s because expired or locked passwords result in metric collection errors. For example, the database user configured to monitor the database instance and cluster database targets by default is the DBSNMP user. Starting in Oracle Database 11g, the DBSNMP profile settings are configured to expire passwords after 180 days. So after six months, your ability to monitor goes away. Don’t let that happen.
Create a separate profile that disables password expiration, and assign that profile to the monitoring user. For example, you can create a profile named DBSNMP_MONITOR, and assign that profile to user DBSNMP. Then make sure the profile allows unlimited password lifetime.
Enterprise security policies sometimes mandate changing passwords for such accounts. Such policies can be inconvenient, but they are a fact of life. You will need to change passwords on the required schedule. Then ensure that you update target monitoring properties so that they are continuously monitored. It’s ideal if you can script or otherwise automate password resets, and also the needed updating of monitoring properties that is subsequent to them.
Summary
You have seen that Enterprise Manager Cloud Control 12c provides a standardized monitoring solution for IT infrastructure and applications. It provides increased operational efficiency by automating the workflow of assigning targets to groups, applying templates, and managing target memberships. With proper planning of standards and operational procedures, Enterprise Manager also provides significant benefits to administrators by enabling consistent event, incident, and problem management through rule sets. Finally, you have learned best practices for the aforementioned features that will make managing and monitoring your environment even more seamless when using EM12c.