
![]()
Common Administration Tasks
In this chapter, you’ll read how to perform some common administration tasks on SUSE Linux Enterprise Server. You’ll read how to manage printers, software, and tasks and processes, and you’ll also learn how to schedule tasks and set up an environment for logging.
Even if printers, on many occasions, are connected to print servers, SUSE Linux Enterprise Server (SLES) contains everything that is needed to manage printers. Printers that are connected locally are supported, as is the case for printers that are connected to some other print server, no matter if that is a dedicated hardware print server or a software print server that is defined on another computer.
To communicate to printers, the Common UNIX Printing System (CUPS) is used. This is a process that monitors print queues for print jobs and forwards these jobs to the appropriate printer. In this section, you’ll read how to manage printers from YaST as well as the command line.
Managing Printers from YaST
To manage printers from YaST, you have to select the Hardware ![]() Printer tool. Before doing anything, this tool will tell you that it is going to restart the CUPS daemon that is started by default upon installation. As you probably don’t have any printers configured yet, that is no problem, so select Yes to proceed configuring printers.
Printer tool. Before doing anything, this tool will tell you that it is going to restart the CUPS daemon that is started by default upon installation. As you probably don’t have any printers configured yet, that is no problem, so select Yes to proceed configuring printers.
At this point, you should see the interface that can be seen in Figure 5-1. From this interface, you can configure all properties of printers on your server.

Figure 5-1. Configuring printers from YaST
To create new printers, you start from the Printer Configurations screen. From that screen, select Add to create a new printer. This starts a printer detection process. CUPS is rather good in detecting printers. If the printer is hardware connected to your server, the udev process (discussed in Chapter 8) will find it and initialize it. If it’s on the network, the CUPS process will detect it.
For some types of printer connection, automatic detection doesn’t work out well. If that is the case, you can manually start the Connection Wizard. From its first screen, you can first select the type of printer, after which you can specify the further printer properties. The options are divided into four different categories.
- Directly Connected Device: This is for any printer that is directly connected to your computer. In general, these types of printers will auto-install themselves, so normally, you won’t have to configure any of these.
- Network Printers: These printers may need some help getting configured, as depending on the configuration of your network, the automatic detection may fail.
- Print Server: These are printers configured on another computer. They may require additional configuration also.
- Special: This is a rarely used option that allows administrators to configure special printer types, such as sending printer data directly to another program.
After configuring printers this way, the CUPS process on your server will give access to the printer, no matter if it is a local printer or a remote printer. You can next access it from the command line and from applications running on your computer.
Command-Line Printer Management Tools
Once printers have been installed—which, as you’ve read, can be done in quite an easy way—as an administrator, you might want to perform some management tasks on them. Managing the printer often relates to the print jobs that are in the queue. Some commands are available to manage print jobs, as follows:
- lpstat: Provides information about printers. This command offers many options that allow you to query the print queue. For example, use lpstat -l to show a list of printers, classes, or jobs, lpstat -W all for an overview of jobs and their current status, or lpstat -p to get a list of printers that are available on a specific host.
- lpr: The lpr command submits files for printing. It will send them to the default printer, unless the option -P is used to specify another destination to send print jobs to. While lpr is the old UNIX command, on Linux, the lp command normally is used to send print jobs to a printer.
- lpadmin: Allows administrators to create printers. Basically, everything that can be done from YaST can be done with lpadmin as well. The command has a large amount of options to specify exactly what needs to be done.
- lpq: Will show you which print jobs are in the print queue.
- lprm: Provides an easy-to-use interface to remove jobs from a print queue.
An important task for an SUSE Linux Enterprise Server (SLES) administrator is managing software. Two systems are available for software management: the old RPM and the new Zypper-based system. Before explaining the details of both systems, it’s good to have some generic understanding of the use of repositories.
Understanding Repositories and Meta Package Handlers
When programmers write a program, they normally don’t develop something that contains all that is required. Programmers tend to focus on specific functionality and will get the rest from libraries that have been written by someone else. This is called a dependency. In order to install a specific program, other items must already be available on the system where the program is installed.
These dependencies are reflected in software package management. An administrator may select to install a single package, but to install that package, all of its dependencies have to be installed as well. In the old days, when packages were installed directly, that often led to challenges. An administrator who wanted to install one package might get the response that some dependencies were missing, and these dependencies might even have had their own dependencies. This is what was referred to as dependency hell.
In current Linux distributions, meta package handlers are used. In a meta package handler, repositories are used for installing software. A repository is an installation source containing a collection of packages. The servers and workstations on which software has to be installed are normally configured to use multiple repositories and will regularly download an index of available packages. If when working with repositories administrators have to install software, all dependencies are looked up in the index files, and if the dependency is found, it is installed automatically.
In the way package management is organized on SUSE Linux, apart from repositories, there are also services involved. A service manages repositories or does some special task. Currently, the only type of service that is supported is the Repository Index Service (RIS). RIS contains a list of other repositories, which are indexed by using this list. This offers the benefit that in case many repositories are used, indexes don’t have to be downloaded for every individual repository but can be downloaded for many repositories at the same time. This makes working with repositories faster.
On SUSE Linux Enterprise, packages can be installed individually as packages in the RPM format. They can also be installed from repositories, using Zypper or YaST. In the next subsection, you’ll learn how to install packages using these tools.
Installing Software from YaST
YaST offers everything an administrator needs for installing and managing software. To configure the large amount of options available, you’ll select the Software category from YaST. This shows the following different options:
- Online Update: This performs an update of your server against the repositories it has been configured to use.
- Software Management: Use this for common package management tasks, such as installing, deleting, updating, and more.
- Add-On Products: Add-On products such as the High Availability Extension are available for purchase on SLES. To install such an Add-On Product, this option from YaST is used.
- Media Check: This option can be used to verify that the installation medium does not contain any errors.
- Software Repositories: This option is used to define the repositories that will be used on this server
Apart from the options that are offered from this YaST interface, in large environments, SUSE Manager can be used for managing software. From SUSE Manager, multiple packages and patches can be selected, and these can be installed on multiple servers in an automated way. Using SUSE Manager is highly recommended in an environment in which many servers have to be managed. You can read more about SUSE Manager in Chapter 18.
Managing Repositories
Before an administrator can start managing software, software repositories must be available. After selecting the Software Repositories option from YaST, you’ll see the screen shown in Figure 5-2. Normally in this list, you’ll at least see the installation medium that was used while installing SLES. If your server is registered, you’ll also see the SUSE update repositories, which are provided by SUSE to make sure that you’ll always be using the latest version of available software.
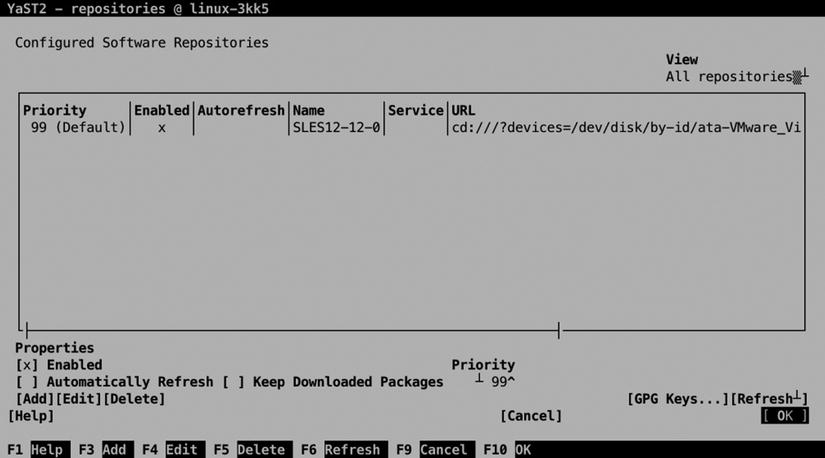
Figure 5-2. The Software Repositories management interface
To add a new repository, you can select the Add option. This opens the screen that you can see in Figure 5-3. From this, you can specify the source of the repository. As you can see, every possible type of installation source is supported. To add a repository, you have to specify the URL for that specific repository. You can also specify whether you want to download repository description files. This is done by default, and it’s a good idea to do it, because it makes the index of the selected repository available on your computer.
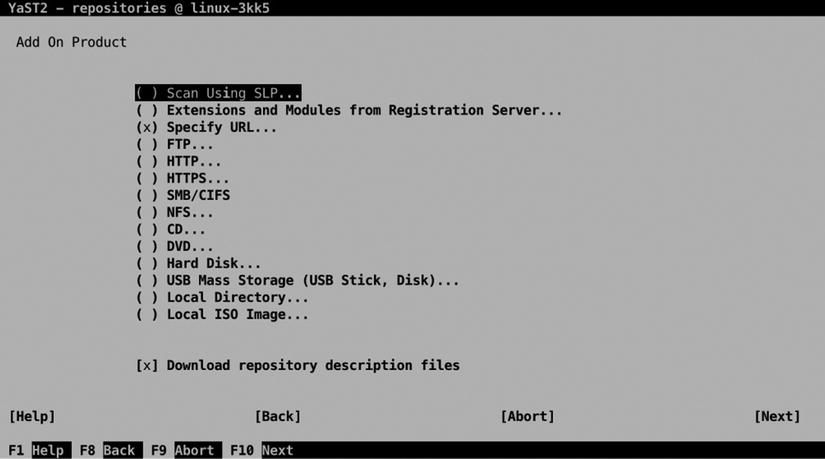
Figure 5-3. Selecting the source for the new repository
After selecting which type of repository you want to add, the screen that you can see in Figure 5-4 opens. On this screen, you can enter a repository name and the name of the location of the repository. For repositories that are on a server, this consists of a server name and path; for local repositories, it’s only the path. YaST allows you to use two different kinds of repositories. A repository can contain a list of RPM files or an ISO image. If the repository contains an ISO image, you’ll have to select the ISO image option as well, after which you can select the ISO image to be used. This will loop-mount the ISO image, to make it available on your computer.

Figure 5-4. Specifying repository properties
From the list of available repositories, you can perform some management tasks as well. To start with, you can enable a repository. If you know that a repository will be unavailable for some time, it makes sense to tell it. If your server knows that a repository is temporarily unavailable, it won’t try to install software from the repository. So, if you have to bring down a repository for maintenance, make sure to disable it as well.
The Autorefresh option makes sense on an online repository. This option tells your computer to fetch updated index files every day, so that your server is completely up to date about the most current state of packages. Another useful option is Priority. If you’re working with multiple repositories, there is a risk that conflicts between package versions arise. In case of a conflict, the Priority option makes clear which package version takes precedence. The last option is Keep Downloaded Packages. If your Internet connection is slow, it may be beneficial to use this option in order to cache packages locally.
Managing Software Packages
After configuring the repositories, you can start managing software. For this purpose, YaST offers the interface that you can see in Figure 5-5. The most important item in this interface is the Filter option. By default, it is on Search, but by pressing the down arrow key, other options can be selected as well. Before you do anything, make sure to select the option you need from this list.
- Patterns: With the Patterns option, the software is presented in different categories. By selecting a pattern, you can easily select all the software you need for a specific purpose.
- Languages: Use this option if you need a specific language version of packages. The amount of packages available in a specific language often doesn’t go much beyond the browser language.
- RPM Groups: RPM groups are another way of grouping RPM packages, as in the Patterns option. Use this option if you want to browse software according to the category of software packages.
- Repositories: Use this if you’re looking for packages from a specific repository.
- Search: Use this option if you want to search for a package with a specific name.
- Installation Summary: This option summarizes the work to be done, before actually starting it.
- Package Classification: Every package, by default, has a classification. This classification gives a hint as to whether or not a package is needed on your server. Use this option to browse packages according to their current classification: Recommended, Suggested, Orphaned, or Unneeded.

Figure 5-5. Managing packages from YaST
Installing Software Using the Patterns Option
The Patterns option provides a convenient way for installing software packages. This is the same interface as that used during the initial installation of SLES (see Figure 5-6).
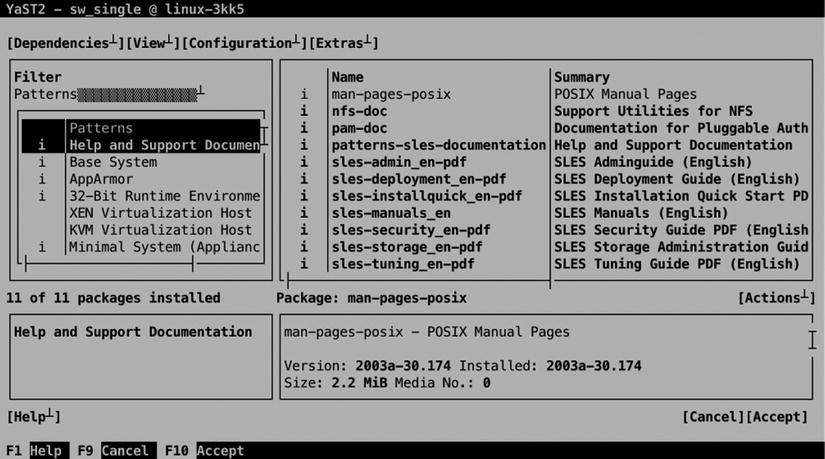
Figure 5-6. Managing packages through the Patterns interface
Managing packages through the Patterns interface is relatively easy. Just select the pattern you want to install and press the space bar to select all packages within this category. This makes the current status of the package category (a + is put in front of the category name), and it will select all packages with a classification of Recommended in this category. Before starting the actual installation, the administrator can change the default suggestion by selecting the Action menu. This menu shows a drop-down list from which the status of individual packages can be changed. Packages can be (de-)selected for installation easily, by pressing the space bar. Also, you may select to Update a package or to make it a Taboo package or a Locked package. If the package is locked, it will never be upgraded. If it’s marked as a Taboo package, it will never be installed.
When managing software packages, it’s also a good idea to consider dependencies. Different options are available through the Dependencies menu option (see Figure 5-7).
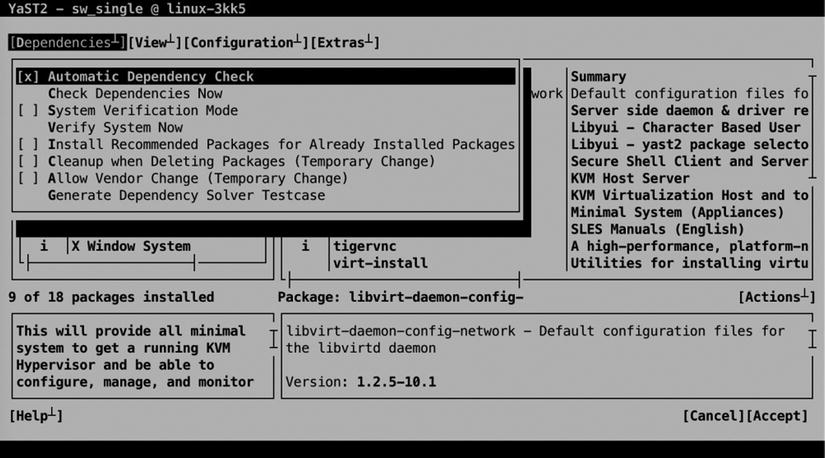
Figure 5-7. Managing package dependency options
The default setting is that dependencies are checked automatically. That means that before installing software packages, a check is performed to find out which requirements there are to install the selected package. Another useful option that is presented through the Dependencies menu is System Verification Mode. This mode allows you to verify that the state of the system is consistent with the actual packages that you have selected. You can set both of these options as default options, but it’s also possible to run them on your system now, by selecting the appropriate option from the Dependencies menu.
While installing software through YaST, you can use the options in the View menu to get more information about selected packages (see Figure 5-8). This option goes into the RPM package itself to request specific installation. The most interesting of the view options are the File list and the Dependencies list. The File list shows the exact contents of the package, and by selecting Dependencies, you can manually examine what else is required on this system before the package can be installed. You’ll see the results of the View option you have selected in the lower right part of the YaST package management screen.

Figure 5-8. Examining package contents prior to installation
After selecting one or more packages for installation, an overview of Package Dependencies is provided. If there are problems preventing the package to be installed normally, you’ll be prompted as to what to do. In general, the very first option listed is also the best option. In Figure 5-9, you can see an example of such a problem.
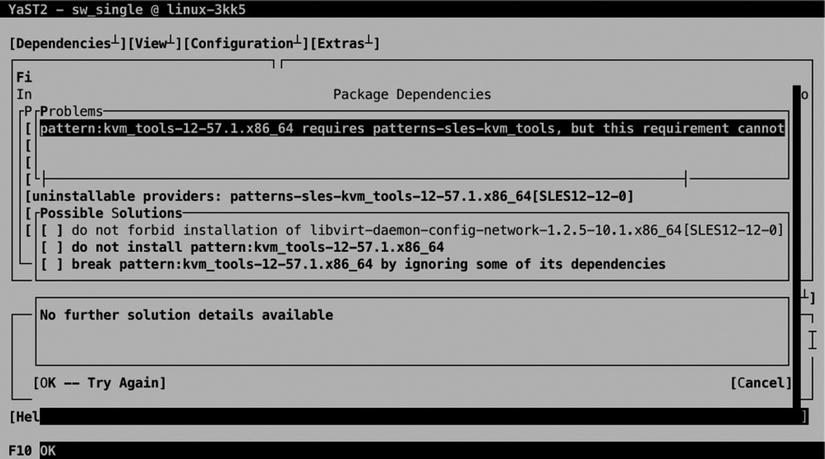
Figure 5-9. Fixing package dependency problems
If no problems became manifest, you’ll see a window listing the automatic changes that will be applied. Read through the list of packages that is going to be installed, and if you’re OK with it, press OK to start the installation.
Installing Software from the Command Line
While YaST offers an easy-to-use interface for packages installation, SUSE offers some good command-line utilities also. To work on individual packages, the rpm command is useful; to manage software, the zypper utility is what you need. You’ll find yourself working with zypper more frequently than with rpm, because zypper offers all you need to install, update, and remove packages.
Managing Software Packages with zypper
zypper is the command-line tool that you want to use for installing, removing, and updating packages—and more. Typically, the first step to perform, if you have to install a package, is zypper se, which allows you to search packages. zypper search will also work, but why would you want to type a long command if there’s a short alternative, right?
The zypper se command shows a list of results corresponding to what you were looking for, including the current state of the package. By default, zypper se performs a match on partial expressions. That means that if you type zypper se ap, you’ll receive a list of all packages matching the string 'ap'. zypper also knows how to treat regular expressions: make sure the search string is between single quotes, if you’re looking for a regex match.
Note that zypper se will search in the package name or description but not in the package contents. That means that you may be missing a specific package while looking for it with zypper se. If you want to look into the package, to look for a package containing a specific file, you can use zypper se --provides filename. Note that most binary files will also be found when using zypper se, but if you have to go down in a bit more detail, the --provides utility may be useful.
After finding the package you want to install with zypper se, you may want to get additional details about it. The command zypper info will do that for you. Type zypper info packagename, if you only want some generic information about the package (see Listing 5-1).
Listing 5-1. zypper info Provides Generic Information About a Specific Package
linux-3kk5:~ # zypper info nmap
Loading repository data...
Reading installed packages...

Information for package nmap:
-----------------------------
Repository: SLES12-12-0
Name: nmap
Version: 6.46-1.62
Arch: x86_64
Vendor: SUSE LLC <https://www.suse.com/>
Installed: No
Status: not installed
Installed Size: 16.4 MiB
Summary: Portscanner
Description:
  Nmap is designed to allow system administrators and curious individuals
  to scan large networks to determine which hosts are up and what
  services they are offering. XNmap is a graphical front-end that shows
  nmap's output clearly.
  Find documentation in /usr/share/doc/packages/nmap
If you need more specific information about the package, you may appreciate some of the additional options that zypper info provides. You can, for example, receive information about a package from a specific repository, if zypper se has shown that the package is available from different repositories. Use zypper info -r, followed by the URL or name of the repository, to do that.
The zypper info command provides some other useful options also. Use zypper info --provides packagename, for example, to find out exactly what is in a package, or zypper info --requires packagename, to determine which software has to be installed for a package to be functional.
Of course you can use zypper to work with patterns also. Start by typing zypper pt, to show a list of all available patterns. This gives a result as in Listing 5-2.
Listing 5-2. The zypper pt Command Shows All Software Patterns
linux-3kk5:~ # zypper pt
Loading repository data...
Reading installed packages...
S | Name             | Version | Repository  | Dependency
--+------------------+---------+-------------+-----------
  | 32bit            | 12-57.1 | SLES12-12-0 |
i | 32bit            | 12-57.1 | @System     |
  | Basis-Devel      | 12-57.1 | SLES12-12-0 |
  | Minimal          | 12-57.1 | SLES12-12-0 |
i | Minimal          | 12-57.1 | @System     |
  | WBEM             | 12-57.1 | SLES12-12-0 |
  | apparmor         | 12-57.1 | SLES12-12-0 |
i | apparmor         | 12-57.1 | @System     |
  | base             | 12-57.1 | SLES12-12-0 |
i | base             | 12-57.1 | @System     |
  | dhcp_dns_server  | 12-57.1 | SLES12-12-0 |
  | directory_server | 12-57.1 | SLES12-12-0 |
  | documentation    | 12-57.1 | SLES12-12-0 |
i | documentation    | 12-57.1 | @System     |
  | file_server      | 12-57.1 | SLES12-12-0 |
  | fips             | 12-57.1 | SLES12-12-0 |
  | gateway_server   | 12-57.1 | SLES12-12-0 |
  | gnome-basic      | 12-5.1  | SLES12-12-0 |
i | gnome-basic      | 12-5.1  | @System     |
  | kvm_server       | 12-57.1 | SLES12-12-0 |
i | kvm_server       | 12-57.1 | @System     |
  | kvm_tools        | 12-57.1 | SLES12-12-0 |
i | kvm_tools        | 12-57.1 | @System     |
  | lamp_server      | 12-57.1 | SLES12-12-0 |
  | mail_server      | 12-57.1 | SLES12-12-0 |
  | ofed             | 12-57.1 | SLES12-12-0 |
  | oracle_server    | 12-57.1 | SLES12-12-0 |
  | printing         | 12-57.1 | SLES12-12-0 |
  | sap_server       | 12-57.1 | SLES12-12-0 |
  | x11              | 12-57.1 | SLES12-12-0 |
i | x11              | 12-57.1 | @System     |
  | xen_server       | 12-57.1 | SLES12-12-0 |
  | xen_tools        | 12-57.1 | SLES12-12-0 |
Next, to find out what exactly is in the pattern, you can use zypper info -t pattern patternname, as in zypper info -t pattern fips, which shows a description and a list of all packages in the fips pattern.
After getting the required information about packages, you can move on and install them, using zypper in. You can, of course, just perform a basic installation, by using zypper in packagename, but you can also do a somewhat more sophisticated installation, such as zypper in vim -nano, which will install Vim and remove nano at the same time. Instead of installing individual packages, you can install patterns as well, as in zypper in -t pattern fips. In case your attempt to install packages results in an error message, you can insist a bit more by adding the -f option.
A specific case of installation is source packages. These are packages that don’t contain ready-to-use binaries but the source code of these packages. On occasion, you may need these if you have to do some tweaking of the package source code. To install a source package, you’ll use zypper si instead of zypper in.
A specific kind of package operation that you can do using zypper is patch management. That starts by typing zypper list-patches, to show a list of all patches that are available. To get more information about a specific patch, you can next type zypper info -t patch name. If you like all patches and want to install them, you can use zypper patch. This command, however, has some additional options also, such as zypper patch -b ###, in which ### is replaced with a bugzilla patch number. This command allows you to install patches as documented in a specific bugzilla patch number. Related to the patch commands is the up command, which just upgrades all packages that have an upgrade available.
When performing an update, normally all packages are updated. This is often OK, but on some occasions, it is not. A program might require a specific version of a package to be installed. To make sure a package will never be upgraded, you can create a lock. Use zypper addlock package to put a lock on a specific package name. This guarantees that it will never be updated. To get an overview of packages that are locked, use zypper ll.
EXERCISE 5-1. MANAGING SOFTWARE WITH ZYPPER
In this exercise, you’ll learn how to work with some of the essential zypper commands.
- Type zypper se nmap. This will search for packages containing nmap in their package name or description.
- Type zypper info nmap to get more information about the nmap package. To see what will be installed with it, use zypper info --provides nmap, and to find out about its dependencies, type zypper info --requires nmap.
- Now that you know more about the package, you can type zypper in nmap to install it.
- Working with patterns is also convenient. Type zypper se -t pattern to show a list of all patterns that are available.
- Request more information about the fips pattern, by typing zypper info -t pattern fips.
- Assuming that you like what it is doing, install fips, using zypper in -t pattern fips.
- To make sure that nmap will never be upgraded, type zypper addlock nmap. Verify that the lock has successfully been set, using zypper ll. To remove the lock again, use zypper rl nmap.
Querying Packages with rpm
The zypper command, in general, is used to manage software installations and upgrades. Once the software has been installed, the RPM database keeps track of it. On a modern Linux server such as SLES 12, you won’t use the rpm command anymore to install, update, or remove software. It is still convenient, however, for querying software and its current state.
There are two types of RPM query that can be performed. The database can be queried, and package files can be queried. To query the database, you’ll use rpm -q, followed by the specific query option. To query a package file, you’ll use rpm -qp, followed by the specific query option. There are a few useful query options, as follows:
- -l Lists package contents
- -i Lists information about a package
- -c Lists configuration files included in the package
- -d Lists documentation provided by a package
- -f Lists the name of the RPM a specific file belongs to
In Exercise 5-2, you’ll work with some of the most significant query options.
EXERCISE 5-2. USING RPM QUERIES
Have you ever been in a situation in which you needed to find the configuration file that is used by a specific binary? This exercise shows exactly what you can do in such cases. We’ll use the vsftpd binary as an example.
- To begin with, you need the exact name of the binary you want to query. Type which vsftpd to find out. It will show the name /usr/sbin/vsftpd.
- Now we have to find out which RPM this file comes from. The command rpm -qf /usr/sbin/vsftpd will do that for us and show vsftpd as the RPM name. It shows a version number as well, but for querying the database, the version number is not important.
- Now let’s read the package description. Type rpm -qi vsftpd to get more information.
- To get a list of all files in the package, type rpm -ql vsftpd.
- To see which files are used for its configuration, use rpm -qc vsftpd.
- And if you have to read some more documentation before you can begin, type rpm -qd vsftpd.
Most of the work that you’ll be doing as a Linux administrator will be done from a terminal window. To start a task, you’ll type a specific command. For example, you’ll type ls to display a listing of files in the current directory. Every command you type, from the perspective of the shell, is started as a job. Most commands are started as a job in the foreground. That means the command is started; it shows its result on the terminal window; and then it exists. As many commands only take a short while to complete their work, you don’t have to do any specific job management on them.
While some commands only take a few seconds to finish, other commands take much longer. Imagine, for example, the mandb command that is going to update the database that is used by the man -k command. This command can easily take a few minutes to complete. For commands such as these, it makes sense to start them as a background job, by putting an & sign (ampersand) at the end of the command, as in the following example:
mandb &
By putting an & at the end of a command, you start it as a background job. While starting a command this way, the shell gives its job number (between square brackets), as well as its unique process identification number, the PID. You can use these to manage your background jobs, as is explained in the following paragraphs.
The benefit of starting a job in the background is that the terminal is available to launch other commands, and that is good, if the job takes a long time to complete. At the moment the background job is finished, you’ll see a message that it has completed, but this message is only displayed after you’ve entered another command to start.
To manage jobs that are started in the background, there are a few commands and key sequences that you can use (see Table 5-1).
Table 5-1. Managing Shell Jobs
Command/Key Sequence | Use |
|---|---|
Ctrl+Z | Use this to pause a job. Once paused, you can put it in the foreground or in the background. |
fg | Use this to start a paused job as a foreground job. |
bg | Use this to start a paused job as a background job. |
jobs | Use this to show a list of all current jobs. |
Normally, you won’t do too much job management, but in some cases, it does make sense to move a job you’ve already started to the background, so that you can make the terminal where it was started available for other tasks. Exercise 5-3 shows how to do this.
EXERCISE 5-3. MANAGING JOBS
In this exercise, you’ll learn how to move a job that was started as a foreground job to the background. This can be especially useful for graphical programs that are started as a foreground job and occupy your terminal until they have finished.
- From a graphical user interface, open a terminal, and from that terminal, start the gedit program. You will see that the terminal is now occupied by the graphical program you’ve just started, and at this moment, you cannot start any other programs.
- Click in the terminal where you started gedit and use the Ctrl+Z key sequence. This temporarily stops the graphical program and gives back the prompt on your terminal.
- Use the bg command to move the job you’ve started to the background.
- From the terminal window, type the jobs command. This shows a list of all jobs that are started from this terminal. You should see just the gedit command. In the list that the jobs command shows you, every job has a unique job number. If you have only one job, it will always be job number 1.
- To put a background job back in the foreground, use the fg command. By default, this command will put the last command you’ve started in the background back in the foreground. If you want to put another background job in the foreground, use fg, followed by the job number of the job you want to manage, for example, fg 1.
![]() Note Job numbers are specific to the shell in which you’ve started the job. That means that if you have multiple terminals that are open, you can manage jobs in each of these terminals.
Note Job numbers are specific to the shell in which you’ve started the job. That means that if you have multiple terminals that are open, you can manage jobs in each of these terminals.
System and Process Monitoring and Management
In the preceding text, you’ve learned how to manage jobs that you have started from a shell. As mentioned, every command that you’ve started from the shell can be managed as a job. There are, however, many more tasks that are running on any given moment on your server. These tasks are referred to as processes.
Every command you enter or program you start from the shell becomes not only a job but also a process. Apart from that, when your server boots, many other processes are started to provide services on your server. These are the so called daemons—processes that are always started in the background and provide services on your server. If, for example, your server starts an Apache web server, this web server is started as a daemon.
For a system administrator, managing processes is an important task. You may have to send a specific signal to a process that doesn’t respond properly anymore. Otherwise, on a very busy system, it is important to get an overview of your system and check exactly what it is doing. You will use a few commands to manage and monitor processes on your computer (see Table 5-2).
Table 5-2. Common Process Management Commands
Command | Use |
|---|---|
ps | Used to show all current processes |
kill | Used to send signals to processes, such as asking or forcing a process to stop |
pstree | Used to give an overview of all processes, including the relation between parent and child processes |
killall | Used to kill all processes, based on the name of the process |
top | Used to get an overview of the current system activity |
Managing Processes with ps
As an administrator, you might need to find out what a specific process is doing on your server. The ps command helps you with that. If started as root with the appropriate options, ps shows information about the current status of processes. Owing to historical reasons, the ps command can be used in two different modes: the BSD mode, in which options are not preceded by a - sign, and the System V mode, in which all options are preceded by a - sign. Between these two modes, there are options with an overlapping functionality.
Two of the most useful ways to use the ps commands are in the command ps fax, which gives a tree-like overview of all current processes, and ps aux, which gives an overview with lots of usage information for every process. Listing 5-3 shows a partial output of the ps aux command.
Listing 5-3. Partial Output of the ps aux Command
linux-3kk5:~ # ps aux | head -n 10
USER       PID %CPU %MEM    VSZ   RSS TTY      STAT START   TIME COMMAND
root         1  0.0  0.3  33660  3468 ?        Ss   Sep19   0:05 /usr/lib/systemd/systemd --switched-root --system --deserialize 19
root         2  0.0  0.0      0     0 ?        S    Sep19   0:00 [kthreadd]
root         3  0.0  0.0      0     0 ?        S    Sep19   0:00 [ksoftirqd/0]
root         5  0.0  0.0      0     0 ?        S<   Sep19   0:00 [kworker/0:0H]
root         7  0.0  0.0      0     0 ?        S    Sep19   0:00 [migration/0]
root         8  0.0  0.0      0     0 ?        S    Sep19   0:00 [rcu_bh]
root         9  0.0  0.0      0     0 ?        S    Sep19   0:01 [rcu_sched]
root        10  0.0  0.0      0     0 ?        S    Sep19   0:01 [watchdog/0]
root        11  0.0  0.0      0     0 ?        S    Sep19   0:00 [watchdog/1]
If using ps aux, process information is shown in different columns:
USER | The name of the user whose identity is used to run this process |
PID | The process identification number (PID), a unique number that is needed to manage processes |
%CPU | The percentage of CPU cycles used by this process |
%MEM | The percentage of memory used by this process |
VSZ | The Virtual Memory Size, the total amount of memory that is claimed by this process. It is normal that processes claim much more memory than the amount of memory they really need. That’s no problem, because the memory in the VSZ column isn’t used anyway |
RSS | The Resident memory size, the total amount of memory that this process is really using |
TTY | If the process is started from a terminal, the device name of the terminal is mentioned in this column |
STAT | The current status of the process. The top three most common status indicators are S for sleeping, R for running, or Z for a process that has entered the zombie state |
START | The time that the process was started |
TIME | The real time in seconds that this process has used CPU cycles since it was started |
COMMAND | The name of the command file that was used to start the process. If the name of this file is between brackets, it is a kernel process |
Another common way to show process information is by using the command ps fax. The most useful addition in this command is the f option, which shows the relation between parent and child processes. For an administrator, this is important information to be aware of, because for process management purposes, this relation is important. Managing of processes goes via the parent process. That means that in order to kill a process, you must be able to contact the parent of that specific process. Also, if you kill a process that currently has active children, all of the children of the process are terminated as well. In Exercise 5-4, you can find out for yourself how this works.
Sending Signals to Processes with the kill Command
To manage processes as an administrator, you can send signals to the process in question. According to the POSIX standard—a standard that defines how UNIX-like operating systems should behave—different signals can be used. In practice, only a few of these signals are always available. It is up to the person who writes a program to determine which signals are available and which are not.
A well-known example of a command that offers more than the default signals is the dd command. When this command is active, you can send SIGUSR1 to the command, to show details about the current progress of the dd command.
Three signals are available at all times: SIGHUP (1), SIGKILL (9), and SIGTERM (15). Of these, SIGTERM is the best way to ask a process to stop its activity. If as an administrator you request closure of a program, using the SIGTERM signal, the process in question can still close all open files and stop using its resources.
A more brutal way of terminating a process is by sending it SIGKILL, which doesn’t give any time at all to the process to cease its activity. The process is just cut off, and you risk damaging open files.
A completely different way of managing processes is by using the SIGHUP signal, which tells a process that it should reinitialize and read its configuration files again.
To send signals to processes, you will use the kill command. This command typically has two arguments: the number of the signal that you want to send to the process and the PID of the process to which you want to send a signal. An example is the command kill -9 1234, which will send the SIGKILL signal to the process with PID 1234.
When using the kill command, you can use the PIDs of multiple processes to send specific signals to multiple processes simultaneously. Another convenient way to send a signal to multiple processes simultaneously is by using the killall command, which takes the name of a process as its argument. For example, the command killall -SIGTERM vsftpd would send the SIGTERM signal to all active httpd processes.
EXERCISE 5-4. MANAGING PROCESSES WITH PS AND KILL
In this exercise, you will start a few processes to make the parent-child relation between these processes visible. Next, you will kill the parent process and see that all related child processes also disappear.
- Open a terminal window (right-click the graphical desktop and select Open in Terminal).
- Use the bash command to start bash as a subshell in the current terminal window.
- Use ssh -X localhost to start ssh as a subshell in the bash shell you’ve just opened. When asked if you permanently want to add localhost to the list of known hosts, type “yes.” Next, enter the password of the user root.
- Type gedit & to start gedit as a background job.
- Type ps efx to show a listing of all current processes, including the parent-child relationship between the commands you’ve just entered.
- Find the PID of the SSH shell you’ve just started. If you can’t find it, use ps aux | grep ssh. One of the output lines shows the ssh -X localhost command you’ve just entered. Note the PID that you see in that output line.
- Use kill, followed by the PID number you’ve just found to close the SSH shell. As the SSH environment is the parent of the gedit command, killing ssh will kill the gedit window as well.
Using top to Show Current System Activity
The top program offers a convenient interface in which you can monitor current process activity and perform some basic management tasks. Figure 5-10 shows what a top window might look like.
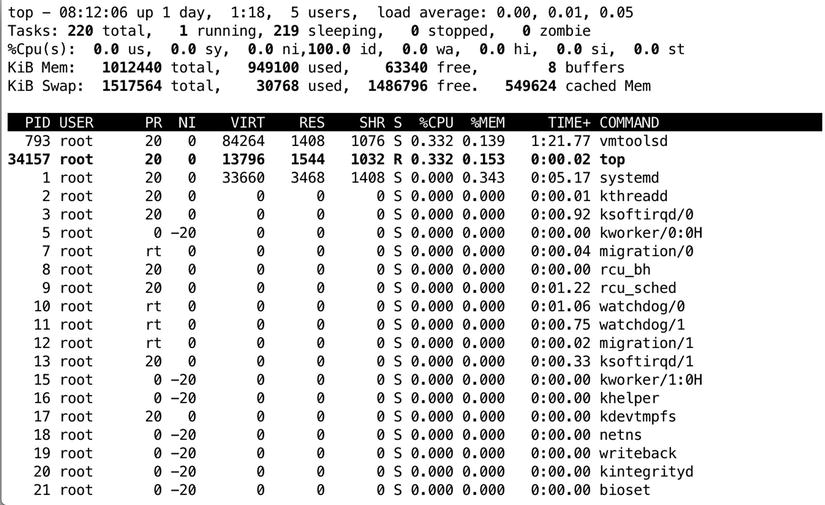
Figure 5-10. Monitoring system activity with top
In the upper five lines of the top interface, you can see information about the current system activity. The lower part of the top window shows a list of the most active processes at the moment, which is refreshed every five seconds. If you notice that a process is very busy, you can press the k key from within the top interface to terminate that process. top will next first ask for the PID of the process to which you want to send a signal (PID to kill). After entering this, it will ask which signal you want to send to that PID, and next, it will operate on the requested PID immediately.
In the upper five lines of the top screen, you’ll find a status indicator of current system performance. The most important information you’ll find in the first line is the load average. This gives in three different figures the load average of the last minute, the last five minutes, and the last fifteen minutes.
To understand the load average parameter, you should understand that it reflects the average amount of processes in the run queue, which is the queue in which processes wait before they can be handled by the scheduler. The scheduler is the kernel component that ensures a process is handled by any of the CPU cores in your server. A rough starting point to estimate if your system can handle its workload is that roughly the amount of processes waiting in the run queue should never be higher than the total amount of CPU cores in your server. A quick way to find out how many CPU cores are in your server is by pressing the 1 key from the top interface. This will show you one line for every CPU core in your server.
In the second line of the top window, you’ll see how many tasks your server is currently handling and what each of these tasks is currently doing. In this line, you may find four different status indications, as follows:
- Running: The number of processes that have been active in the last polling loop
- Sleeping: The number of processes that are currently loaded in memory but haven’t issued any activity in the last polling loop
- Stopped: The number of processes that have been sent a stop signal but haven’t freed all of the resources they were using
- Zombie: The number of processes that are in a zombie state. This is an unmanageable process state in which the parent of the zombie process has disappeared and the child still exists but cannot be managed anymore, because you need the parent of a process to managethat process.
A zombie process normally is the result of bad programming. If you’re lucky, zombie processes will go away by themselves. Sometimes they don’t, and that can be an annoyance. If that’s the case, the only way to clean up your current zombie processes is by rebooting your server.
In the third line of top, you get an overview of the current processor activity. If you’re experiencing a problem (which is typically expressed by a high load average), the %Cpu(s) line tells you exactly what the CPUs in your server are doing. When trying to understand current system activity, it is good to be aware that the %Cpu(s) line summarizes all CPUs in your system. For a per-CPU overview of the current activity, press the 1 key from the top.
In the %Cpu(s) line, you’ll find the following information about CPU status:
- us: The percentage of time your system is spending in user space, which is the amount of time your system is handling user-related tasks
- sy: The percentage of time your system is working on kernel-related tasks in system space. This should on average be (much) lower than the amount of time spent in user space
- ni: The amount of time your system has worked on handling tasks of which the nice value has been changed (see next section)
- id: The amount of time the CPU has been idle
- wa: The amount of time the CPU has been waiting for I/O requests. This is a very common indicator of performance problems. If you see an elevated value here, you can make your system faster by optimizing disk performance. See Chapter 15 for more details about performance optimization
- hi: The amount of time the CPU has been handling hardware interrupts
- si: The amount of time the CPU has been handling software interrupts
- st: The amount of time that has been stolen from this CPU. You’ll see this only if your server is a virtualization hypervisor host, and this value will increase at the moment that a virtual machine running on this host requests more CPU cycles
In the last two lines of the top status information, you’ll find current information about memory usage. The first line contains information about memory usage; the second line has information about the usage of swap space. The formatting is not ideal, however. The last item on the second line gives information that really is about the usage of memory. The following parameters show how memory currently is used:
- Mem: The total amount of memory that is available to the Linux kernel
- used: The total amount of memory that currently is used
- free: The total amount of memory that is available for starting new processes
- buffers: The amount of memory that is used for buffers. In buffers, essential system tables are stored in memory, as well as data that remains to be committed to disk
- cached: The amount of memory that is currently used for cache
The Linux kernel tries to use system memory as efficiently as possible. To accomplish this goal, the kernel caches a lot. When a user requests a file from disk, it is first read from disk and copied to RAM. Fetching a file from disk is an extremely slow process, compared to fetching the file from RAM. For that reason, once the file is copied in RAM, the kernel tries to keep it there as long as possible. This process is referred to as caching.
From the top interface, you can see the amount of RAM that currently is used for caching of data. You’ll notice that the longer your server is up, the more memory is allocated to cache, and this is good, because the alternative to use memory for caching would be to do nothing at all with it. The moment the kernel needs memory that currently is allocated to cache for something else, it can claim this memory back immediately.
Related to cache is the memory that is in buffers. In here, the kernel caches tables and indexes that it needs in order to allocate files, as well as data that still has to be committed to disk. Like cache, the buffer memory is also memory that can be claimed back by the kernel immediately, but you should make sure that a minimal amount of buffers, as well as cache, is available at all times. See Chapter 15 for further details.
As an administrator, you can tell the kernel to free all memory in buffers and cache immediately. Make sure that you do this on test servers only, however, because in some cases, it may lead to a crash of the server! To free the memory in buffers and cache immediately, as root, use the command echo 3 > /proc/sys/vm/drop_caches.
Managing Process Niceness
By default, every process is started with the same priority. On occasion, it may happen that some processes require some additional time, or can offer some of their processor time because they are not that important. In those cases, you can change the priority of the process by using the nice command.
When using the nice command, you can adjust the process niceness from -20, which is good for the most favorable scheduling, to 19 (least favorable). By default, all processes are started with a niceness of 0. The following example code line shows how to start the dd command with an adjusted niceness of -10, which makes it more favorable and, therefore, allows it to finish its work faster:
nice -n -10 dd if=/dev/sda of=/dev/null
Apart from specifying the niceness to use when starting a process, you can also use the renice command to adjust the niceness of a command that was already started. By default, renice works on the PID of the process whose priority you want to adjust, so you have to find this PID before using renice. The ps command, which was described earlier in this chapter, explains how to do this.
If, for example, you want to adjust the niceness of the find command that you’ve just started, you would begin by using ps aux | grep find, which gives you the PID of the command. Assuming that would give you the PID 1234, after finding it, you can use renice -10 1234 to adjust the niceness of the command.
Another method of adjusting process niceness is to do it from top. The convenience of using top for this purpose is that top shows only the busiest processes on your server, which typically are the processes whose niceness you want to adjust anyway. After identifying the PID of the process you want to adjust, from the top interface, press r. On the sixth line of the top window, you’ll now see the message PID to renice:. Now, enter the PID of the process you want to adjust. Next, top prompts Renice PID 3284 to value:. Here, you enter the positive or negative nice value you want to use. Next, press Enter to apply the niceness to the selected process. In Exercise 5-5, you can apply these procedures.
EXERCISE 5-5. CHANGING PROCESS PRIORITY
In this exercise, you’ll start four dd processes, which, by default, will go on forever. You’ll see that all of them are started with the same priority and get about the same amount of CPU time and capacity. Next, you’ll adjust the niceness of two of these processes from within top, which immediately shows the effect of using nice on these commands.
- Open a terminal window and use su - to escalate to a root shell.
- Type the command dd if=/dev/zero of=/dev/null & and repeat this four times.
- Now start top. You’ll see the four dd commands listed on top. In the PR column, you can see that the priority of all of these processes is set to 20. The NI column, which indicates the actual process niceness, shows a value of 0 for all of the dd processes, and in the TIME column, you can see that all of the processes use about the same amount of processor time.
- Now, from within the top interface, press r. On the PID to renice prompt, type the PID of one of the four dd processes and press Enter. When asked to provide Renice PID <number> to value:, type 5 and press Enter.
- With the preceding action, you have lowered the priority of one of the dd commands. You should immediately start to see the result in top, as one of the dd processes will receive a significantly lesser amount of CPU time.
- Repeat the procedure to adjust the niceness of one of the other dd processes. Now use the niceness value of -15. You will notice that this process now tends to consume all of the available resources on your computer, which shows that you should avoid the extremes when working with nice.
- Use the k command from the top interface to stop all processes for which you’ve just adjusted the niceness.
Scheduling Tasks
Up to now, you have learned how to start processes from a terminal window. For some tasks, it makes sense to have them started automatically. Think, for example, of a backup job that you want to execute automatically every night. To start jobs automatically, you can use cron.
cron consists of two parts. First, there is the cron daemon, a process that starts automatically when your server boots. This cron daemon checks its configuration every minute to see if there are any tasks that should be executed at that moment.
Some cron jobs are started from the directories /etc/cron.hourly, /etc/cron.daily, /etc/cron.weekly, and /etc/cron.monthly. Typically, as an administrator, you’re not involved in managing these. Programs and services that require some tasks to be executed on a regular basis simply put a script in the directory where they need it, which ensures that the task is automatically executed. Some RPM packages will copy scripts that are to be executed by cron to the /etc/cron.d directory. The files in this directory contain everything that is needed to run a command through cron.
As an administrator, you can start cron jobs as a specific user, by first logging in as that user (or by using su - to take the identity of the user you want to start the cron job as). After doing that, you’ll use the command crontab -e, which starts the crontab editor, which is a vi interface by default. That means that you work from crontab -e the way that you are used to working from vi.
As crontab files are created with crontab -e, you’ll specify on separate lines which command has to be executed at which moment. Following, you can see an example of a line that can be used in crontab:
0 2 * * * /root/bin/runscript.sh
It is very important that you start the definition of cron jobs at the right moment. To do this, five different positions can be used to specify date and time. Table 5-3, following, lists the time and date indicators that can be used.
Table 5-3. cron Time Indicators
Field | Allowed Value |
|---|---|
minute | 0–59 |
hour | 0–23 |
day of month | 1–31 |
month | 1–12 |
day of week 0–7 (0 and 7 are Sunday) |
This means, for example, that in a crontab specification, the time indicator 0 2 3 4 * would translate to minute 0 of hour 2 (which is 2 a.m.) on the third day of the fourth month. Day of the week, in this example, is not specified, which means that the job would run on any day of the week.
In a cron job definition, you can use ranges as well. For example, the line */5 * * * 1-5 would mean that a job has to run every five minutes, but only from Monday until Friday.
After creating the cron configuration file, the cron daemon automatically picks up the changes and ensure that the job will run at the time indicated.
EXERCISE 5-6. CONFIGURING CRON JOBS
In this exercise, you’ll learn how to schedule a cron job. You’ll use your own user account to run a cron job that sends an e-mail message to user root on your system. In the final step, you’ll verify that root has indeed received the message.
- Open a terminal and make sure that you are logged in with your normal user account.
- Type crontab -e to open the crontab editor.
- Type the following line, which will write a message to syslog every five minutes: */5 * * * * logger hello,.
- Use the vi command :wq! to close the crontab editor and safe your changes.
- Wait five minutes. After five minutes, type tail -f /var/log/messages to verify that the message has been written to the logs.
- Go back to the terminal where you are logged in with the normal user account and type crontab -r. This deletes the current crontab file from your user account.
On SLES 12, two different systems are used for logging. The rsyslog service takes care of writing log messages to different files, and the journald service works with systemd to fetch messages that are generated through systemd units and writes that information to the journal. Both can be interconnected also, to ensure that services that are handled by systemd do occur in the journal as well. In this section, you’ll learn how to configure both of these services.
Understanding rsyslog
Since the old days of UNIX, the syslog service has been used for logging information. This service is compatible with many devices, which makes it a true log service that can take care of messages that are generated by multiple devices in the network. rsyslogd is the latest incarnation of syslog, providing full backward compatibility with syslog as well as new features.
The basis of the rsyslogd service configuration is in the file /etc/rsyslog.conf. In this file, logging is configured by the definition of facilities, priorities, and destinations. Also, modules are used to provide additional functionality.
Understanding Facilities
The rsyslog facilities define what needs to be logged. To maintain backward compatibility with syslog, the facilities are fixed, and it’s not possible to add new ones. Table 5-4 gives an overview of facilities and their use.
Table 5-4. Facilities and Their Use
Facility | Use |
|---|---|
auth | Messages related to authentication |
authpriv | Same as auth |
cron | Messages that are generated by the cron service |
daemon | A generic facility that can log messages that are generated by daemons that don’t have their own facilities |
kern | Kernel-related messages |
lpr | Printer-related messages |
Messages that are related to the mail system | |
mark | A special facility that can be used to write log information at a specified interval |
news | Messages related to the NNTP news system |
security | Same as auth |
syslog | Relates to messages that are generated by the rsyslog service |
user | User related messages |
uucp | Messages related to the legacy uucp system |
local0–local7 | Facilities that can be assigned to services that don’t have their own syslog facility |
As you can see in Table 5-4, the facilities available are far from complete, and some commonly used services don’t have their own facility. That is what the facilities local0 through local7 are created for. Many services that don’t do syslog logging by default can be configured to log through one of these facilities. If, for example, an administrator wants Apache to write its log messages to syslog rather than directly to its configuration files, the line Errorlog syslog:local3 can be included in the Apache configuration file. Next in syslog, the local3 facility can be further defined, so that Apache-related log information is written to the right location.
Understanding Priorities
Where the facility defines what should be logged, the priority defines when information should be sent to a log file. Priorities can be debug, info, notice, warning, (or warn), err, (or error), crit, alert, emerg, or panic (which is equivalent to emerg).
While defining a syslog rule, you should always use a facility.priority pair, as in kern.debug, which specifies that the kernel facility should send everything with the priority debug (and higher) to the destination that is specified. When defining facilities and priorities, a scripting language can be used to select the exact conditions under which to write log messages.
Understanding Destinations
The destination defines where messages should be sent. Typically, this will be a file in the /var/log directory. Many alternatives can be used, too, such as the name of a specific console, a remote machine, a database, a specific user or all users who are logged in, and more. If used with output modules (see the next section), the possibilities are many.
Understanding Modules
Apart from facilities, priorities, and destinations, modules can be used. A module is an extension to the original syslog code and adds functionality. Many modules are available to allow syslog to receive messages from specific subsystems or to send messages to specific destinations.
In general, there are two types of modules. The Input Modules (which names that begin in im) are used to filter incoming messages, and the Output Modules (which have names starting with om) are used to send messages in a specific direction. Common modules are immark, which writes marker messages with a regular interval; imuxsock, which allows syslog to communicate to journald; and imudp, which allows for reception of messages from remote servers over UDP.
In Listing 5-4, following, you can see an example of the rsyslog.conf configuration file on SLES 12.
Listing 5-4. Sample rsyslog.conf Configuration File
$ModLoad immark.so
$MarkMessagePeriod      3600

$ModLoad imuxsock.so

$RepeatedMsgReduction   on

$ModLoad imklog.so
$klogConsoleLogLevel    1

$IncludeConfig /run/rsyslog/additional-log-sockets.conf
$IncludeConfig /etc/rsyslog.d/*.conf

if  (
        /* kernel up to warning except of firewall  */
        ($syslogfacility-text == 'kern')      and
        ($syslogseverity <= 4 /* warning */ ) and not
        ($msg contains 'IN=' and $msg contains 'OUT=')
    ) or (
        /* up to errors except of facility authpriv */
        ($syslogseverity <= 3 /* errors  */ ) and not
        ($syslogfacility-text == 'authpriv')
    )
then {
    /dev/tty10
    |/dev/xconsole
}

*.emerg                       :omusrmsg:*

if  ($syslogfacility-text == 'kern') and
    ($msg contains 'IN=' and $msg contains 'OUT=')
then {
    -/var/log/firewall
    stop
}

if  ($programname == 'acpid' or $syslogtag == '[acpid]:') and
     ($syslogseverity <= 5 /* notice */)
then {
    -/var/log/acpid
    stop
}
if      ($programname == 'NetworkManager') or
    ($programname startswith 'nm-')
then {
    -/var/log/NetworkManager
    stop
}
mail.*                      -/var/log/mail
mail.info                   -/var/log/mail.info
mail.warning                -/var/log/mail.warn
mail.err                     /var/log/mail.err
news.crit                   -/var/log/news/news.crit
news.err                            -/var/log/news/news.err
news.notice                 -/var/log/news/news.notice
*.=warning;*.=err           -/var/log/warn
*.crit                       /var/log/warn
*.*;mail.none;news.none     -/var/log/messages
local0.*;local1.*           -/var/log/localmessages
local2.*;local3.*           -/var/log/localmessages
local4.*;local5.*           -/var/log/localmessages
local6.*;local7.*           -/var/log/localmessages
As you can see from the sample file in the preceding listing, there is more than just the definition of facilities, priorities, and destinations. At the beginning of the file, some modules are defined. The immark module writes a marker message every hour, which helps verify that rsyslog is still operational. The imuxsock module allows syslog to receive messages from journald, and the RepeatedMsgReduction module ensures that repeated messages are not all written to the syslog files.
After the part where the modules are defined, two inclusions are defined. In particular the IncludeConfig/etc/rsyslog.d/*.conf line is important. This tells syslog to read additional configuration files as well. These configuration files may have been dropped in the /etc/rsyslog.d directory by software installation from RPM packages.
Next, there are a few lines that use scripting. In these scripting lines, especially the $msg contains lines are interesting. They allow syslog to read the contents of a message, which allows rsyslog to decide exactly what to do with the message.
The last part of the sample configuration file defines where messages should be written to. In most cases, the destination is a file name. The file name can be preceded by a -. This tells syslog that it’s not necessary to write the message immediately, but that message can be buffered for better performance. Some other log destinations are defined as well. The destination :omusrmsg:* , for example, uses the output module user message, which sends the message to all users who are currently logged in.
Reading Log Files
The result of the work of rsyslog is in the log files. These log files are in the /var/log directory. According to the definitions in /var/log, different files are used, but the main log file is /var/log/messages. Listing 5-5 shows partial contents of this file.
Listing 5-5. Partial Contents of the /var/log/messages Files
2014-09-21T03:30:01.253425-04:00 linux-3kk5 cron[48465]: pam_unix(crond:session): session opened for user root by (uid=0)
2014-09-21T03:30:01.255588-04:00 linux-3kk5 kernel: [160530.013392] type=1006 audit(1411284601.249:220): pid=48465 uid=0 old auid=4294967295 new auid=0 old ses=4294967295 new ses=182 res=1
2014-09-21T03:30:01.293811-04:00 linux-3kk5 CRON[48465]: pam_unix(crond:session): session closed for user root
2014-09-21T03:38:57.020771-04:00 linux-3kk5 wickedd-dhcp4[925]: eth0: Committed DHCPv4 lease with address 192.168.4.210 (lease time 1800 sec, renew in 900 sec, rebind in 1575 sec)
2014-09-21T03:38:57.021297-04:00 linux-3kk5 wickedd[929]: eth0: address 192.168.4.210 covered by a dhcp lease
2014-09-21T03:38:57.052381-04:00 linux-3kk5 wickedd[929]: eth0: Notified neighbours about IP address 192.168.4.210
2014-09-21T03:38:57.052774-04:00 linux-3kk5 wickedd[929]: route ipv4 0.0.0.0/0 via 192.168.4.2 dev eth0 type unicast table main scope universe protocol dhcp covered by a ipv4:dhcp lease
2014-09-21T03:38:57.230038-04:00 linux-3kk5 wickedd[929]: Skipping hostname update, none available
2014-09-21T03:45:01.311979-04:00 linux-3kk5 kernel: [161429.729495] type=1006 audit(1411285501.307:221): pid=48669 uid=0 old auid=4294967295 new auid=0 old ses=4294967295 new ses=183 res=1
2014-09-21T03:45:01.311470-04:00 linux-3kk5 cron[48669]: pam_unix(crond:session): session opened for user root by (uid=0)
2014-09-21T03:45:01.338933-04:00 linux-3kk5 CRON[48669]: pam_unix(crond:session): session closed for user root
2014-09-21T03:53:57.152972-04:00 linux-3kk5 wickedd-dhcp4[925]: eth0: Committed DHCPv4 lease with address 192.168.4.210 (lease time 1800 sec, renew in 900 sec, rebind in 1575 sec)
2014-09-21T03:53:57.153516-04:00 linux-3kk5 wickedd[929]: eth0: address 192.168.4.210 covered by a dhcp lease
2014-09-21T03:53:57.188390-04:00 linux-3kk5 wickedd[929]: eth0: Notified neighbours about IP address 192.168.4.210
2014-09-21T03:53:57.188638-04:00 linux-3kk5 wickedd[929]: route ipv4 0.0.0.0/0 via 192.168.4.2 dev eth0 type unicast table main scope universe protocol dhcp covered by a ipv4:dhcp lease
2014-09-21T03:53:57.359250-04:00 linux-3kk5 wickedd[929]: Skipping hostname update, none available
2014-09-21T03:54:05.119585-04:00 linux-3kk5 dbus[790]: [system] Activating via systemd: service name='org.freedesktop.PackageKit' unit='packagekit.service'
2014-09-21T03:54:05.124790-04:00 linux-3kk5 PackageKit: daemon start
2014-09-21T03:54:05.180829-04:00 linux-3kk5 dbus[790]: [system] Successfully activated service 'org.freedesktop.PackageKit'
2014-09-21T03:54:25.350410-04:00 linux-3kk5 PackageKit: daemon quit
2014-09-21T04:00:01.355931-04:00 linux-3kk5 kernel: [162329.431431] type=1006 audit(1411286401.349:222): pid=48878 uid=0 old auid=4294967295 new auid=0 old ses=4294967295 new ses=184 res=1
2014-09-21T04:00:01.355448-04:00 linux-3kk5 cron[48878]: pam_unix(crond:session): session opened for user root by (uid=0)
2014-09-21T04:00:01.397676-04:00 linux-3kk5 CRON[48878]: pam_unix(crond:session): session closed for user root
Each message is structured in a similar way. It starts with the date and time the message has been logged. Next, the name of the host that has logged the message is printed (linux-3kk5, in this example). Then follows the name of the process and its PID, followed by the specific message that is logged.
You will note that services tend to have their own method of writing information to the syslog. You can see that some commands perform logging in a way that is rather difficult to read, while other log messages are easy to understand.
Configuring Remote Logging
In a large network environment, it makes sense to set up remote logging. This allows you to create one log server that is configured with a large amount of storage and will keep messages for a longer period. Other servers can be used as clients toward that server and maintain small logs for themselves.
To set up remote logging, you’ll have to specify a remote log destination on the servers on which you want to do remote logging. The lines that do this follow:
*.*      @@remotehost.example.com
*.*      @remotehost.example.com
The first line tells rsyslog to send messages to the remote host specified, using TCP; the second line tells rsyslog to do the same, but using UDP. Sending messages via TCP is more secure. TCP is a connection-oriented protocol, so delivery of the log messages is guaranteed, and you can be sure that no messages will get lost. If you want to forward messages to a remote host that does not support TCP log reception, UDP can be used instead.
On the remote host, the file /etc/rsyslog.d/remote.conf must be used to enable log reception. The default remote.conf file on SLES contains many examples that show how to set up advanced remote log servers, on which it is even possible to use TLS for securing the message stream. The most important parameters that should be considered are the following:
@ModLoad imtcp.so
$TCPServerRun 514
@ModLoad imudp.so
$UDPServerRun 514
These lines enable the TCP as well as the UDP log reception modules and tell your server to listen for incoming messages on port 514.
Working with journal
On SLES 12, apart from rsyslog, journald is used for logging as well. The journald service keeps extensive information about services and other unit files that are managed through systemd (see Chapter 8 for further details). The information in journald must be considered as an addition to the information that is logged through rsyslog. By default, rsyslog is configured for receiving journald log messages. The line $ModLoad imuxsock.so takes care of this. There is not much need to configure the other way around, too, and have rsyslog write messages to journald. rsyslog should really be considered the central system for logging messages.
The journal is created at the moment that the journald service is started. That means that it won’t survive a reboot, but the messages are forwarded to rsyslog anyway, so that shouldn’t be a big deal. If you want to make the journal persistent, you can use the following procedure:
- Create a journal directory using mkdir -p -m 2775 /var/log/journal.
- Set the appropriate ownership: chown :systemd-journal /var/log/journal.
- Restart the journal service using killall -USR1 systemd-journald.
The most important benefit of using a journal is that the journalctl command allows administrators to perform smart filtering on messages. To start with, an administrator can type the journalctl command, which will just show all messages, starting with the oldest. So, to see only the last five messages, the command journalctl -n 5 can be used. To see live messages scrolling by at the moment they are written, type journalctl -f. Also very useful is the option to filter according to the time the message was written, as, for example, journalctl --since-today, which shows all messages that were written since the start of the day.
To get even more specific information from the system, you can specify time ranges as well, as, for example, journalctl --since "2014-09-19 23:00:00" --until "2014-09-20 8:00:00". You can also filter for specific process information only, as in the case of journalctl _SYSTEMD_UNIT=sshd.service, or obtain detailed information, if you want, by adding -o verbose. And it is possible to make all this very specific, if, for example, you’re looking for a detailed report on everything that has been logged by the sshd process in a specific date/time range. To do this, you can use a command such as journalctl --since "2014-09-19 23:00:00" --until "2014-09-20 8:00:00" _SYSTEMD_UNIT=sshd.service -o verbose.
When using journald logging, you should always remember that the journal is cleared at reboot. So, if you try to show messages that were logged too long ago, it may occur that they no longer exist, because you have rebooted in the meantime.
Configuring logrotate
On a very busy server, you may find that entries are added to your log files really fast. This poses a risk: your server may be quickly filled with log messages, which leaves no more place for normal files that have to be created. There are some solutions to this possible problem.
- To begin with, the directory /var/log should be on a dedicated partition or logical volume, so that in case too much information is written to the log files, this will never completely fill your server’s file system.
- Always include the RepeatedMsgReduction module in rsyslog.conf. It will ensure that the volume of messages that are repeatedly written is reduced.
- Another solution that you can use to prevent your server from being filled up completely by log files that grow too big is logrotate. The logrotate command runs as a cron job by default once a day from /etc/cron.daily, and it helps you to define a policy whereby log files that grow beyond a certain age or size are rotated.
Rotating a log file basically means that the old log file is closed and a new log file is opened. In most cases, logrotate keeps a number of the old logged files, often stored as a compressed file on disk. In the logrotate configuration, you can define how exactly you want to handle the rotation of log files.
The configuration of logrotate is spread between two different locations. The main logrotate file is /etc/logrotate.conf. In this file, some generic parameters are stored, as well as specific parameters that define how specific files should be handled.
The logrotate configuration for specific files is stored in the directory /etc/logrotate.d. These scripts are typically put there when you install the service, but you can modify them as you like. The logrotate file for the apache2 services provides a good example that you can use, if you want to create your own logrotate file. You can see part of its contents in Listing 5-6.
Listing 5-6. Sample logrotate Configuration File
/var/log/apache2/error_log {
    compress
    dateext
    maxage 365
    rotate 99
    size=+1024k
    notifempty
    missingok
    create 644 root root
    postrotate
     /usr/bin/systemctl reload apache2.service
    endscript
}

/var/log/apache2/suexec.log {
    compress
    dateext
    maxage 365
    rotate 99
    size=+1024k
    notifempty
    missingok
    create 644 root root
    postrotate
     /usr/bin/systemctl reload apache2.service
    endscript
}
You can see that the contents of the configuration is pretty straightforward. It tells which files should be logged and how often they should be logged. This configuration shows that the maximum age of the file is set to 365, after which a rotation will follow. logrotate will keep a maximum of 99 rotated log files, which allows administrators to go a long way back in time.
EXERCISE 5-7. CONFIGURING LOGGING
In this exercise, you’ll learn how to configure logging on your server. You’ll first set up rsyslogd to send all messages that relate to authentication to the /var/log/auth file. Next, you’ll set up logrotate to rotate this file on a daily basis and keep just one old version of the file.
- Open a terminal and make sure that you have root permissions, by opening a root shell using su -.
- Open the /etc/rsyslog.conf file in an editor and scroll down to the RULES section. Add the following line: authpriv.* /var/log/auth to the end of the file.
- Close the log file and make sure to save the changes. Now, use the command systemctl restart rsyslog to ensure that rsyslog uses the new configuration.
- Use the Ctrl+Alt+F4 key sequence to log in as a user. It doesn’t really matter which user account you’re using for this.
- Switch back to the graphical user interface using Ctrl+Alt+F1 (or Ctrl+Alt+F7, depending on your configuration). From here, use tail -f /var/log/auth. This should show the contents of the freshly created file that contains authentication messages. Use Ctrl+C to close tail -f.
- Create a file with the name /etc/logrotate.d/auth and make sure it has the following contents:
/var/log/auth {
       daily
       rotate 1
compress } - Normally, you would have to wait a day until logrotate is started from /etc/cron.daily. As an alternative, you can run it from the command line, using the following command: /usr/sbin/logrotate /etc/logrotate.conf.
- After one day, check the contents of the /var/log directory. You should see the rotated /var/log/auth file.
Summary
In this chapter, you’ve learned how to perform important daily system administration tasks. You’ve read how to work with printers and manage software. Next, you have learned how to manage processes and jobs and how to use cron to run processes at specific times. Following that, you have read how to configure logging on your server, to ensure that you can always find what has gone wrong and why.