Chapter 11. Sound
Raspberry Pi can record and analyze sounds. In one project, you’ll use a fast Fourier transform (FFT) to split sound into frequencies. This calculation can extract frequencies from any wave. With Arduino, you’ll use a microphone to measure volume.
Experiment: Hearing Voices/Volume Level
A microphone can detect sound level. This first experiment simply reads and prints values from a microphone.
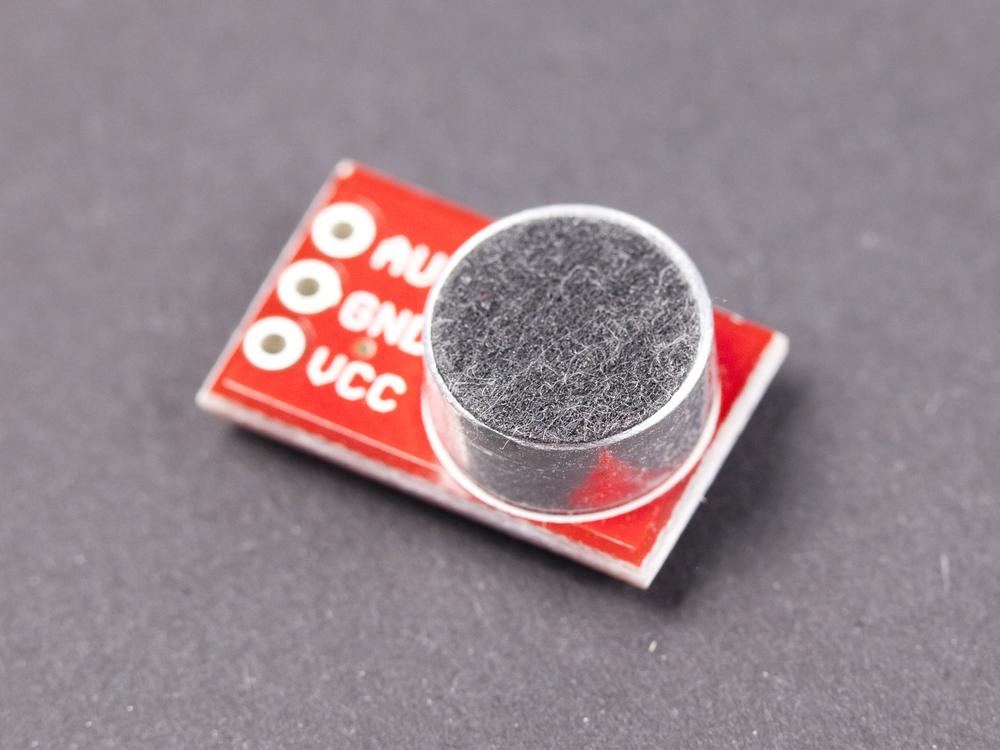
For many projects, you probably want to manipulate the numbers read from the microphone. You could set a threshold, apply a moving average, or detect minimum and maximum values. Later examples in this chapter let you try setting a threshold for sound. The component we used is the Breakout Board for Electret Microphone (BOB-09964) from Sparkfun. See Figure 11-1.
Microphone Breakout Code and Connection for Arduino
Figure 11-2 shows the Arduino circuit for the microphone. Wire it up as shown, and then run the code shown in Example 11-1.

// microphone.ino - print audio volume level to serial. Print "Sound" on loud sound.// (c) BotBook.com - Karvinen, Karvinen, ValtokariconstintaudioPin=A0;constintsensitivity=850;voidsetup(){Serial.begin(115200);}voidloop(){intsoundWave=analogRead(audioPin);//Serial.println(soundWave);if(soundWave>sensitivity){//Serial.println("Sound!");delay(500);}delay(10);}

You can read the microphone breakout like any analog resistance sensor.
analogRead()returns raw values between 0 and 1023, where a bigger number means a louder sound. The connection and the program are similar to a potentiometer connection.
Take action if it’s loud enough.
Microphone Breakout Code and Connection for Raspberry Pi
Figure 11-3 shows the wiring diagram for the Raspberry Pi. Hook everything up, and then run the code shown in Example 11-2.
# microphone.py - read sound from analog and print it# (c) BotBook.com - Karvinen, Karvinen, Valtokariimporttimeimportbotbook_mcp3002asmcp#defreadSound(samples):buff=[]#foriinrange(samples):#buff.append(mcp.readAnalog())#returnbuffdefmain():whileTrue:sound=readSound(1024)#(sound)time.sleep(1)# sif__name__=="__main__":main()
-
The library (botbook_mcp3002.py) must be in the same directory as this program. You must also install the spidev library, which is imported by botbook_mcp3002. See the comments in the beginning of botbook_mcp3002/botbook_mcp3002.py or Installing SpiDev.
-
Declare a new empty list.

Repeat the block below, so that
igets assigned each of the values. In this program, this becomes:for i in [0, 1, 2 ... 1023]:
Read the value from the microphone. Append a new item to the list (
buff).
Read 1024 samples, and get a list of values returned.

Environment Experiment: Can You Hear a Pin Drop?
Can you hear a pin drop? Let’s solve this question once and for all with a sound sensor. Connect the sensor to Arduino as you did in Microphone Breakout Code and Connection for Arduino and upload the code. Place the sensor on a solid plane such as a wooden table or a floor so that the microphone part points in the direction where you are going to drop the pin. Do all you can to minimize any background noise. Change the sensitivity value in the code so that the “sound” message is not triggered when you don’t make any sound. Carefully find a value that is just on the edge of reacting to sound without responding to silence.

Open the Serial Monitor in the Arduino IDE and drop a pin on the plane. Did you get the “sound” message in the serial monitor? If yes, then you really can hear a pin drop. If you didn’t get any reaction from the sensor, make sure that the room is as quiet as possible, drop the pin closer to the sensor, and make sure that you have adjusted the sensitivity properly.
Sensitivity to quiet sounds depends on the background noise level. Try putting some loud music on and readjust the sensitivity before dropping the pin. Can the sensor still hear it?
Test Project: Visualize Sound over HDMI
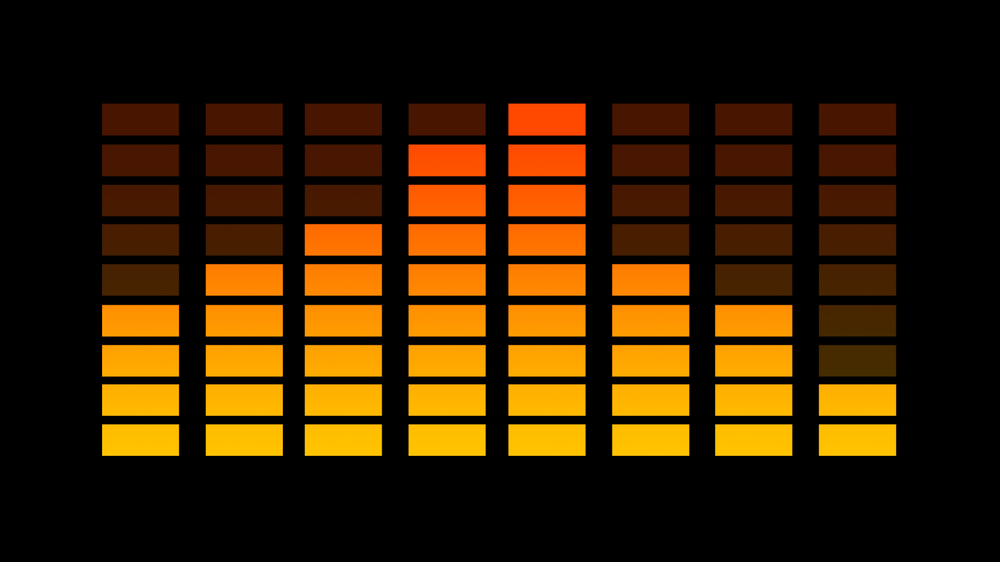
Have you always wanted a 50” graphical equalizer? In this project, you’ll analyze sound with Raspberry Pi and show the result on your television. Sound frequencies are shown as a colorful, animated graph (Figure 11-5).

What You’ll Learn
In the Visualize sound on HDMI project, you’ll learn how to:
- Analyze sound numerically.
- Do very fast calculations in Python, using SciPy.
- Extract frequencies with fast Fourier transform (FFT).
You’ll also refresh your skills on pyGame and drawing Full HD graphics to HDMI output, like your television or a video projector (see Test Project: Pong).
Enabling the Serial Port in Raspberry Pi
To use the serial port in Raspberry Pi, you must release it first. Otherwise, it’s used by a login shell that you can connect to over a serial cable:
$ sudoedit /etc/inittab
Comment out the last line that grabs the serial port. You can comment out a line by putting a hash in front of it, which causes the line to be ignored.
# T0:23:respawn:/sbin/getty -L ttyAMA0 115200 vt100
Reboot the Raspberry Pi.
Visualizer Code and Connection for Raspberry Pi
Install prerequisites. On your Raspberry Pi, open the terminal and run these commands:
$ sudo apt-get update
$ sudo apt-get -y install python-pygame python-numpy
Figure 11-6 shows the circuit diagram for Raspberry Pi. Hook it up, and then run the code shown in Example 11-3.

# equalizer.py - show equalizer based on microphone input# (c) BotBook.com - Karvinen, Karvinen, Valtokariimportpygame# sudo apt-get -y install python-pygameimportmathimportnumpy# sudo apt-get -y install python-numpyimportmicrophone#frompygame.localsimport*pygame.init()width=800height=640size=width,heightbackground=0,0,0screen=pygame.display.set_mode(size,pygame.FULLSCREEN)fullBar=pygame.image.load("equalizer-full-small4.jpg")#emptyBar=pygame.image.load("equalizer-empty-small4.jpg")clock=pygame.time.Clock()pygame.mouse.set_visible(False)mainloop=TruebarHeight=36barWidth=80barGraphHeight=327barPos=[55,130]sampleLength=16deffftCalculations(data):#data2=numpy.array(data)/4#fourier=numpy.fft.rfft(data2)#ffty=numpy.abs(fourier)#ffty=ffty/256.0#returnfftywhilemainloop:buff=microphone.readSound(sampleLength)#barData=fftCalculations(buff)#foreventinpygame.event.get():ifevent.type==pygame.QUIT:mainloop=Falseif(event.type==KEYUP)or(event.type==KEYDOWN):ifevent.key==K_ESCAPE:mainloop=Falsescreen.fill(background)# Draw data to pillarsforiinrange(8):#bars=barData[i+1]#bars=int(math.floor(bars*10))#ifbars>10:bars=10bars-=1screen.blit(emptyBar,(barPos[0]+i*(barWidth+10),barPos[1]),(0,0,barWidth,barHeight*(10-bars)))ifbars>=0:barStartPos=(barPos[0]+i*(barWidth+10),barPos[1]+barGraphHeight-barHeight*bars+6)barSourceBlit=(0,barGraphHeight-barHeight*bars+6,barWidth,barHeight*bars)screen.blit(fullBar,barStartPos,barSourceBlit)#pygame.display.update()
-
The microphone.py program from Microphone Breakout Code and Connection for Raspberry Pi must be in the same directory as this program (equalizer.py).
-
PyGame can load normal JPG images. You can draw them in any program, such as Inkscape, Gimp, Photoshop, or Illustrator.
-
When this function is called from the main program,
datawill contain 16 samples, each in the range of 0..1024.-
Divide the samples to put them into the range 0..256.
-
Perform an FFT on the recorded sound samples. This gives the frequency ranges of the samples. The
rfft()function returns an array that has16/2+1(9) cells, each representing a frequency.
Get rid of the imaginary part of the numbers, so that they can be plotted later. For example,
abs(1+1j)is approximately 1.4.
Convert the Fourier-transformed values to percentages (in the range 0.0 to 1.0).

Read 16 samples from the microphone, using the botbook.com microphone library.

Save the FFT of the sound sample to
barData.
For each of the eight vertical bars (0 to 7)…

…get the frequency percentage. Because of the
i+1here, the first cell number (0) is ignored. The first, ignored cell contains the DC component, the average value between AC wave’s positive and negative peaks.
Count the number of bars needed (e.g., 1.0 (100 %) gets the maximum, nine bars).

Draw the full bars on screen.
Fast Fourier Transformation
An FFT extracts individual frequencies from a wave. It’s used for creating frequency diagrams in graphic equalizers, spectrum analyzers, and oscilloscopes.
Imagine playing two notes, one lower (5 Hz) and one higher (40 Hz). In real life, audible sounds are from 20 Hz to 20,000 Hz, but we picked smaller numbers for this example.
In Figure 11-7, the horizontal time axis grows to the right. Vertical axis is amplitude, which is compression and decompression of air.


When they play at the same time, they form one wave. This combined wave is like a little ripple on top of a big wave. The lower note, 5 Hz, forms the big wave. The small ripple is the higher 40 Hz frequency. The combined wave is just a sum of the two waves, combined = low + high.

When you record sound, you get this kind of combined wave. So this is similar to the typical starting material with sound samples, such as mp3, wav, or ogg. Given a combined wave like this, how do you get the original two sine waves back? Fourier to the rescue!
Perform a fast Fourier transform of the combined wave. As you’ve seen in the code of this project, you can simply call an FFT function, with the wave data as the parameter. See Figure 11-10.

The FFT gave the frequencies of the original sine waves, 5 Hz and 40 Hz. You have now broken a complex wave into frequencies. Figure 11-11 shows a sample equalizer display.
What Next?
You have now played with sound. With Arduino, you detected volume level and noticed a volume over a certain threshold. With Raspberry Pi, you recorded sound and analyzed it in real time. As you built the project, you improved your pyGame skills and used fast Fourier transform to break a wave into components.
Next, it’s time to look at air on a bigger scale. You’ll measure weather and climate, from local room temperature and humidity to predicting weather in your part of town.