Chapter 12. Weather and Climate
The immediately obvious components of weather include temperature and humidity. To forecast weather, you can measure the atmospheric pressure.
Experiment: Is It Hot in Here?
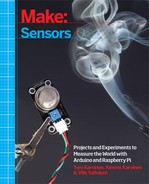
An LM35 sensor reports temperature with varying voltage. Because it’s an analog resistance sensor, it’s easy to use with Arduino. Using it with Raspberry Pi requires an analog-to-digital converter chip.
The LM35 has three leads (Figure 12-1), similar to a potentiometer. The output lead voltage U is converted to temperature T with a simple formula:
T = 100*U
Some example values are in Table 12-1. From the table, you can see that the LM35 can measure temperatures between 2 C and 150 C. The output voltage varies from about 0 V to 1.5 V.
Do you need to measure subzero temperatures? Use LM36 or check for alternative connection options on the LM35 data sheet.
| Temperature C | Voltage V | Comment |
2 C | 0.02 V | Minimum measured temperature |
20 C | 0.2 V | Room temperature |
100 C | 1.0 V | Boiling water |
150 C | 1.5 V | Maximum measured temperature |
LM35 Code and Connection for Arduino
Figure 12-2 shows the wiring diagram for Arduino. Hook it up as shown, and then run the code from Example 12-1.
// temperature_lm35.ino - measure temperature (Celsius) with LM35 and print it// (c) BotBook.com - Karvinen, Karvinen, ValtokariintlmPin=A0;voidsetup(){Serial.begin(115200);pinMode(lmPin,INPUT);}floattempC(){floatraw=analogRead(lmPin);//floatpercent=raw/1023.0;//floatvolts=percent*5.0;//return100.0*volts;//}voidloop(){Serial.println(tempC());delay(200);// ms}

LM35 is just an analog resistance sensor, so you can measure its voltage with
analogRead(). It returns a raw value between 0 and 1023.
Convert the raw value (0 to 1023) to a percentage of the HIGH voltage (5 V). The
percentvariable will be a float between 0.0 and 1.0.
Convert percentage to volts (between 0 and 5 V).

Return the temperature in Celsius. The formula we used comes from the LM35’s data sheet.

LM35 Code and Connection for Raspberry Pi
Figure 12-3 shows the connection diagram for the Raspberry Pi. Hook it up as shown, and then run the code in Example 12-2.

Because the maximum output voltage of LM35 is 1.5 V at 150 C, there is no danger of going over Raspberry Pi’s maximum safe input voltage level of 3.3 V.
# temperature_lm35.py - print temperature# (c) BotBook.com - Karvinen, Karvinen, Valtokariimporttimeimportbotbook_mcp3002asmcp##LM35 data pin voltage keeps under 2V so no#level conversion neededdefmain():whileTrue:rawData=mcp.readAnalog()#percent=rawData/1023.0#volts=percent*3.3#temperature=100.0*volts#("Current temperature is%.1fC"%temperature)time.sleep(0.5)if__name__=="__main__":main()
-
The botbook_mcp3002.py library file must be in the same directory as this program (temperature_lm35.py). You must also install the spidev library, which is imported by botbook_mcp3002. See the comments at the top of botbook_mcp3002/botbook_mcp3002.py or Installing SpiDev.
-
Read voltage using MCP3002 analog-to-digital converter and botbook_mcp3002 library. The raw value is an integer between 0 and 1023.
-
Convert the raw value to a percentage of 3.3 V.
-
Convert
percentto a voltage (between 0 and 3.3 V).
Convert to Celsius using the formula we obtained from the component’s data sheet. See examples in Table 12-1.
Environment Experiment: Changing Temperature
Air is a very good insulator. You’ll find that your patience will be tested if you take your LM35 temperature sensor (Figure 12-4) to the sauna, fridge, and balcony—it seems to change so slowly.

To get quick changes, press an ice cube directly against the LM35. Avoid wetting your wires, microcontrollers, or breadboard. Now the heat is conducted away from LM35, and the change of temperature is rapid.
Experiment: Is It Humid in Here?
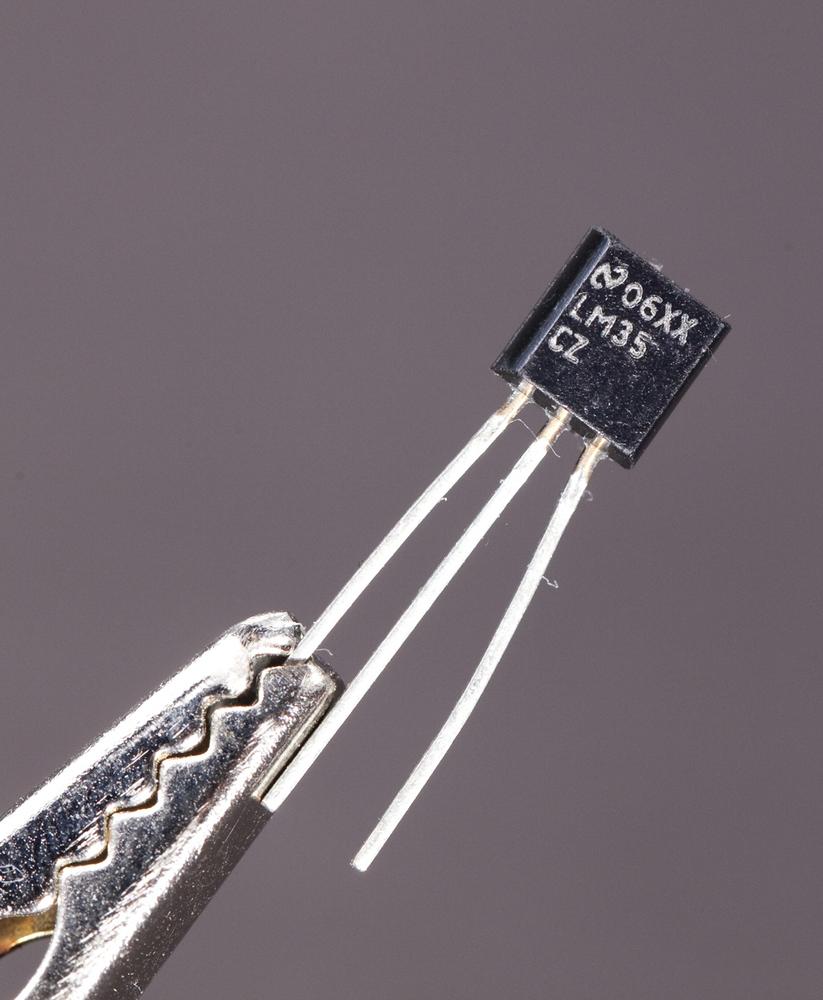
DHT11 measures humidity and temperature (Figure 12-5).

The protocol that the DHT11 uses is weird. It sends bits as very short pulses very rapidly. Arduino doesn’t have an operating system, so it’s more real-time than Raspberry Pi and can easily read these pulses. But even Arduino needs to be coded in a special way, as even the built-in pulseIn() function is not fast enough.
Raspberry Pi is less real-time and has a difficult time reading the pulses reliably. That’s why you’ll connect Arduino to Raspberry Pi and use Arduino to do the actual reading of the DHT11. The connection is made using serial over USB. If you want, you can easily apply this technique to any other sensor.
The data pin is normally HIGH. To start reading, the microcontroller sends a LOW pulse of 18 milliseconds.
The DHT11 sends 5-byte packets. As each byte is 8 bits, the packet is 5 B * 8 bit/B = 40 bits.
How Humid Is Your Breath?
How can we change the measured humidity? Just buy an ultrasonic humidifier that uses a piezoelectric transducer to create mist from water, or book a flight to Thailand. No, wait, there is an easier way. You have a built-in humidifier in your lungs. Bring the sensor close to your mouth and breathe (Figure 12-6). Keep checking to see how values change by watching the Arduino Serial Monitor.
DHT11 Code and Connection for Arduino
Figure 12-7 shows the connections for Arduino. Wire them up as shown, and then run the code shown in Example 12-3.

// dht11.ino - print humidity and temperature using DHT11 sensor// (c) BotBook.com - Karvinen, Karvinen, ValtokariconstintdataPin=8;inttemperature=-1;inthumidity=-1;voidsetup(){Serial.begin(115200);}intreadDHT11(){uint8_trecvBuffer[5];//uint8_tcnt=7;uint8_tidx=0;for(inti=0;i<5;i++)recvBuffer[i]=0;//// Start communications with LOW pulsepinMode(dataPin,OUTPUT);digitalWrite(dataPin,LOW);delay(18);digitalWrite(dataPin,HIGH);delayMicroseconds(40);//pinMode(dataPin,INPUT);pulseIn(dataPin,HIGH);//// Read data packetunsignedinttimeout=10000;// loop iterationsfor(inti=0;i<40;i++)//{timeout=10000;while(digitalRead(dataPin)==LOW){if(timeout==0)return-1;timeout--;}unsignedlongt=micros();//timeout=10000;while(digitalRead(dataPin)==HIGH){//if(timeout==0)return-1;timeout--;}if((micros()-t)>40)recvBuffer[idx]|=(1<<cnt);//if(cnt==0)// next byte?{cnt=7;// restart at MSBidx++;// next byte!}elsecnt--;}humidity=recvBuffer[0];// % //temperature=recvBuffer[2];// Cuint8_tsum=recvBuffer[0]+recvBuffer[2];if(recvBuffer[4]!=sum)return-2;//return0;}voidloop(){intret=readDHT11();if(ret!=0)Serial.println(ret);Serial.("Humidity:");Serial.(humidity);Serial.println("%");Serial.("Temperature:");Serial.(temperature);Serial.println("C");delay(2000);// ms}
-
The packet from DHT11 is 5 bytes (40 bits) in length.
-
Initialize the buffer with zeroes.
-
Wait a very short time for the DHT11 to start sending data.
-
Receive the DHT11’s response signal.
-
For each of the 40 bits, perform the operations inside the curly braces.

Uptime in microseconds (µs); this is stored to measure the duration of the pulse.

Measure the pulse with a loop.

If the pulse was longer than 40 µs, it was a 1. Otherwise, that bit is left as its initialized value, 0. To toggle the corresponding bit in the corresponding byte, a new number is created with bit shifting (e.g.,
1<<2 == 0b100). This bit is then combined with the previous byte value using a bitwise inplace OR. So if the value was already a 1, it stays set at 1. If it was a zero, but the new number (0b100) was 1, then this sets it to 1. See Bitwise Operations for more details.
Humidity is the first byte of the received packet.

The checksum (byte 4) is the sum of humidity and temperature.
DHT11 Code and Connection for Raspberry Pi
Would you like to combine Arduino and Raspberry Pi to get the best of both worlds? We hope so, because DHT11 doesn’t like the Raspberry Pi. This code shows you how you can read data from Arduino, in a way you can easily adapt to other projects.
Even if it’s possible to use DHT11 from Raspberry Pi with complicated code, the result is not satisfactory. Luckily, Arduino can be used for fast low-level tasks, letting Raspberry Pi concentrate on the big picture.
After you have tried the code, you should read Talking to Arduino from Raspberry Pi.
To use the serial port in Raspberry Pi, you must first release it from its default use as a login terminal. See Enabling the Serial Port in Raspberry Pi for instructions. Wire them up as shown in Figure 12-8, and then run the code shown in Example 12-4.

# dht11_serial.py - print humidity and temperature using DHT11 sensor# (c) BotBook.com - Karvinen, Karvinen, Valtokariimporttimeimportserial#defmain():port=serial.Serial("/dev/ttyACM0",baudrate=115200,timeout=None)#whileTrue:line=port.readline()#arr=line.split()#iflen(arr)<3:#continue#dataType=arr[2]data=float(arr[1])#ifdataType=='%':("Humidity:%.1f%%"%data)else:("Temperature:%.1fC"%data)time.sleep(0.01)if__name__=="__main__":main()
-
You might need to run these commands to install this library:
sudo apt-get update && sudo apt-get -y install python-serial.-
Open the USB serial for reading. The Arduino program must use the same speed, 115,200 bit/s to communicate.
-
Read one line, until reaching a newline. The
readline()function is a blocking function, so it will wait here until it reads something in.-
Split the text string into a list. This makes it easy to parse the human-readable input from the Arduino. For example,
"Humidity: 25 %".split()creates a convenient list:['Humidity:', '25', '%'].-
If the line length is incorrect…
-
…ignore this line and jump to the next iteration of the
whileloop.-
Typecast (convert) the string (“25”) to a number (25.0).
Talking to Arduino from Raspberry Pi
Arduino is real-time, robust, and simple. Also, Arduino has a built-in ADC (analog-to-digital converter). Raspberry Pi is high level, and runs a whole Linux operating system. Why not combine the benefits?
You can use Arduino to directly interact with sensors and outputs, and control Arduino from Raspberry Pi.
First, make the sensors work with Arduino, and print the readings to serial. Use your normal desktop computer and Arduino IDE for this. You can write to serial with Serial.println(). Use the Serial Monitor (Tools→Serial Monitor) to see what your program prints. Only proceed to the Raspberry Pi part once you are happy with how the Arduino part of your project works.
The connection between Arduino and Raspberry Pi is simple: just connect them with a USB cable.
For a more intimate combination of the Arduino platform and Raspberry Pi, check out the AlaMode for Raspberry Pi, which incorporates an Arduino-compatible microcontroller board into a Raspberry Pi expansion that snaps right on top of your Pi. There’s no need to connect them by USB, since they use the Raspberry Pi’s expansion header.
Arduino communicates with serial over USB. To read serial from Raspberry Pi, use Python and PySerial. For a complete example of using PySerial, see Figure 12-8 or Chapter 7 of Make: Arduino Bots and Gadgets.
You’ll have Arduino print normal text, then extract the numbers with Python’s string handling. In many prototyping applications, you don’t have to design a new low-level protocol.
For example, consider an Arduino program printing the following:
Humidity: 83 %
If you have read this into a Python string, use split() to separate the words into a list:
>>> s="Humidity: 83 %"
>>> s.split()
['Humidity:', '83', '%']
You can refer to items of the list with square brackets, []. The first item is number zero. This prints the second item:
>>> x = s.split()[1]
>>> x
'83'
Finally, convert the string “83” into integer 83 so you can process it as a number. You can perform sensible mathematical operations and comparisons with a number, but not with a string.
>>> int(x)
83
You can use any Arduino-compatible sensor from Raspberry Pi this way.
Atmospheric Pressure GY65
Atmospheric pressure can help you forecast weather. High pressure means sunny, clear weather. Low pressure means rainy, snowy, or cloudy weather.

Normal air pressure is about 1,000 hPa (hectopascals). The exact value depends on your altitude.
1,000 hPa = 100,000 Pa = 1,000 mbar = 1 bar
The pressure doesn’t vary much, even in extreme weather. The world records are a high of 1,084 hPa and a low of 870 hPa (inside a typhoon). Typical changes in normal weather are a few hectopascals.
Pressure changes in the lower atmosphere are tiny compared with other everyday pressure changes. A hand-pumped bike tire has pressure of 4,000 hPa. Outside a passenger airplane over 30,000 feet, the pressure is less than 300 hPa.
So what level of atmospheric pressure is considered high, then? Meteorologists say that high pressure is just relatively high, compared with the pressure of surrounding areas.
You can still predict weather with pressure over time. If pressure goes up, better weather is coming. The faster it changes, the sunnier it will be.
For a simpler forecast, you can compare current pressure to expected pressure for your altitude. You can find out your altitude with a GPS or Google Maps. According to SparkFun, the distributor of the GY65 module we used, a difference of +2.5 hPa means great, sunny weather. Conversely, low pressure of 2.5 hPa under the normal pressure means bad, rainy weather.
GY65 is a breakout board for the BMP085 sensor. You can find the data sheet by searching for “BMP085 digital pressure sensor data sheet.”
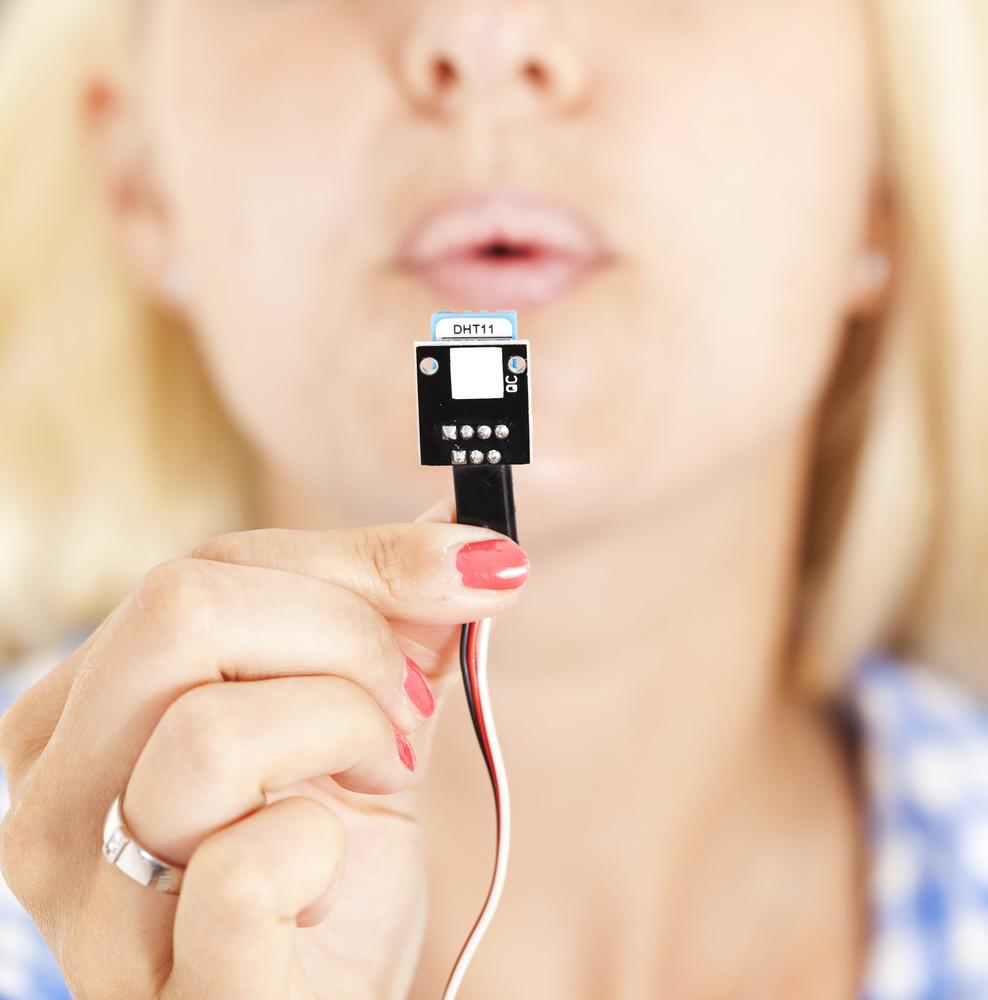
GY65 Code and Connection for Arduino
Figure 12-10 shows the connection diagram for Arduino. Hook it up as shown, and then run the code shown in Example 12-5.
Arduino code uses the gy_65 library from http://botbook.com. If you want an in-depth, technical view how the I2C/SMBus protocol works, have a look at GY65 Code and Connection for Raspberry Pi.
// gy_65.ino - print altitude, pressure and temperature with GY-65 BMP085// (c) BotBook.com - Karvinen, Karvinen, Valtokari#include <Wire.h>#include <gy_65.h>//voidsetup(){Serial.begin(115200);readCalibrationData();//}voidloop(){floattemp=readTemperature();floatpressure=readPressure();//floataltitude=calculateAltitude(pressure);//Serial.("Altitude:");Serial.(altitude,2);Serial.println("m");Serial.("Pressure:");Serial.(pressure,2);Serial.println("Pa");Serial.("Temperature:");Serial.(temp,2);Serial.println("C");delay(1000);}
-
The gy_65 library makes this sensor very easy to use. It hides the complicated I2C protocol that’s behind the sensor. The library folder gy_65 must be in the same directory as the main program, gy_65.ino.
-
Update global variables.
-
With the library, it’s trivial to retrieve the pressure in Pascals.
-
Air is thinner when you are higher, so pressure can also be used for altitude estimation.
Using Arduino Libraries
If you have a lot of code, it’s best to split it into multiple files. The Arduino code for GY65 is such code. Also, you’ll use the same code again in Test Project: E-paper Weather Forecast.
The library is in a folder, within the same directory as the main program (you will probably also encounter libraries that need to be installed into your Arduino sketch folder’s libraries subdirectory). Here is the folder structure:
gy_65.ino         # the main program
gy_65/            # folder that contains the library
gy_65/gy_65.cpp   # code for the library
gy_65/gy_65.h     # prototypes of each library function
The location of the main program, gy_65.ino, should seem normal to you. Every Arduino project has one main program.
The library is in its own folder. The code for the library is in gy_65.cpp. This code looks similar to other Arduino code you have seen.
The header file, gy_65.h, contains the prototypes of the functions in the cpp file. Prototypes are just copies of the first line of each function in gy_65.cpp. For example, the header file has the line:
float readTemperature();
GY65 Arduino Library Explained
You can use the GY65 without going through the implementation details of the library. But if you want a detailed understanding of how communication with the GY65 works, read on.
You can learn the communication protocol by studying the library itself, the Raspberry Pi program (Figure 12-11), or both.
This section also introduces you to creating your own C++ libraries for Arduino. You should also see Arduino’s documentation on Writing a Library for Arduino.
The header file gy_65.h (see Example 12-6) has prototypes for each function. It’s simply a list of functions in the cpp file, which is where you’ll find the actual implementation of those functions.
// gy_65.h - library for altitude, pressure and temperature with GY-65 BMP085// (c) BotBook.com - Karvinen, Karvinen, ValtokarivoidreadCalibrationData();floatreadTemperature();floatreadPressure();floatcalculateAltitude(floatpressure);
The implementation of the definitions from the h file are in a cpp file, gy_65.cpp (Example 12-7). If some parts of this code seem demanding, you might want to review the I2C code explanation in Figure 8-5, as well as Hexadecimal, Binary, and Other Numbering Systems and Bitwise Operations.
//gy_65.cpp-libraryforaltitude,pressureandtemperaturewithGY-65BMP085//(c)BotBook.com-Karvinen,Karvinen,Valtokari#include <Arduino.h>#include <Wire.h>#include "gy_65.h"constchari2c_address=0x77;intOSS=0;//OversamplingconstlongatmosphereSeaLevel=101325;//Pastructcalibration_data//{int16_tac1;int16_tac2;int16_tac3;int16_tac4;int16_tac5;int16_tac6;int16_tb1;int16_tb2;int16_tmb;int16_tmc;int16_tmd;};calibration_datacaldata;longb5;int16_tswap_int16_t(int16_tvalue)//{int16_tleft=value<<8;int16_tright=value>>8;right=right&0xFF;returnleft|right;}unsignedcharread_i2c_unsigned_char(unsignedcharaddress)//{unsignedchardata;Wire.beginTransmission(i2c_address);Wire.write(address);Wire.endTransmission();Wire.requestFrom(i2c_address,1);while(!Wire.available());returnWire.read();}voidread_i2c(unsignedcharpoint,uint8_t*buffer,intsize){Wire.beginTransmission(i2c_address);Wire.write(point);Wire.endTransmission();Wire.requestFrom(i2c_address,size);inti=0;while(Wire.available()&&i<size){buffer[i]=Wire.read();i++;}if(i!=size){Serial.println("Error reading from i2c");}}intread_i2c_int(unsignedcharaddress){int16_tdata;read_i2c(address,(uint8_t*)&data,sizeof(int16_t));data=swap_int16_t(data);returndata;}voidreadCalibrationData()//{Wire.begin();read_i2c(0xAA,(uint8_t*)&caldata,sizeof(calibration_data));//uint16_t*p=(uint16_t*)&caldata;//for(inti=0;i<11;i++){//p[i]=swap_int16_t(p[i]);}}floatreadTemperature(){////ReadrawtemperatureWire.beginTransmission(i2c_address);Wire.write(0xF4);//RegisterWire.write(0x2E);//ValueWire.endTransmission();delay(5);//unsignedintrawTemp=read_i2c_int(0xF6);//Calculatetruetemperaturelongx1,x2;floatt;x1=(((long)rawTemp-(long)caldata.ac6)*(long)caldata.ac5)/pow(2,15);longmc=caldata.mc;intmd=caldata.md;x2=(mc*pow(2,11))/(x1+md);b5=x1+x2;t=(b5+8)/pow(2,4);t=t/10;returnt;//Celsius}longgetRealPressure(unsignedlongup){//longx1,x2,x3,b3,b6,p;unsignedlongb4,b7;intb1=caldata.b1;intb2=caldata.b2;longac1=caldata.ac1;intac2=caldata.ac2;intac3=caldata.ac3;unsignedintac4=caldata.ac4;b6=b5-4000;x1=(b2*(b6*b6)/pow(2,12))/pow(2,11);x2=(ac2*b6)/pow(2,11);x3=x1+x2;b3=(((ac1*4+x3)<<OSS)+2)/4;x1=(ac3*b6)/pow(2,13);x2=(b1*((b6*b6)/pow(2,12)))/pow(2,16);x3=((x1+x2)+2)/4;b4=(ac4*(unsignedlong)(x3+32768))/pow(2,15);b7=((unsignedlong)up-b3)*(50000>>OSS);if(b7<0x80000000)p=(b7*2)/b4;elsep=(b7/b4)*2;x1=(p/pow(2,8))*(p/pow(2,8));x1=(x1*3038)/pow(2,16);x2=(-7357*p)/pow(2,16);p+=(x1+x2+3791)/pow(2,4);longtemp=p;returntemp;}floatreadPressure(){////ReaduncompensatedpressureWire.beginTransmission(i2c_address);Wire.write(0xF4);//RegisterWire.write(0x34+(OSS<<6));//Valuewithoversamplingsetting.Wire.endTransmission();delay(2+(3<<OSS));unsignedcharmsb,lsb,xlsb;unsignedlongrawPressure=0;msb=read_i2c_unsigned_char(0xF6);lsb=read_i2c_unsigned_char(0xF7);xlsb=read_i2c_unsigned_char(0xF8);rawPressure=(((unsignedlong)msb<<16)|((unsignedlong)lsb<<8)|(unsignedlong)xlsb)>>(8-OSS);returngetRealPressure(rawPressure);}floatcalculateAltitude(floatpressure){//floatpressurePart=pressure/atmosphereSeaLevel;floatpower=1/5.255;floatresult=1-pow(pressurePart,power);floataltitude=44330*result;returnaltitude;//m}
-
Global structs and variables. The calibration data will be read from the sensor’s non-volatile (EEPROM) memory.
-
Take a two-byte integer, swap the left byte and the right byte. This is needed because the sensor represents numbers differently than the Arduino does.
-
These are convenience functions:
read_i2c_unsigned_char(),read_i2c(), andread_i2c_int(). They are wrappers for functionality in Wire.h to make it easier to use in this program.-
Read the calibration data from the non-volatile EEPROM memory of the sensor. The format is described on the BMP085 data sheet.
-
The trick is to use your own
calibration_datastruct to decode the EEPROM data. The bytes from the device are overlaid on the struct residing in Arduino’s memory. The struct is created so that each variable has a length that corresponds to each piece of data read from the EEPROM. After this line,caldatais filled with bytes from the sensor, and each piece of data is accessible through the struct.-
As the sensor has different endianness than Arduino, you must swap the bytes of each two-byte integer. First, get a two-byte pointer to the start of
caldata…-
…and then walk through
caldataand swap the bytes. Notice how the two-byte (16 bit) pointer correctly points to a new two-byte integer on each iteration, instead of naively pointing to single bytes.-
readTemperature()first reads the raw temperature using I2C. Then it calculates the actual temperature, using a formula from the data sheet.-
The datasheet specifies that a delay of at least 4.5 ms is needed.
-
getRealPressure()takes the raw temperature read byreadPressure(), then returns the result in Pascals (Pa). It uses the calibration data read byreadCalibrationData(), and applies the formula from page 13 of the BMP085 data sheet.
Read the raw pressure using I2C. The register values and data format are taken from the data sheet.

Estimate altitude from pressure. The formula is from the international barometric formula, available on the BMP085 data sheet, page 14.
GY65 Code and Connection for Raspberry Pi
This Raspberry Pi code is easy to use, and you should try running it before reading it in detail. If you go through it line by line, you’ll see that the code can be quite demanding to understand. With Raspberry Pi, the I2C communication with the GY65 sensor is not in a separate file, so the code is longer than the Arduino example. The code uses some techniques you have already seen, such as the ones described in Hexadecimal, Binary, and Other Numbering Systems and Bitwise Operations.

# gy_65.py - print altitude,pressure and temperature to serial# (c) BotBook.com - Karvinen, Karvinen, Valtokariimportsmbus# sudo apt-get -y install python-smbus #importtimeimportstructbus=Noneaddress=0x77caldata=NoneatmosphereSeaLevel=101325.0OSS=0b5=0defreadCalibrationData():#globalbus,caldatabus=smbus.SMBus(1)rawData=""foriinrange(22):rawData+=chr(bus.read_byte_data(address,0xAA+i))#caldata=struct.unpack('>hhhhhhhhhhh',rawData)#defreadTemperature():globalb5bus.write_byte_data(address,0xF4,0x2E)#time.sleep(0.005)#rawTemp=bus.read_byte_data(address,0xF6)<<8#rawTemp=rawTemp|bus.read_byte_data(address,0xF7)x1=((rawTemp-caldata[5])*caldata[4])/2**15x2=(caldata[9]*2**11)/(x1+caldata[10])b5=x1+x2temp=(b5+8)/2**4temp=temp/10.0returntempdefreadPressure():#bus.write_byte_data(address,0xF4,0x34+(OSS<<6))time.sleep(0.005)rawPressure=bus.read_byte_data(address,0xF6)<<16rawPressure=rawPressure|bus.read_byte_data(address,0xF7)<<8rawPressure=rawPressure|bus.read_byte_data(address,0xF8)rawPressure=rawPressure>>(8-OSS)#Calculate real pressureb6=b5-4000x1=(caldata[7]*((b6*b6)/2**12))/2**11x2=caldata[1]*b6/2**11x3=x1+x2b3=(((caldata[0]*4+x3)<<OSS)+2)/4x1=caldata[2]*b6/2**13x2=(caldata[6]*((b6*b6)/2**12))/2**16x3=((x1+x2)+2)/2*2b4=(caldata[3]*(x3+32768))/2**15b4=b4+2**16# convert from signed to unsignedb7=(rawPressure-b3)*(50000>>OSS)ifb7<0x80000000:p=(b7*2)/b4else:p=(b7/b4)*2x1=(p/2**8)*(p/2**8)x1=(x1*3038)/2**16x2=(-7357*p)/2**16p=p+(x1+x2+3791)/2**4returnpdefcalculateAltitude(pressure):#pressurePart=pressure/atmosphereSeaLevel;power=1/5.255;result=1-pressurePart**power;altitude=44330*result;returnaltitudedefmain():readCalibrationData()whileTrue:temperature=readTemperature()pressure=readPressure()altitude=calculateAltitude(pressure)("Altitude%.2fm"%altitude)("Pressure%.2fPa"%pressure)#("Temperature%.2fC"%temperature)time.sleep(10)if__name__=="__main__":main()
-
The SMBus standard is a subset of I2C. The
smbuslibrary makes it easy to use. The python-smbus package must be installed on Raspberry Pi for this to work (see SMBus and I2C Without Root).-
The sensor ships with 176 bits of calibration data stored into its EEPROM.
-
Read data from address 0xAA, 0xAB, on up through 0xBF. Append these character values to the string. The string ends up having 22 bytes (176 bits). You didn’t have to think about how many bits the struct had in Arduino when you were doing this, because the struct’s length is defined by the length of the variables that are inside it.
-
Unpack 11 big endian (
>) short two-byte integers (h). This consumes all the bytes from the string.-
Write the command for “read temperature” (0x2E) to the sensor’s control register (0xF4).
-
Wait for the measurement to finish.
-
Read the answer, and start manipulating the raw number into a temperature in Celsius. The formulas are from the data sheet.
-
The
readPressure()function works just likereadTemperature().-
The higher you go, the lower the pressure. Based on this, the international barometric formula can give you an estimate of your altitude.
-
Experiment: Does Your Plant Need Watering? (Build a Soil Humidity Sensor)
A soil humidity sensor is a simple analog resistance sensor. Stick it in the soil to see if your plant needs watering.
Normal tap water and groundwater contain diluted salts and other material. This makes water conductive. The soil humidity sensor (Figure 12-12) simply measures that conductivity.
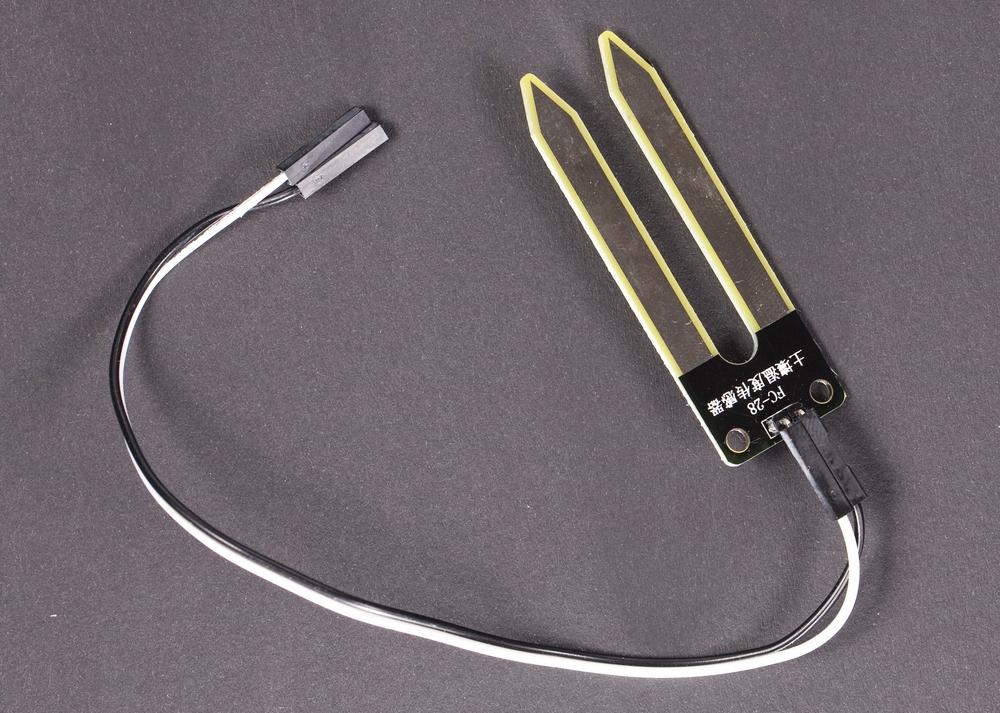
Some soil humidity sensors have a built-in circuit. The sensor used here doesn’t have built-in electronics, so you could make your own from two pieces of metal (for the sensor probes) and use Arduino or Raspberry Pi to measure the resistance. The circuit uses a 1 megohm resistor (brown-black-green).
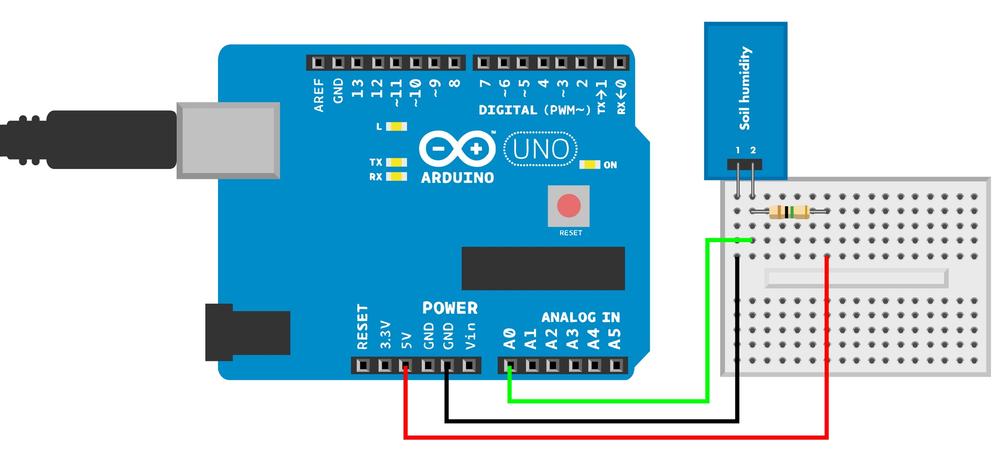
Soil Sensor Code and Connection for Arduino
Figure 12-13 shows the wiring diagram for Arduino. Hook it up as shown, and then run the code from Example 12-9.
// soil_humidity_sensor.ino - read soil humidity by measuring its resistance.// (c) BotBook.com - Karvinen, Karvinen, ValtokariconstintsensorPin=A0;intsoilHumidity=-1;voidsetup(){Serial.begin(115200);}voidloop(){soilHumidity=analogRead(sensorPin);//Serial.println(soilHumidity);delay(100);}
-
It’s a simple analog resistance sensor.
Soil Sensor Code and Connection for Raspberry Pi
Figure 12-14 shows the connection diagram for Raspberry Pi. Hook it up as shown, and then run the code from Example 12-10.

# soil_humidity_sensor.py - read soil humidity by measuring its resistance.# (c) BotBook.com - Karvinen, Karvinen, Valtokariimporttimeimportbotbook_mcp3002asmcpdefmain():whileTrue:h=mcp.readAnalog()#h=h/1024*100#("Current humidity is%d%%"%h)time.sleep(5)if__name__=="__main__":main()
-
It’s a simple analog resistance sensor. As with other analog resistance sensors in this book, the botbook_mcp3002.py library must be in the same directory as this program. You must also install the spidev library, which is imported by botbook_mcp3002. See the comments at the top of botbook_mcp3002/botbook_mcp3002.py or Installing SpiDev.
-
The raw value is converted to percentage of the maximum measurement. For display purposes,
his actually 100 times percentage, e.g., .53 becomes 53 so it can be displayed as 53%.
Test Project: E-paper Weather Forecast
Create your own weather forecast on e-paper. The weather forecast is based on changes in atmospheric pressure. The e-paper display is quite special: you can see it well in bright light, it looks a bit like paper, and the picture stays on without consuming electricity.
You’re reading the hardest project in the book. If you haven’t practiced with the easier experiments and projects already, you might want to go back and complete some of those first.

What You’ll Learn
In the E-paper Weather Forecast project, you’ll learn how to:
- Build a box that shows a graphical weather forecast.
- Predict weather using atmospheric pressure.
- Display graphics on e-paper with zero energy consumption.
- Make Arduino sleep to conserve power.

Weather Forecast Code and Connection for Arduino
The code combines many techniques. You can just build it first, and then learn about the implementation details once it works.
To create your own version, it’s not required that you understand all the code. After you have your weather station running, have a look at drawScreen(). It’s the main function, and quite high level. For example, you could start by changing pos, the location where the plus sign is drawn:
int pos = 10;
drawCharacter(pos, 70, font,'+'),
Techniques used in this code:
- Reading data from the GY65 atmospheric pressure sensor (Atmospheric Pressure GY65).
- Working with hexadecimal numbers, binary numbers, and bitwise operations. See (Hexadecimal, Binary, and Other Numbering Systems and Bitwise Operations).
- Making Arduino sleep to save power. This uses low-level commands to write to ATmega (the chip that powers Arduino) registers.
- Drawing on e-paper display, using the EPD library.
-
Storing images as header files (as in
imagename.h). This is explained in detail in Storing Images in Header Files.
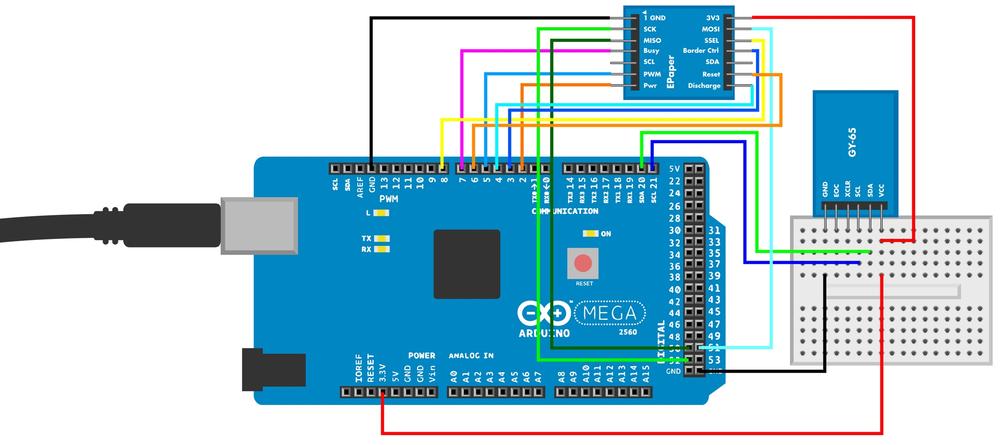
This code uses the Arduino Mega. It would need modification to work on another board.
Figure 12-17 shows the connections for the Arduino Mega. Wire it up as shown, and then run the code from Example 12-11.
// weather_station.ino - print weather data to epaper// (c) BotBook.com - Karvinen, Karvinen, Valtokari#include <inttypes.h>#include <ctype.h>#include <SPI.h>#include <Wire.h>#include <EPD.h>//#include <gy_65.h>//#include <avr/sleep.h>#include <avr/power.h>#include "rain.h"//#include "sun.h"#include "suncloud.h"#include "fonts.h"uint8_timageBuffer[5808];// 264 * 176 / 8constintpinPanelOn=2;constintpinBorder=3;constintpinDischarge=4;constintpinPWM=5;constintpinReset=6;constintpinBusy=7;constintpinEPDcs=8;EPD_ClassEPD(EPD_2_7,pinPanelOn,pinBorder,pinDischarge,pinPWM,pinReset,pinBusy,pinEPDcs,SPI);floatweatherDiff;floattemperature;constintsleepMaxCount=10;// minvolatileintarduinoSleepingCount=sleepMaxCount;voidsetup(){Serial.begin(115200);pinMode(pinPanelOn,OUTPUT);pinMode(pinBorder,OUTPUT);pinMode(pinDischarge,INPUT);pinMode(pinPWM,OUTPUT);pinMode(pinReset,OUTPUT);pinMode(pinBusy,OUTPUT);pinMode(pinEPDcs,OUTPUT);digitalWrite(pinPWM,LOW);digitalWrite(pinReset,LOW);digitalWrite(pinPanelOn,LOW);digitalWrite(pinDischarge,LOW);digitalWrite(pinBorder,LOW);digitalWrite(pinEPDcs,LOW);SPI.begin();//SPI.setBitOrder(MSBFIRST);//SPI.setDataMode(SPI_MODE0);//SPI.setClockDivider(SPI_CLOCK_DIV4);//WDTCSR|=(1<<WDCE)|(1<<WDE);//WDTCSR=1<<WDP0|1<<WDP3;//WDTCSR|=_BV(WDIE);//MCUSR&=~(1<<WDRF);//for(inti=0;i<5808;i++)//imageBuffer[i]=0;readCalibrationData();//}charcharacterMap[14]={'+','-','C','d','0','1','2','3','4','5','6','7','8','9'};//voiddrawCharacter(int16_tx,int16_ty,constuint8_t*bitmap,charcharacter){intcharIndex=-1;for(inti=0;i<14;i++){//if(character==characterMap[i]){charIndex=i;break;}}if(charIndex==-1)return;drawBitmap(x,y,bitmap,charIndex*25,0,25,27,350);//}voiddrawBitmap(int16_tx,int16_ty,constuint8_t*bitmap,int16_tx2,int16_ty2,int16_tw,int16_th,int16_tsource_width){//int16_ti,j,byteWidth=source_width/8;for(j=y2;j<y2+h;j++){//for(i=x2;i<x2+w;i++){byteb=pgm_read_byte(bitmap+j*byteWidth+i/8);if(b&(128>>(i&7))){drawPixel(x+i-x2,y+j-y2,true);}}}}voiddrawPixel(intx,inty,boolblack){//intbit=x&0x07;intbyte=x/8+y*(264/8);intmask=0x01<<bit;if(black==true){imageBuffer[byte]|=mask;}else{imageBuffer[byte]&=~mask;}}voiddrawBufferToScreen(){//for(uint8_tline=0;line<176;++line){EPD.line(line,&imageBuffer[line*(264/8)],0,false,EPD_inverse);}for(uint8_tline=0;line<176;++line){EPD.line(line,&imageBuffer[line*(264/8)],0,false,EPD_normal);}}voiddrawScreen(){//EPD.begin();EPD.setFactor(temperature);EPD.clear();if(weatherDiff>250){// Pa// SunnydrawBitmap(140,30,sun,0,0,117,106,117);//}elseif((weatherDiff<=250)||(weatherDiff>=-250)){// Partly cloudydrawBitmap(140,30,suncloud,0,0,117,106,117);}elseif(weatherDiff<-250){// RaindrawBitmap(140,30,rain,0,0,117,106,117);}//Draw temperatureStringtemp=String((int)temperature);intpos=10;drawCharacter(pos,70,font,'+');//pos+=25;drawCharacter(pos,70,font,temp.charAt(0));pos+=25;if(abs(temperature)>=10){drawCharacter(pos,70,font,temp.charAt(1));pos+=25;}drawCharacter(pos,70,font,'d');pos+=25;drawCharacter(pos,70,font,'C');drawBufferToScreen();//EPD.end();for(inti=0;i<5808;i++)//imageBuffer[i]=0;}voidloop(){Serial.println(temperature);//if(arduinoSleepingCount>=sleepMaxCount){//readWeatherData();//drawScreen();arduinoSleepingCount=0;//arduinoSleep();//}else{arduinoSleep();}}constfloatcurrentAltitude=40.00;// Installation altitude in metersconstlongatmosphereSeaLevel=101325;// PaconstfloatexpectedPressure=atmosphereSeaLevel*pow((1-currentAltitude/44330),5.255);voidreadWeatherData(){temperature=readTemperature();floatpressure=readPressure();weatherDiff=pressure-expectedPressure;}ISR(WDT_vect)//{arduinoSleepingCount++;}voidarduinoSleep(){//set_sleep_mode(SLEEP_MODE_PWR_DOWN);sleep_enable();sleep_mode();//sleep_disable();//power_all_enable();}//
-
Library for e-paper display. You can download the library from https://github.com/repaper/gratis/tree/master/Sketches/libraries. Follow the instructions at http://arduino.cc/en/Guide/Libraries to install the library.
-
This is the botbook.com GY65 library. You used it earlier in Atmospheric Pressure GY65. Copy the library directory into your sketch folder (if you downloaded the sample code for this book, it will already be in there).
-
Images are saved as header files.
-
Prepare SPI before we talk to the e-paper display.
-
Configure SPI to have the most significant bit first (see Bitwise Operations).
-
Configure SPI for SPI_MODE0: this sets the clock polarity to mode CPOL 0, and the clock phase to mode CPHA 0. This means that data is captured on the clock’s rising edge (when the clock signal goes from LOW to HIGH). Data is propagated on the falling edge (when the clock signal goes from HIGH to LOW). Modes (SPI_MODE0) are listed in Arduino documentation (Help→Reference→Libraries→SPI). The SPI settings for the sensor are on its data sheet.
-
SPI_CLOCK_DIV4 sets the SPI clock to 1/4 of the Arduino CPU frequency. This project uses Arduino Mega, so the SPI clock frequency is 16 MHz / 4 = 4 MHz.
-
Enable the watchdog timer. This is what will allow Arduino to go into a deep sleep. Set WDCE (watch dog change enable) and WDE (watch dog enable) in WDTCSR (Watchdog Timer Control Register). These registers are so low level that they are from ATmega documentation (instead of being part of the core Arduino library). Arduino Mega uses the ATmega 1280 chip, so you can find the documentation by searching for “ATmega 1280 data sheet.” The symbol
|=is an inplace bitwise XOR (performs an XOR against the variable’s current value and replaces the variable’s value with the result). The symbol<<represents the bit shift operation. See Bitwise Operations.-
Set the watchdog to wake up the Arduino every 8 seconds.
-
Enable the watchdog interrupt. WDIE is “watch dog interrupt enable.”
-
Clear the watchdog system reset flag (WDRF) from the microcontroller unit status register (MCUSR).
-
Initialize the image buffer (where graphics are drawn before being displayed) with zeroes.

For details about using the GY65 sensor, see the code explanations in Atmospheric Pressure GY65.

List of the 14 characters that are in font.h, a large image that contains these characters.

Find the index of the character in the font.h image.

Draw a character to screen. In practice, the bitmap will contain a font, a big picture with characters side by side. The calculation just selects one of these characters.

drawBitmap()takes a source bitmap, position, and dimensions. It then draws each pixel of the picture to an intermediate image buffer (but does not yet display it on the e-paper display).
Traverse the area two dimensionally to draw the bitmap one pixel at a time.

Draw one pixel to image buffer (but not yet to the e-paper display). The image is stored one bit per pixel, so every byte (8 bits) contains 8 pixels. The width of the display is 264 pixels, so one line is stored in 264/8 = 33 bytes. The code then traverses over each bit, changing it to 1 or 0 as needed.

Blit the already drawn graphics from
imageBufferto screen. This uses the EPD library. The display has 176 lines, 264 dots per line. As one bit represents one pixel, the display has 264/8 (33) bytes per line. Blitting the image is a simple matter of drawing each byte ofimageBuffer, usingEPD.line.
drawScreen()uses the GY65 library to measure environment, and the EPD library to draw on the e-paper display. The larger the pressure difference, the worse the weather. If you want to create your own version of the program, thisdrawScreen()function is where you should begin your customizations.
Draw the image from sun.h to
imageBuffer. To put your own images on the screen, use this function. The parameters aredrawBitmap(imageBufferX, imageBufferY, sourceImage, sourceX, sourceY, sourceWidth, sourceHeight, totalSourceWidth). The first two are the target position (imageBufferX,imageBufferY). The rest of the parameters concern the source bitmap: the source bitmap (sourceImage), what to take from the source bitmap (sourceX,sourceY,sourceWidth,sourceHeight). Finally, the total width of the source bitmap is listed (totalSourceWidth).
Write a character to image buffer.

Blit the
imageBufferfrom memory to the e-paper display. Without this, none of the images would be shown.
Clear the image buffer.

With an unfamiliar component such as a fancy e-paper display, it’s a good idea to confirm sensor data separately by writing it to the serial console.

The watchdog wakes Arduino periodically. If enough time has passed…

…it’s time to run the meat of the program.

Then reset the sleep counter…

…and fall back to sleep to save power.

The ISR() Interrupt Service Routine is called automatically. ISR() runs every time Arduino wakes up, just before anything else runs. This code wakes up Arduino every 8 seconds, so ISR() runs every 8 seconds.

Make Arduino fall asleep to conserve power. As you saw earlier, this required quite some preparation.

This command makes Arduino sleep and stop executing code. Nothing happens after this—until the watchdog wakes up Arduino.

When the watchdog wakes Arduino, code flow continues on this line and wakeup starts.

You worked through all this difficult code? Pat yourself on the back—you’re on your way to becoming a guru!
Environment Experiment: Look Ma, No Power Supply
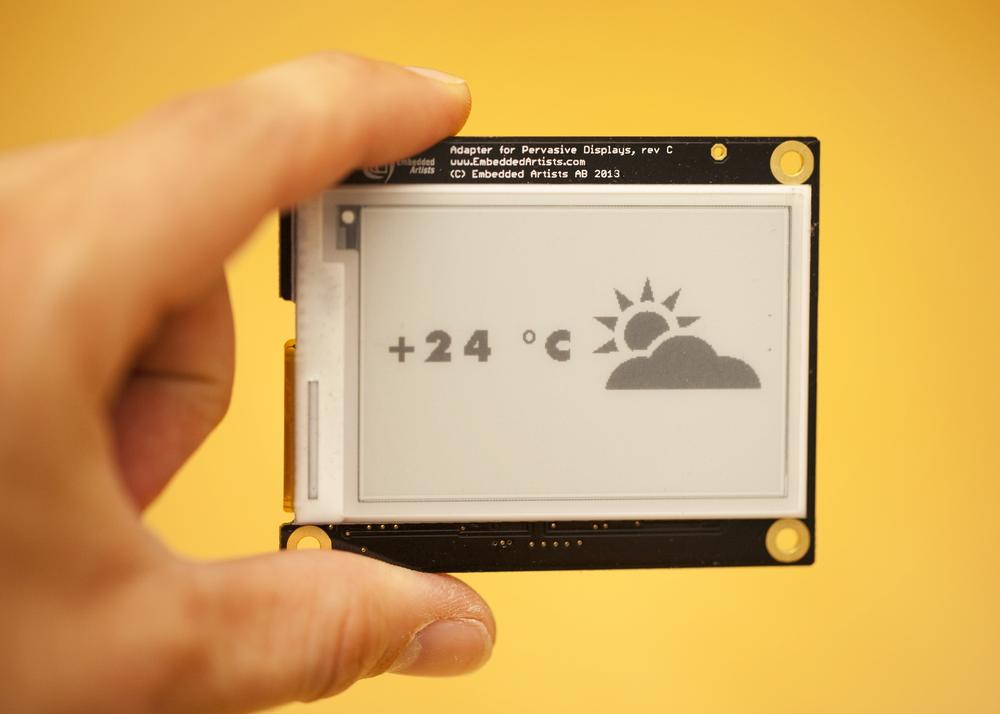
E-paper displays use power only to change the picture on the display. They don’t need any energy to leave a picture on the screen.
You can try it yourself. Use Arduino to display something on your e-paper display. Then power down Arduino, and even disconnect the e-paper display. The picture stays unchanged. In fact, there is no visible difference at all between keeping e-paper connected or disconnecting it (Figure 12-18).
Storing Images in Header Files
Your very own e-paper weather station can already show you the sun. What if you want to draw your own graphics? You can draw your images in an image editing program like GIMP or Photoshop, and then convert the saved BMP images to the C code headers we use in the sketch.
First, use your favorite drawing program to draw an image. GIMP is a good, free choice for this. Save your image in the BMP format. Put the image into the same folder with the other images in this project (images/).
Next, you’ll need to convert the BMP image (sun.bmp) to a C header file (sun.h). You can use the included image2c-botbook.py script for this.
First, install the requirements: Python and Python Imaging Library. Windows users can download a free installer for Python from http://python.org. Mac users will already have Python installed, but Mac and Windows users will need to download the Python Imaging Library from http://www.pythonware.com/products/pil/. Linux users have it easier. For example, here’s how to install the needed libraries:
$ sudo apt-get update
$ sudo apt-get -y install python python-imaging
If your source image is not called foo.bmp, change the filenames in the script. Then you’re ready to convert. These commands work in all of Linux, Windows, and Mac. The dollar sign ($) represents the shell prompt, so don’t type that. Windows users probably have a different-looking prompt. The first command assumes you’re in the subdirectory containing the example code for this book. You can download the sample code from http://botbook.com.
$ cd arduino/weather_station/
$ python image2c-botbook.py
BMP (117, 106) 1
The file is now converted. With the ls or dir command, you can see that foo.h was created in the current working directory. You have now converted your BMP image to a C header file.
In foo.h, your image is now C code:
// File generated with image2c-botbook.py
const unsigned char sun [] PROGMEM= {
0x00, 0x00, 0x00, 0x00, 0x00, 0x00, 0x00, 0x00, 0x00, // ..
0x7F, 0xF0, 0x00, 0xFF, 0xC0, 0x00, 0x1F, 0xF8, 0x00, // ..
This format is convenient for programming. Each byte represents eight pixels, one pixel per bit. For example, hex 0xFC is number 252. In bits, it’s 0b11111100. This means eight bits side by side: black black black black, black black white white.
BMP to C Conversion Program
Image2c-botbook.py converts a BMP image to C header file.
If you need some “code golf” (see http://codegolf.com), try making it work with PNG source files.
This code uses hexadecimal numbers and bitwise operations. To review them, see Hexadecimal, Binary, and Other Numbering Systems and Bitwise Operations.
# image2c-botbook - convert a BMP image to C for use in eInk and LCD displays# (c) BotBook.com - Karvinen, Karvinen, ValtokariimportImage#importmathimageName="images/foo.bmp"#outputName="foo.h"#im=Image.open(imageName)#im.format,im.size,im.modewidth,height=im.sizepixels=list(im.getdata())#length=int(math.floor(width*height/8.0))#carray=length*[0x00]#foryinxrange(0,height):#forxinxrange(0,width):#pixel=pixels[y*width+x]#bit=7-x&0x07#byte=x/8+y*(width/8)#mask=0x01<<bit#ifpixel==0:carray[byte]|=mask#else:carray[byte]&=~maskfileHandle=open(outputName,"w")#index=0fileHandle.write("// File generated with image2c-botbook.py")fileHandle.write("const unsigned char sun [] PROGMEM= {")forbincarray:fileHandle.write("0x%02X,"%b)#index+=1ifindex>15:fileHandle.write("")index=0fileHandle.write("};")
-
PIL, the Python Imaging Library, must be installed as described earlier.
-
The source image, saved in BMP format. Change this to match the name and location of your file if needed.
-
Output filename. Change this to match the file you want to create.
-
PIL can open many formats.
-
Break the image into individual pixels. This is half of the work.
-
Length of the whole image in bytes (1 B == 8 bit)
-
Create the target C array, and initialize it with zeroes.
-
For each line…
-
…and for each pixel in the current line, perform the indented operations.
-
The current pixel.
-
The index of bit in the current byte.
-
The current byte index.
-
Create the bit mask for current bit in current byte. For example, the mask 0b00000001 would be created to change the last bit of a byte to zero.
-
Change the bit.
-
C headers are just text files.
-
Write each of the bytes as a hex code.
Enclosure Tips
We used a plastic box made by Hammond for our weather forecaster. But how do you make an odd-shaped hole like the one we need here? First draw the shape you want to cut out on the box lid. Drill holes in each corner of the shape with a large drill bit (10-20 mm). Then start going from corner to corner with a jigsaw blade. Finish the hole with file and sandpaper (see Figure 12-19).

Use hot glue to attach the screen to the box as shown in Figure 12-20.

On the back of the box, we made a pattern of small holes (see Figure 12-21). Without those, air would not be able to get to the sensor. The finished gadget is shown in Figure 12-22.


Congratulations, you now have your own weather prophet with e-paper display!
This might be the end of this book, but it’s just the beginning for your projects. Now that you can work with so many sensors and many outputs too, what are you going to build?
Good luck with your projects!