Chapter 17: Counting Frequencies
17.3 Selecting Variables for PROC FREQ
17.4 Using Formats to Label the Output
17.5 Using Formats to Group Values
17.6 Problems Grouping Values with PROC FREQ
17.7 Displaying Missing Values in the Frequency Table
17.8 Changing the Order of Values in PROC FREQ
17.10 Requesting Multiple Two-Way Tables
17.11 Producing Three-Way Tables
PROC FREQ can be used to count frequencies of both character and numeric variables, in one-way, two-way, and three-way tables. In addition, you can use PROC FREQ to create output data sets containing counts and percentages. Finally, if you are statistically inclined, you can use this procedure to compute various statistics such as chi-square, odds ratio, and relative risk. (See Ron Cody and Jeffrey K. Smith, Applied Statistics and the Programming Language, 5th ed. (Englewood Cliffs, NJ: Prentice Hall, 2005 or SAS Statistics by Example, published by SAS Press (Cody, 2011)
Let’s start out by running PROC FREQ with all the defaults, as shown in Program 17.1:
Program 17.1: Counting Frequencies: One-Way Tables Using PROC FREQ
title "PROC FREQ with all the Defaults";
proc freq data=Learn.Survey;
run;
The default action of PROC FREQ is to compute frequencies on every variable in your data set, both character and numeric. Here is a partial listing of the output:
Figure 17.1: Output from Program 17.1


Take a moment to look at the frequencies for Gender. The column labeled Frequency tells you that there are three females and four males in the data set. Expressed as a percentage, this corresponds to 42.86% and 57.14%, respectively.
The two columns labeled Cumulative Frequency and Cumulative Percent are a cumulative count of frequencies and percentages.
PROC FREQ computes counts for each unique value of a variable. For example, if you look at the variable Age, you see how many subjects are 22 years old, 23 years old, and so forth. You would probably prefer to see frequencies based on age groups. We'll get to that in a minute.
Because you will rarely want to compute frequencies on every variable in a data set, you need to include a TABLES statement to list the variables for which you want to compute frequencies. You may also want to eliminate the cumulative columns because they are not usually needed. The following program selects Gender and Ques1–Ques3 and eliminates the cumulative statistics as well.
Program 17.2: Adding a TABLES Statement to PROC FREQ
title "Adding a TABLES Statement and the NOCUM Tables Option";
proc freq data=learn.survey;
tables Gender Ques1-Ques3 / nocum;
run;
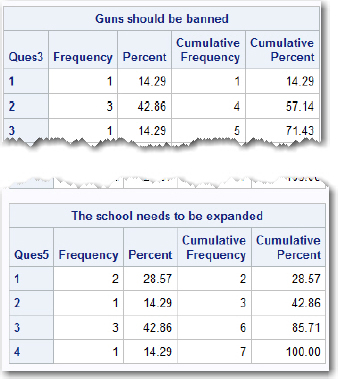
You use a TABLES statement (TABLE, singular, works as well) to list the variables you want PROC FREQ to include. NOCUM is a TABLES option that tells PROC FREQ not to include the two cumulative statistics columns in the output. Because NOCUM is an option in the TABLES statement, it follows a slash (this is the syntax for all statement options within a procedure). In this program, you obtain counts and percentages for the four variables Gender, Ques1, Ques2, and Ques3. Here is the output:
Figure 17.2: Output from Program 17.2
By the way, if you don’t want PROC FREQ to compute percentages, you can add the NOPERCENT option in the TABLES statement.
It is easy enough to realize that F stands for Female and M for Male in the listing for Gender. However, it would improve the appearance of the report if you used a format to label these values. You might also want to supply a format for the Ques variables. Here is Program 17.2 with formats added:
Program 17.3: Adding Formats to Program 17.2
proc format;
value $Gender
'F' = 'Female'
'M' = 'Male';
value $Likert
'1' = 'Strongly disagree'
'2' = 'Disagree'
'3' = 'No opinion'
'4' = 'Agree'
'5' = 'Strongly agree';
run;
title "Adding Formats";
proc freq data=Learn.Survey;
tables Gender Ques1-Ques3 / nocum;
format Gender $Gender.
Ques1-Ques3 $Likert.;
run;
Adding formats to these variables greatly improves the readability of the output as shown here:
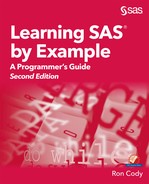
Figure 17.3: Partial Output from Program 17.4

Notice that the format labels are displayed in the frequency tables.
Because PROC FREQ computes frequencies on formatted values, you can use formats to group values together into larger categories. Data set Survey contains an Age variable. Suppose you want to generate frequencies for age, broken down into three age groups. You also want to look at question 5 (Ques5) with the values 1 and 2 combined into a Generally disagree category and values 4 and 5 combined into a Generally agree category. You can use formats to accomplish these tasks, as shown in the next program:
Program 17.4: Using Formats to Group Values
proc format;
value AgeGroup
low-<30 = 'Less than 30'
30-<60 = '30 to 59'
60-high = '60 and higher';
value $Agree_Disagree
'1','2' = 'Generally disagree'
'3' = 'No opinion'
'4','5' = 'Generally agree';
run;
title "Using Formats to Create Groups";
proc freq data=Learn.Survey;
tables Age Ques5 / nocum nopercent;
format Age AgeGroup.
Ques5 $Agree_Disagree.;
run;
This is a useful technique because you don’t have to create a new data set. If you want to see frequencies for different groupings, you only need to make a new format. Here is the output:
Figure 17.4: Output from Program 17.4

Age frequencies are now grouped into three categories and the Likert scale for Ques5 has only three categories.
A problem can occur when PROC FREQ uses formatted values to create groups. When you use the keyword OTHER as a range when you create a format, all values that do not match a format range are grouped together. PROC FREQ assigns all of them to the value of the variable with the lowest value.
As an example, you have a data set (Grouping) with the following values:
Figure 17.5: Data Values from Data Set Grouping
|
Obs |
X |
Obs |
X |
Obs |
X |
|
1 |
2 |
5 |
4 |
9 |
5 |
|
2 |
2 |
6 |
4 |
10 |
5 |
|
3 |
3 |
7 |
4 |
11 |
5 |
|
4 |
3 |
8 |
missing |
12 |
6 |
You write the following program:
Program 17.5: Demonstrating a Problem in How PROC FREQ Groups Values
proc format;
value Two
low-3 = 'Group 1'
4-5 = 'Group 2'
other = 'Other values';
run;
title "Grouping Values (First Try)";
proc freq data=Learn.Grouping;
tables X / nocum nopercent;
format X Two.;
run;
Looking at the values in data set Grouping, you would expect to see four values in Group 1 and six values in Group 2, one value for Other values and one missing value. Here is what you get:
Figure 17.6: Output from Program 17.5

Because the values of missing and 6 both fall into the OTHER category, they are assigned the smallest value of the two (missing), resulting in this output.
To fix this problem, all you need to do is assign a separate category for missing values when you create your format, as in the following example:
Program 17.6: Fixing the Grouping Problem
proc format;
value Two
low-3 = 'Group 1'
4-5 = 'Group 2'
. = 'Missing'
other = 'Other values';
run;
Now, missing values and other values are not placed into the same group. Here is the result:
Figure 17.7: Adding a Label for Missing Values in the Format

By adding a separate label for missing values, the value of 6 (observation 12) is placed in the Other values category.
SAS normally tells you the frequency of missing values in a separate listing below the frequency table. You can ask SAS to treat missing values just as any other values and include them in the frequency table by including the TABLES option MISSING. Not only does this option bring the count of missing values up into the main table, it also changes how SAS reports percentages. Without the MISSING option, percentages are computed as the frequency of each category divided by the number of nonmissing values; with the MISSING option, SAS computes frequencies by dividing the frequencies by the number of missing and nonmissing observations. To be sure this is clear, let’s run PROC FREQ with and without the MISSING option:
Program 17.7: Demonstrating the Effect of the MISSING Option of PROC FREQ
title "PROC FREQ Without the MISSING Option";
proc freq data=Learn.Grouping;
format X two.;
tables X;
run;
title "PROC FREQ With the MISSING Option";
proc freq data=Learn.Grouping;
tables X / missing;
format X Two.;
run;
Here is the output:
Figure 17.8: Output from Program 17.7

Look at the Percent column for Group 1 in both of these tables. Without the MISSING option, the percent, 36.36%, is obtained by dividing the frequency for Group 1 (4) by the number of nonmissing values (11). With the MISSING option, the value, 33.33%, is obtained by dividing the frequency for Group 1 (4) by the total number of observations (12).
Note: It is important to remember that when you use the MISSING option in the TABLES statement in PROC FREQ, the values in the percent column (and cumulative percent column) are not usually the value you want.
By default, PROC FREQ orders the values based on internal values (even if a variable has a format). You can change the order of the frequency listings with the ORDER= procedure option. Valid values for the ORDER= Option in PROC FREQ are as follows:
|
Order= Option |
Effect |
|
Internal (default) |
Orders values by their internal value |
|
Formatted |
Orders values by their formatted value |
|
Freq |
Orders values from the most frequent to the least frequent |
|
Data |
Orders values based on their order in the input data set |
Note that these options do not affect missing values, which are always listed first.
To demonstrate how these options work, we start with a data set (Test) with values of 1, 2, 3, 4, and missing, with frequencies as shown here:
|
Internal Value |
Formatted Value |
Frequency |
|
1 |
Yellow |
2 |
|
2 |
Blue |
3 |
|
3 |
Red |
4 |
|
4 |
Green |
1 |
Using these values, you create a format that corresponds to the values in the table and then run PROC FREQ like this:
Program 17.8: Demonstrating the ORDER= Option of PROC FREQ
proc format;
value Colors
1 = 'Yellow'
2 = 'Blue'
3 = 'Red'
4 = 'Green'
. = 'Missing';
run;
data Test;
input Color @@;
datalines;
3 4 1 2 3 3 3 1 2 2
;
title "Default Order (Internal)";
proc freq data=Test;
tables Color / nocum nopercent missing;
format Color Colors.;
run;
Here is the output:
Figure 17.9: Output from Program 17.8

Notice that the values are ordered by the internal values of Color.
The next program demonstrates how the other ORDER= options work:
Program 17.9: Demonstrating the ORDER= Formatted, Data, and Freq Options
title "ORDER = Formatted";
proc freq data=Test order=formatted;
tables Color / nocum nopercent;
format Color Colors.;
run;
title "ORDER = Data";
proc freq data=Test order=data;
tables Color / nocum nopercent;
format Color Colors.;
run;
title "ORDER = Freq";
proc freq data=test order=freq;
tables Color / nocum nopercent;
format Color Colors.;
run;
Here is the output:
Figure 17.10: Output from Program 17.9

ORDER=formatted alphabetizes the list based on the formatted values.
To understand the ORDER=data option, notice that the first four observations in the data set Test are 3, 4, 1, and 2. This order controls the order of the frequencies in the table. Keep in mind that ORDER=data produces tables that may change if you run the program with different data or data in a different order. Using the ORDER=data option is usually a bad idea because having a program work differently with different data values is not consistent with good program practices.
Finally, the ORDER=freq option lists the values from the most frequent to the least frequent. This last option is especially useful when you have a large number of categories and you want to see which values are most frequent.
You can easily produce two-way tables (also called crosstab tables) by specifying the row and column variables in a TABLES statement, separated by an asterisk (*). For example, to see a table of gender by blood type in the Blood data set, you would write the following:
Program 17.10: Requesting a Two-Way Table
title "A Two-way Table of Gender by Blood Type";
proc freq data=Learn.Blood;
tables Gender * BloodType;
run;
The asterisk between Gender and BloodType tells PROC FREQ that you want a two-way table with Gender forming the rows of the table and BloodType forming the columns.
Here is the table:
Figure 17.11: Output from Program 17.10

The upper left corner of the table is the key to the four numbers in each box. For example, looking at females with blood type A, the first number (Frequency = 178) tells you there are 178 females with type A blood. The second number (17.80) is the percentage of all subjects who were females with type A blood. The third number in the box is a row percentage. The 40.45 in this cell tells you that of all the females (which form a row in the table), 40.45% have type A blood. Finally, the fourth number in each cell is a column percentage. In this same cell, 43.20% of those subjects with type A blood are female.
You can request multiple two-way tables in several ways. For example, if you want to see one row variable broken down by several column variables, you can use a TABLES statement like this:
tables A * (B C D);
This statement generates three tables: A by B, A by C, and A by D. You can supply a list of variables (in parentheses) for both the row and column variables like this:
tables (A B) * (C D);
This request generates four tables: A by C, A by D, B by C, and B by D. Remember that you can use any one of the short-hand notations that SAS allows for referring to a group of variables. To review, you have the following:
|
Notation |
Result |
|
Ques1 – Ques10 |
Ques1, Ques2, … Ques10 |
|
VarA -- VarB |
All variables from VarA to VarB in the order in which they appear in the SAS data set |
|
Ques: |
All variables that begin with 'Ques:' |
|
_numeric_ |
All numeric variables in the SAS data set |
|
_character_ |
All character variables in the SAS data set |
|
_all_ |
All variables in the SAS data set |
Of course, you couldn’t use _all_ in a two-way table request; it was included in the table for completeness.
You may wonder, “How can I display three dimensions on a piece of paper?” You can do so when you request a three-way table in the form:
tables Page * Row * Column;
SAS uses separate pages for each value of Page and displays a table of Row by Column on each page. Unless you have a relative in the paper business, you should be very cautious when submitting three-way tables because the output can become quite large.
As an example of a three-way table, Program 17.11 produces a table of AgeGroup by BloodType for each value of Gender.
Program 17.11: Requesting a Three-Way Table with PROC FREQ
title "Example of a Three-way Table";
proc freq data=learn.blood;
tables Gender * AgeGroup * BloodType /
nocol norow nopercent;
run;
Three table options, NOCOL, NOROW, and NOPERCENT, were added to this program. They eliminate the column percentage, row percentage, and overall percentage figures from the table. Here is the output:
Figure 17.12: Output from Program 17.11

For a discussion of how to create a data set containing frequency counts using PROC FREQ, please refer to Chapter 24.
Solutions to odd-numbered problems are located at the back of this book. Solutions to all problems are available to professors. If you are a professor, visit the book’s companion website at support.sas.com/cody for information about how to obtain the solutions to all problems.
1. Using the SAS data set Blood, generate one-way frequencies for the variables Gender, BloodType, and AgeGroup. Use the appropriate options to omit the cumulative statistics and percentages.
2. Using the SAS data set BloodPressure, generate frequencies for the variable Age. Use a user-defined format to group ages into three categories: 40 and younger, 41 to 60, and 61 and older. Use the appropriate options to omit the cumulative statistics and percentages.
3. Using the data set Blood, produce frequencies for the variable Chol (cholesterol). Use a format to group the frequencies into three groups: low to 200 (normal), 201 and higher (high), and missing. Run PROC FREQ twice, once using the MISSING option, and once without. Compare the percentages in both listings.
4. Using the SAS data set Voter, produce two-way tables for Party by each of the four questions (Ques1–Ques4).
5. Using the SAS data set College, create a two-way table of Scholarship (rows) by ClassRank (columns). Use a user-defined format to group class rank into two groups: 70 and lower, and 71 and higher. (Please see the note in Chapter 16, Problem 2, about the permanent formats used in this data set.)
6. Using the SAS data set College, produce a three-way table of Gender (page) by Scholarship (row) by SchoolSize (column).
7. Using the SAS data set Blood, produce a table of frequencies for BloodType, in frequency order.