
One of the benefits of D3's excellent support for functional style JavaScript programming is that it allows functions to be treated as data as well. This particular feature can offer some very powerful capabilities under certain circumstances. This is a more advanced recipe. Don't worry about it if you are new to D3 and having some difficulty understanding it at first. Over time, this kind of usage will become natural to you.
Open your local copy of the following file in your web browser:
https://github.com/NickQiZhu/d3-cookbook/blob/master/src/chapter3/function-as-data.html
In this recipe, we will explore the possibility of binding functions themselves as data to your visual elements. This capability is extremely powerful and flexible if used correctly:
<div id="container"></div>

<script type="text/javascript">
    var data = []; // <- A

    var next = function (x) { // <- B
        return 15 + x * x;
    };

   var newData = function () { // <- C
        data.push(next);
        return data;
    };

   function render(){
        var selection = d3.select("#container")
                  .selectAll("div")
                   .data(newData); // <- D

        selection.enter().append("div").append("span");

        selection.exit().remove();

        selection.attr("class", "v-bar")
            .style("height", function (d, i) {
                return d(i)+"px"; // <- E
            })
        .select("span")
            .text(function(d, i){
              return d(i); } // <- F
            );
   }

   setInterval(function () {
       render();
   }, 1500);

   render();
</script>
This preceding code produces the following bar chart:
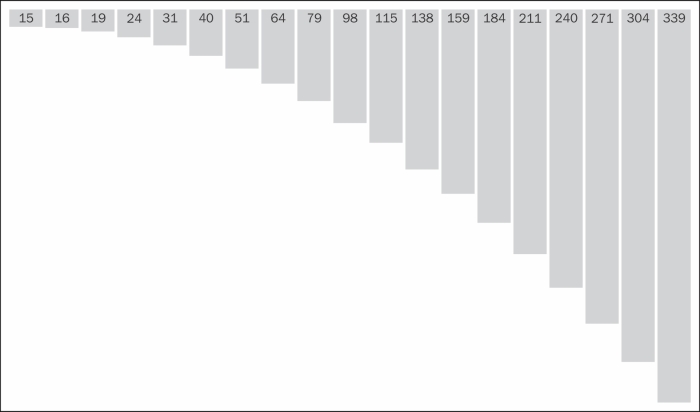
Data as Function
In this recipe, we chose to visualize the output of formula 15 + x * x using a series of vertical bars, each of them annotated with its representing integral value. This visualization adds a new bar to the right of the previous one every one and a half seconds. We can of course implement this visualization using the techniques we have discussed in the previous two recipes. So we generated an array of integers using the formula, then just appended a new integer from n to n+1 every 1.5 seconds before re-rendering the visualization. However, in this recipe, we decided to take a more functional approach.
This time we started with an empty data array on line A. On line B, a simple function is defined to calculate the result of this formula 15+x^2. Then on line C, another function is created to generate the current data set which contains n+1 references to the next function. Here is the code for functional data definition:
    var data = []; // <- A

    var next = function (x) { // <- B
        return 15 + x * x;
    };

   var newData = function () { // <- C
        data.push(next);
        return data;
    };
This seems to be a strange setup to achieve our visualizational goal. Let's see how we can leverage all these functions in our visualization code. On line D, we bind our data to a selection of div elements just as we did in previous recipes. However, this time the data is not an array but rather the newData function:
        var selection = d3.select("#container")
                   .selectAll("div")
                   .data(newData); // <- D
D3 is pretty flexible when it comes to data. If you provide a function to the data function, D3 will simply invoke the given function and use the returned value of this function as a parameter of the data function. In this case, the data being returned by the newData function is an array of function references. As the result of this, now in our dynamic modifier function, on line E and F, the datum d that is being passed into these functions are actually references to the next function, as shown in the following code:
        selection.attr("class", "v-bar")
            .style("height", function (d, i) {
                return d(i)+"px"; // <- E
            })
            .select("span")
                .text(function(d, i){
                    return d(i); } // <- F
                );
As a reference to a function, d can now be invoked with index i as the parameter, which in turn generates the output of the formula needed for our visualization.
Note
In JavaScript, functions are special objects, so semantically this is exactly the same as binding objects as data. Another note on this topic is that data can also be considered as functions. Constant values such as integers can be thought of as a static function that simply returns what it receives with no modification made.
This technique might not be the most commonly-used technique in visualization, but when used properly, it is extremely flexible and powerful, especially when you have a fluid data set.
Note
Datum function typically needs to be idempotent to make sense. Idempotence is the property of being able to apply the same function with the same inputs multiple times without changing the result beyond the initial application. For more detail on idempotence visit: http://en.wikipedia.org/wiki/Idempotence