
By default, the D3 line generator uses linear interpolation mode, however, D3 supports a number of different line interpolation modes. Line interpolation determines how data points will be connected, for example, by a straight line (linear interpolation) or a curved line (cubic interpolation). In this recipe, we will show you how these interpolation modes can be set along with their effects.
Open your local copy of the following file in your web browser:
https://github.com/NickQiZhu/d3-cookbook/blob/master/src/chapter7/line-interpolation.html
This recipe is built on top of what we have done in the previous recipe, so, if you are not yet familiar with basic line generator functions, please review the previous recipe first before proceeding.
Now, let's see how different line interpolation modes can be used:
    var width = 500,
        height = 500,
        margin = 30,
        x = d3.scale.linear()
            .domain([0, 10])
            .range([margin, width - margin]),
        y = d3.scale.linear()
            .domain([0, 10])
            .range([height - margin, margin]);

    var data = [
        [
            {x: 0, y: 5},{x: 1, y: 9},{x: 2, y: 7},
            {x: 3, y: 5},{x: 4, y: 3},{x: 6, y: 4},
            {x: 7, y: 2},{x: 8, y: 3},{x: 9, y: 2}
        ],
        d3.range(10).map(function(i){
            return {x: i, y: Math.sin(i) + 5};
        })
    ];

    var svg = d3.select("body").append("svg");

    svg.attr("height", height)
        .attr("width", width);

    renderAxes(svg);

    render("linear");

    renderDots(svg);

    function render(mode){
        var line = d3.svg.line()
                .interpolate(mode) // <-A
                .x(function(d){return x(d.x);})
                .y(function(d){return y(d.y);});

        svg.selectAll("path.line")
                .data(data)
            .enter()
                .append("path")
                .attr("class", "line");

        svg.selectAll("path.line")
                .data(data)
            .attr("d", function(d){return line(d);});
    }

    function renderDots(svg){ // <-B
        data.forEach(function(set){
             svg.append("g").selectAll("circle")
                .data(set)
              .enter().append("circle") // <-C
                .attr("class", "dot")
                .attr("cx", function(d) { return x(d.x); })
                .attr("cy", function(d) { return y(d.y); })
                .attr("r", 4.5);
        });
    }
// Axes related code omitted
The preceding code generates the following line chart in your browser with configurable interpolation modes:
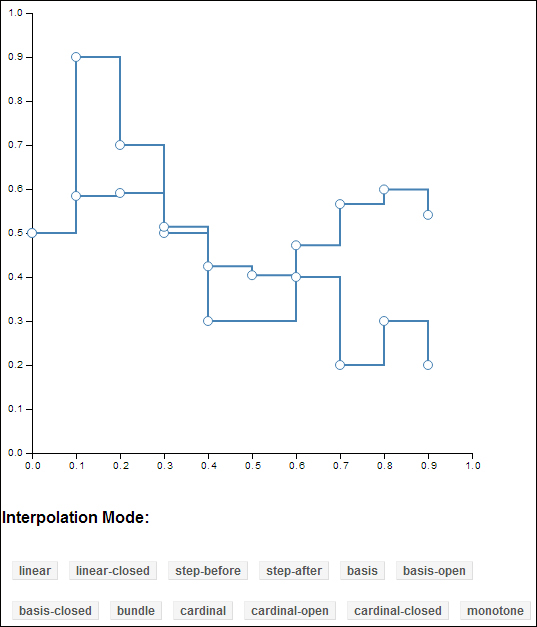
Line interpolation
Overall, this recipe is similar to the previous one. Two lines are generated using pre-defined data set. However, in this recipe, we allow the user to select a specific line interpolation mode, which is then set using the interpolate function on line generator (see line A).
var line = d3.svg.line()
                .interpolate(mode) // <-A
                .x(function(d){return x(d.x);})
                .y(function(d){return y(d.y);});
The following interpolation modes are supported by D3:
- linear: Linear segments, that is, polyline
- linear-closed: Closed linear segments, that is, polygon
- step-before: Alternated between the vertical and horizontal segments, as in a step function
- step-after: Alternated between the horizontal and vertical segments, as in a step function
- basis: A B-spline, with control point duplication on the ends
- basis-open: An open B-spline; may not intersect the start or end
- basis-closed: A closed B-spline, as in a loop
- bundle: Equivalent to basis, except the tension parameter is used to straighten the spline
- cardinal: A Cardinal spline, with control point duplication on the ends.
- cardinal-open: An open Cardinal spline; may not intersect the start or end, but will intersect other control points
- cardinal-closed: A closed Cardinal spline, as in a loop
- monotone: Cubic interpolation that preserves monotonicity in y
Additionally, in the renderDots function (see line B) we have also created a small circle for each data point to serve as reference points. These dots are created using svg:circle elements, as shown on line C:
function renderDots(svg){ // <-B
        data.forEach(function(set){
             svg.append("g").selectAll("circle")
                .data(set)
              .enter().append("circle") // <-C
                .attr("class", "dot")
                .attr("cx", function(d) { return x(d.x); })
                .attr("cy", function(d) { return y(d.y); })
                .attr("r", 4.5);
        });
}