
Using D3 line generator, we can technically generate an outline of any shape, however, even with different interpolation-support, directly drawing an area using line (as in an area chart) is not an easy task. This is why D3 also provides a separate shape generator function specifically designed for drawing area.
Open your local copy of the following file in your web browser:
https://github.com/NickQiZhu/d3-cookbook/blob/master/src/chapter7/area.html
In this recipe, we will add a filled area to a pseudo line chart effectively turning it into an area chart:
<script type="text/javascript">
    var width = 500,
        height = 500,
        margin = 30,
        duration = 500,
        x = d3.scale.linear() // <-A
            .domain([0, 10])
            .range([margin, width - margin]),
        y = d3.scale.linear()
            .domain([0, 10])
            .range([height - margin, margin]);

    var data = d3.range(11).map(function(i){ // <-B
            return {x: i, y: Math.sin(i)*3 + 5};
        });

    var svg = d3.select("body").append("svg");

    svg.attr("height", height)
        .attr("width", width);

    renderAxes(svg);

    render("linear");

    renderDots(svg);

    function render(){
        var line = d3.svg.line()
                .x(function(d){return x(d.x);})
                .y(function(d){return y(d.y);});

        svg.selectAll("path.line")
                .data([data])
            .enter()
                .append("path")
                .attr("class", "line");

        svg.selectAll("path.line")
                .data([data])
            .attr("d", function(d){return line(d);});

        var area = d3.svg.area() // <-C
            .x(function(d) { return x(d.x); }) // <-D
            .y0(y(0)) // <-E
            .y1(function(d) { return y(d.y); }); // <-F

        svg.selectAll("path.area") // <-G
                .data([data])
            .enter()
                .append("path")
                .attr("class", "area")
                .attr("d", function(d){return area(d);}); // <-H
    }

    // Dots rendering code omitted

    // Axes related code omitted
    ...
</script>
The preceding code generates the following visual output:
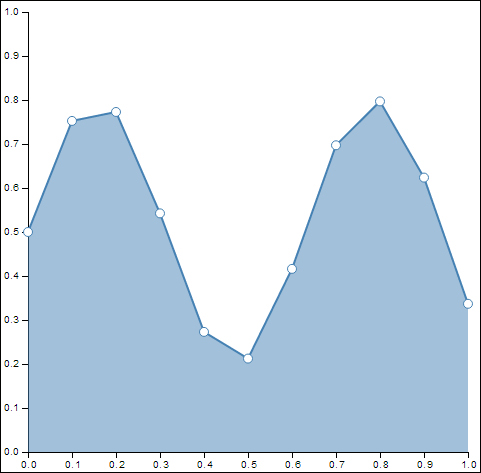
Area generator
Similar to the Using a line generator recipe earlier in this chapter, we have two scales defined to map data to visual domain on x and y coordinates (see line A), in this recipe:
x = d3.scale.linear() // <-A
            .domain([0, 10])
            .range([margin, width - margin]),
        y = d3.scale.linear()
            .domain([0, 10])
            .range([height - margin, margin]);

    var data = d3.range(11).map(function(i){ // <-B
            return {x: i, y: Math.sin(i)*3 + 5};
        });
On line B, data is generated by a mathematical formula. Area generator is then created using the d3.svg.area function (see line C):
var area = d3.svg.area() // <-C
            .x(function(d) { return x(d.x); }) // <-D
            .y0(y(0)) // <-E
            .y1(function(d) { return y(d.y); }); // <-F
As you can see, D3 area generator is—similar to the line generator—designed to work in a 2D homogenous coordinate system. With the x function defining an accessor function for x coordinate (see line D), which simply maps data to the visual coordinate using the x scale we defined earlier. For the y coordinate, we provided the area generator two different accessors; one for the lower bound (y0) and the other for the higher bound (y1) coordinates. This is the crucial difference between area and line generator. D3 area generator supports higher and lower bound on both x and y axes (x0, x1, y0, y1), and the shorthand accessors (x and y) if the higher and lower bounds are the same. Once the area generator is defined, the method of creating an area is almost identical to the line generator.
svg.selectAll("path.area") // <-G
                .data([data])
            .enter()
                .append("path")
                .attr("class", "area")
                .attr("d", function(d){return area(d);}); // <-H
Area is also implemented using the svg:path element (see line G). D3 area generator is used to generate the "d" formula for the svg:path element on line H with data "d" as its input parameter.