
At last, we will show how to implement a force-directed graph, the classic application of D3 force layout. However, we believe with all the techniques and knowledge you have gained so far from this chapter implementing force-directed graph should feel quite straightforward.
Open your local copy of the following file in your web browser:
https://github.com/NickQiZhu/d3-cookbook/blob/master/src/chapter11/force-directed-graph.html.
In this recipe we will visualize the flare data set as a force-directed tree (tree is a special type of graph):
<script type="text/javascript">
    var w = 1280,
        h = 800,
        z = d3.scale.category20c();

    var force = d3.layout.force()
        .size([w, h]);

    var svg = d3.select("body").append("svg")
        .attr("width", w)
        .attr("height", h);

    d3.json("/data/flare.json", function(root) {
      var nodes = flatten(root),
          links = d3.layout.tree().links(nodes); // <-B

      force
          .nodes(nodes)
          .links(links)
          .start();

      var link = svg.selectAll("line")
          .data(links)
        .enter().insert("line")
          .style("stroke", "#999")
          .style("stroke-width", "1px");

      var node = svg.selectAll("circle.node")
          .data(nodes)
        .enter().append("circle")
          .attr("r", 4.5)
          .style("fill", function(d) {
             return z(d.parent && d.parent.name);
})
          .style("stroke", "#000")
          .call(force.drag);

      force.on("tick", function(e) {
        link.attr("x1", function(d) { return d.source.x; })
            .attr("y1", function(d) { return d.source.y; })
            .attr("x2", function(d) { return d.target.x; })
            .attr("y2", function(d) { return d.target.y; });

        node.attr("cx", function(d) { return d.x; })
            .attr("cy", function(d) { return d.y; });
      });
    });

    function flatten(root) { // <-A
      var nodes = [];
      function traverse(node, depth) {
        if (node.children) {
          node.children.forEach(function(child) {
            child.parent = node;
            traverse(child, depth + 1);
          });
        }
        node.depth = depth;
        nodes.push(node);
      }
      traverse(root, 1);
      return nodes;
    }
</script>
This recipe visualizes hierarchical flare data set as a force-directed tree:
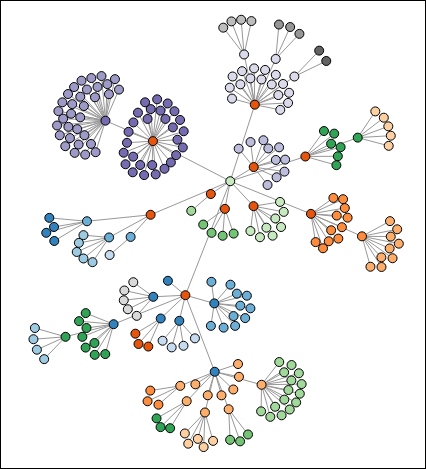
Force-Directed Graph (Tree)
As we can already see, this recipe is pretty short and a quarter of the code was actually devoted to data processing. This is due to the fact that force-directed graph is what force layout was designed for in the first place. Thus there is really not much to do other than simply apply the layout with correct data structure. First, we flatten the hierarchical data set in flatten function (line A) since this is what force layout expects. Second, we leverage the d3.layout.tree.links function to generate proper linkage between tree nodes. The d3.layout.tree.links function returns an array of link objects representing links from parent to child for each given node object, in other words, builds the tree structure. Once the data is properly formatted the rest of this recipe applies standard force layout usage with hardly any customization at all.
- The Building a tree recipe in Chapter 9, Lay Them Out, for more information on D3 tree layout
- For more information on force-directed graphs, visit the site: http://en.wikipedia.org/wiki/Force-directed_graph_drawing