 Placing marks on a map
by Matt Floyd, Ashley Ohmann, Ashutosh Nandeshwar, Jen Stirrup
Tableau: Creating Interactive Data Visualizations
Placing marks on a map
by Matt Floyd, Ashley Ohmann, Ashutosh Nandeshwar, Jen Stirrup
Tableau: Creating Interactive Data Visualizations
- Tableau: Creating Interactive Data Visualizations
- Table of Contents
- Tableau: Creating Interactive Data Visualizations
- Tableau: Creating Interactive Data Visualizations
- Credits
- Preface
- 1. Module 1
- 1. A Short Dash to Dashboarding!
- 2. Summarizing Your Data for Dashboards
- 3. Interacting with Data for Dashboards
- 4. Using Dashboards to Get Results
- 5. Putting the Dash into Dashboards
- 6. Making Dashboards Relevant
- 7. Visual Best Practices
- 2. Module 2
- 1. Connecting to Data Sources
- Introduction
- Connecting to text files
- Connecting to Excel files
- Connecting to Access databases
- Connecting to a SQL Server
- Pasting from a clipboard
- Connecting to other databases
- Connecting to Windows Azure Marketplace
- Understanding dimensions and measures
- Changing data types
- Applying filters
- Merging multiple data sources
- 2. Creating Univariate Charts
- 3. Creating Bivariate Charts
- 4. Creating Multivariate Charts
- 5. Creating Maps
- 6. Calculating User-defined Fields
- 7. Customizing and Saving
- 8. Exporting and Sharing
- 9. Exploring Advanced Features
- 1. Connecting to Data Sources
- 3. Module 3
- 1. Getting Started with Tableau Public
- 2. Tableau Public Interface Features
- 3. Connecting to Data
- 4. Visualization – Tips and Types
- 5. Calculations
- 6. Level of Detail and Table Calculations
- 7. Dashboard Design and Styling
- 8. Filters and Actions
- 9. Publishing Your Work
- A. Bibliography
- Index
One of the ways to encode information on a map is placing a mark for each geographic value and adjusting the size/color of that mark based on some measure. This is the most common type of a map with information used in businesses and media.
Let's use the sample file, Sample – Superstore Sales (Excel). Open a new worksheet and select Sample – Superstore Sales (Excel) as the data source.
Once the data is loaded, perform the following steps to create a map with markers encoding information of a measure:
- Click on the Show Me button to bring the Show Me toolbar on the screen.
- While holding the Ctrl key, click on State (under Customer City) from Dimensions and Profit from Measures.
- Click on the symbol of maps on the Show Me toolbar, and you will see the map as shown in the following screenshot:
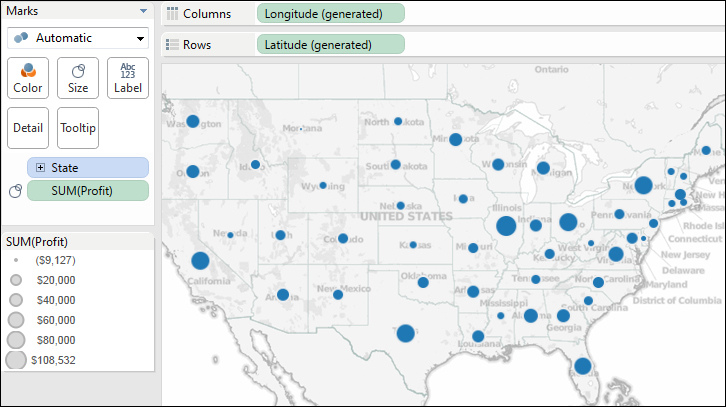
Once we loaded the data, Tableau assigned geographic roles to State, City, and Customer Zip Code using field names. Tableau also generated Latitude and Longitude for these geographic roles. When we clicked on the symbol of maps, Tableau automatically added State to the Level of Detail pane and placed marks for every state that was present in the data. If you add Customer Zip Code to the Detail box, Tableau will generate markers by zip code and adjust the mark size for the Profit value of that zip code.
-
No Comment