
Tableau provides various options to analyze data fields that are of date type. Some options include grouping by quarters, years, or months.
Let's use the sample file Sample – Coffee Chain (Access). Open a new worksheet and select Sample – Coffee Chain (Access) as the data source.
Once the data is loaded, perform the following steps to use dates in your analysis:
- Click on the Show Me button to bring the Show Me toolbar on the screen.
- Select Inventory and Sales from Measures and Date from Dimensions by pressing the Ctrl key and clicking on these fields.
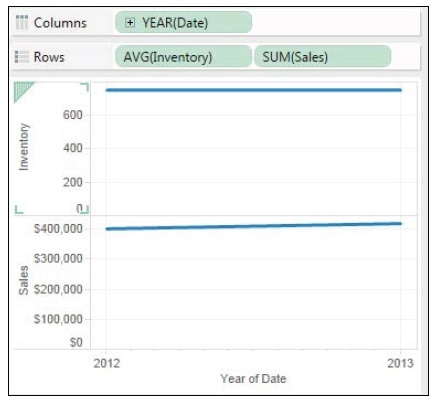
- Select the lines (continuous) chart type from the Show Me toolbar to generate a visualization as shown in the following screenshot. The following chart shows us the average inventory size and total sales for the years 2012 and 2013:
- To observe the time-series data by the quarters of a year, we need to add the Date field again. Drag-and-drop Date from Dimensions into the Columns shelf.
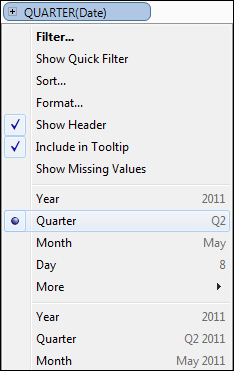
- In the Columns shelf, you'll now see two Date fields grouped by year. To show the time-series by quarter, click on the second YEAR(Date) value.
- From the drop-down menu, select the Quarter value that has the format Q1 or Q2, as shown in the following screenshot:
- You can now observe the time-series trend by the quarters of 2012 and 2013, as shown in the following screenshot:

Tableau will automatically group a date type of field by year, but it does provide various grouping options, such as quarter, month, day, weekday, and even by hour, minute, and second. To add multiple groupings, we need to add the date field multiple times and change the grouping option. This allows the user to generate data for various types of analyses that generate trends by different date combinations, thus assisting the reader to observe micro or macro trends. We saw the different time-series trends; when the data was grouped only by year, we observed that the time-series lines were almost flat. However, when we added the quarters, we observed that the average inventory went up in the third quarter of 2012 but the total sales went down in the same time period.