
Tableau 7 and above have a functionality to create filled maps using fill map marks. These marks are useful when your levels of detail (or the shape of the filled area) are limited to the US counties or county/state combinations. If you want to create custom-shaded maps using geographical boundaries, such as districts of India, you have to use the following steps. You can create such filled maps using a polygon file, which consists of latitude and longitude of various points on the boundaries or shapes of the custom region. An example of such a file is shown in the following screenshot:

We'll plot the sales figures for the Upper Peninsula (UP) and Lower Peninsula (LP) of Michigan. To do so, we'll need two files: a file that contains latitude, longitude, and boundary groupings for Michigan (mipolygon.csv) and a file that contains sales numbers for the UP and LP (misales.csv). These files are provided with the downloadable code accompanying this book. In the following steps, we will join these two files to get all the required data and use the mipolygon.csv file to form the boundaries and the misales.csv file to fill the map.
After you download and save mipolygon.csv and misales.csv locally, perform the following steps to create a map of Michigan with the UP and LP regions filled with the sales figures:
- Open a new workbook by clicking on New under the File menu.
- Click on Connect to Data to select the data file.
- Under the In a file options, click on Text File.
- Select
mipolygon.csvfrom your downloaded file's location and hit Open. - Maintain all the default options and hit OK.
- If you see a Data Connection option dialog box, select Connect live.
- While holding the Ctrl key, click on Group and Order under Measures and then right-click on Convert to Dimension. Alternatively, you can drag-and-drop these fields into the Dimensions pane.
- You'll notice that Tableau recognizes the measure lat as a geographic field as the field name matches Tableau's internal naming convention for latitude. However, the field long is not recognized. To set the geographic role, right-click on long under Measures and, under Geographic Role, select Longitude.
- Click on Data from the top menu and expand mipolygon#csv (mipolygon.csv) and click on Edit Tables, as shown in the following screenshot:

- In the Tables dialog box, click on the Add Table button.

- Select misales#csv under the Table tab.
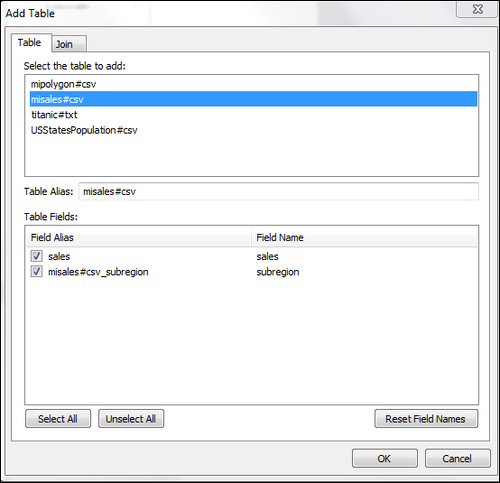
- Click on the Join tab and make sure that the Join Clause pane shows that the subregion value from the
mipolygon.csvfile is joined to the subregion option of themisales.csvfile, as shown in the following screenshot. We do so to make sure that all the records from both files where the subregions match are returned. This is called an inner join.
- Hit OK on the Edit Tables options dialog box.
- Hit OK on the Tables dialog box.
- Drag-and-drop lat under Measures into the Rows shelf.
- Drag-and-drop long under Measures into the Columns shelf.
- Expand the Marks dropdown and select Polygon.
- Drag-and-drop order from Dimensions into the Path box in the Marks pane.
- Drag-and-drop group from Dimensions into the Detail box.
- Drag-and-drop sales from Measures into the Color box.
- Click on the drop-down arrow on the SUM(sales) legend and click on Edit Colors.
- Select the Red-Blue Diverging color from the Palette dropdown and hit OK to generate a custom polygon-filled map similar to the one shown in this following screenshot:

Although we can create filled maps with Tableau 7.0 or higher, we sometimes need custom-filled maps that may not be contained in Tableau's internal data, such as regions within a state. To create such maps, we need a polygon file that has coordinates (latitude and longitude) for the area, an Order field to indicate the order of the outline of the polygon, and a grouping variable to indicate the boundaries. In this recipe, we stored two areas (north and south) and also the group field, whose coordinates fell under those two areas. You will need software such as ArcGIS to generate polygon files, which are also called shape files. Quantum GIS, an open source geographic information system, can also be used to create such a shape file. The polygon file used in this example was generated using the R language and the map_data function of the ggplot2 package. The code to generate this file is as follows:
install.packages('maps')
install.packages('ggplot2')
library(maps)
library(ggplot2)
mimap <- map_data(map = "state", region = "michigan")
write.csv(mimap, file = "mipolygon.csv", row.names = F)