
It can become difficult to manage data, particularly if you have many columns. It can become more difficult if they are similarly named too. As you'd expect, Tableau helps you to organize your data so that it is easier to navigate and keep track of everything.
From the user perspective, hierarchies improve navigation and use by allowing the users to navigate from a headline down to a detailed level. From the Tableau perspective, hierarchies are groups of columns that are arranged in increasing levels of granularity. Each deeper level of the hierarchy refers to more specific details of the data.
Some hierarchies are natural hierarchies, such as date. So, say Tableau works out that a column is a date and automatically adds in a hierarchy in this order: year, quarter, month, week, and date. You have seen this already, for example, when you dragged a date across to the Columns shelf, Tableau automatically turned the date into a year.
Some hierarchies are not always immediately visible. These hierarchies would need to be set up, and we will look at setting up a product hierarchy that straddles across different tables. This is a nice feature because it means that the hierarchy can reflect the users' understanding of the data and isn't determined only by the underlying data.
In this recipe, we will use the existing workbook that you created for this chapter.
We will use the same data. For this recipe, let's take a copy of the existing worksheet and call it Hierarchies. To do this, right-click on the Worksheet tab and select the Duplicate Sheet option. You can then rename the sheet to Hierarchies.
- Navigate to the
DimProductCategorydimension and right-click on the EnglishProductCategoryName attribute. - From the pop-up menu, select the Create Hierarchy feature. You can see its location in the following illustration:

- When you select the option, you will get a textbox entitled Create Hierarchy, which will ask you to specify the name of the hierarchy.
- We will call our hierarchy
Product Category. Once you have entered this into the textbox, click on OK.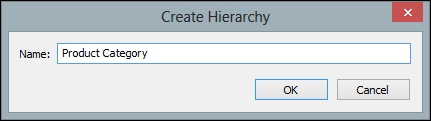
- Your hierarchy will now be created, and it will appear at the bottom of the Dimensions list on the left-hand side of Tableau's interface.
- Next, go to the DimProductSubcategory dimension and look for the EnglishProductSubCategoryName attribute. Drag it to the Product Category hierarchy under EnglishProductCategoryName, which is already part of the Product Category hierarchy.
- Now we will add the EnglishProductName attribute, which we will find under the DimProduct dimension. Drag-and-drop it under the EnglishProductSubCategoryName attribute that is already under the Product Category hierarchy. The Product Category hierarchy should now look as follows:

- The Product Category hierarchy will be easier to understand if we rename the attributes. To do this, right-click on each attribute and choose Rename. Change EnglishProductCategoryName to
Product Category. - Rename EnglishProductSubcategoryName to
Product Subcategoryby right-clicking on the attribute and selecting Rename. - Rename EnglishProductName to
Product. - Once you have done this, the hierarchy should look as follows:

- You can now use your hierarchy to change the details that you wish to see in the data visualization. Now, we will use Product Category of our data visualization rather than Dimension.
- Remove everything from the Rows shelf and drag the Product Category hierarchy to the Rows shelf. Then, click on the plus sign; it will open the hierarchy, and you will see data for the next level under Product Category, which are subcategories.
- An example of the Tableau workbook is given in the following illustration. You can see that the biggest differences occurred in the Bikes product category, and they occurred in the years 2006 and 2007 for the Mountain Bikes and Road Bikes categories.

- To summarize, we have used the Hierarchy feature in Tableau to vary the degree of analysis we see in the dashboard.
Tableau saves the additional information as part of the Tableau workbook. When you share the workbook, the hierarchies will be preserved.
The Tableau workbook would need revisions if the hierarchy is changed, or if you add in new dimensions and they need to be maintained. Therefore, they may need some additional maintenance. However, they are very useful features and worth the little extra touch they offer in order to help the dashboard user.
Dashboarding data usually involves providing "at a glance" information for team members to clearly see the issues in the data and to make actionable decisions. Often, we don't need to provide further information unless we are asked for it, and it is a very useful feature that will help us answer more detailed questions. It saves us space on the page and is a very useful dashboard feature.
Let's take the example of a business meeting where the CEO wants to know more about the biggest differences or "swings" in the sales amount by category, and then wants more details. The Tableau analyst can quickly place a hierarchy in order to answer more detailed questions if required, and this is done quite simply as described here. Hierarchies also allow us to encapsulate business rules into the dashboard. In this recipe, we used product hierarchies. We could also add in hierarchies for different calendars, for example, in order to reflect different reporting periods. This will allow the dashboard to be easily reused in order to reflect different reporting calendars, say, you want to show data according to a fiscal year or a calendar year. You could have two different hierarchies: one for fiscal and the other for the calendar year. The dashboard could contain the same measures but sliced by different calendars according to user requirements.
The hierarchies feature fits nicely with the Golden Mantra of Information Visualization, since it allows us to summarize the data and then drill down into it as the next step.