
We can provide a better perspective on data by adding external data sources. There are many applications where external data is extremely useful to the organization. For example, your marketing organization may be interested to know how your marketing campaigns impact your website, which in turn impacts your sales. Tableau is well suited to this type of analysis, and it provides a range of connectors so that you can mix external data sources together.
In an earlier chapter, we retrieved the country data from the Microsoft Windows Azure Datamarket. In this recipe, we will take a look at retrieving data from Google Analytics using the Tableau connector. Google Analytics is a tool that helps you to analyze traffic to your website, and many businesses make use of this free facility.
As in the case with the previous recipes in this chapter, we will continue to use the Chapter Four workbook.
- Let's select the Connect to Data option on the Tableau welcome page on the Tableau desktop. Select the option for Google Analytics and the Google web page will ask you for a username and password for your user account, as shown in the following screenshot:

- Once you have entered this information, you will be asked for the Google Analytics connection details. You can see an example of this feature in the next screenshot:
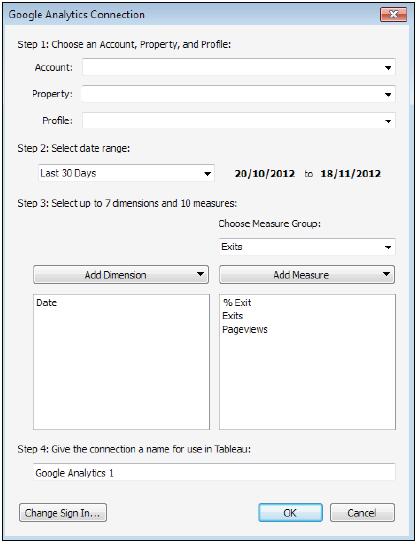
- Once you see the Google Analytics Connection dialog box, you can fill in your details, such as Account, the Property, and the Profile.
- When you click on OK, you can see the dimensions and measures in the Tableau worksheet.
- Now that you can see your data, you can combine the data by simply grouping it together, which makes it easier to analyze.
- For example, you can combine page groups in order to analyze web pages on a section-by-section basis, or even exclude certain groups from your analyses.
To summarize, mashing up your external data with your internal data can mean that you get richer results and analyses from the data. This means that your dashboards are essential tools for helping to drive decisions and insight throughout your organization, and your colleagues will thank you for it!