
By having access to a lot of data that you've never seen before, it is easy to get excited and engrossed in loading data and pushing it around. Tableau is a great tech toy, and people enjoy playing with data.
If you are seeing lots of new data for the first time, how can you make sure that Tableau is interacting as quickly as possible with the data? People want to interact with data, and Tableau helps people to explore their data quickly. Nothing, however, puts business users off a new system more than poor response times. People want their data, and they want it now.
Evaluating a system often involves questions such as response time, data-load time, and utilization. However, it can often be difficult to work out the quickest way to access data. The best way is to test, but this recipe will offer some different ways in which you can get a head start in optimizing data.
This recipe isn't intended to suggest that Tableau is slow to access data; in fact, it is extremely fast. In today's world of ever-increasing data sources, it can be hard to work out the best way to access data quickly. It is important to make the right decision at the very start, so this topic is aimed at setting you on the right path.
If you have multiple data connections that are large and take a long time to query, using a join can increase query time dramatically. In this case, it is possible to consider joining the data earlier on in the process before Tableau sees it.
Tableau can help you work out the relationships within the data. For example, by visualizing the data, it can help you to see whether you need to bring data into a single platform or whether the data can live in its existing sources.
This recipe helps you to see a process for making your data as fast as possible. We prepare the data at the source. We import the aggregated data into the Tableau data source for speed.
In this example, we preaggregate the data by turning it into an average data. This means that the calculation is already done when it goes into Tableau, and Tableau does not have to spend time making the calculation; it just lifts the data as it sees it.
Importing the whole data into Tableau's own engine is often a useful strategy since Tableau does not have to connect to large data sources, query them, and then bring the data back across the network.
Ultimately, the best way is to provide the best performance for your environment and your data. The method suggested here is one way to give you a head start.
Let's continue with the Tableau workbook Chapter 6 as is.
As in the previous chapter, we will use the Hortonworks Sandbox to connect to some data and use it as a data source. Alternatively, if you don't have access to this source, you will find details of a location where you can download the sample files so that your work is not impeded.
You can download the data source file and the resulting CSV files from http://sdrv.ms/1aHDtib.
- Upload the source file to the Hortonworks Sandbox using the File Explorer to a directory called
/hue/WorldBank. You can see an example of this in the following screenshot:
- Create a table in Hive using the following command:
CREATE EXTERNAL TABLE IF NOT EXISTS HDI (
HDILevel     STRING,
CountryName     STRING,
Year           STRING,
HDIValue     FLOAT)
ROW FORMAT DELIMITED FIELDS TERMINATED BY ','
LOCATION '/user/hue/WorldBank';
The following screenshot is an example of how the query will look in the Hue web interface:

- Run the following query in the Hortonworks Hive query table. It is designed to obtain the average HDI value, which is based on the HDI level and the country.
SELECT
a.hdilevel, a.countryname, avg(a.hdivalue)
from hdi a
GROUP BY a.hdilevel, a.countryname
The Hue screen will appear as follows:

- Once you have created the table, make sure that the data has been loaded by going to the Results view of the query, as shown in the following screenshot:

- Once you have done this, you can save the file by going to Download as CSV on the right-hand side. Here is an example of this in the following screenshot:

- In case it isn't clear, there are a number of options, and you need the top one, which you can see in the following screenshot:

- Alternatively, download the file from http://sdrv.ms/1aHDtib.
- The CSV file will be downloaded with the name
query_results.csv. Rename it toHDI Average. - We will connect to the text file in Tableau. Open Tableau and create a new worksheet using the option Connect to Data, as shown in the following screenshot:

- Next, rename the connection to
HDI Average. You can see an example of this in the following screenshot:
- Click on OK and return to the Tableau worksheet.
- Let's import all of the data into Tableau's internal data store. So, in the Data Connection tab, select the option Import all data, as shown in the following screenshot:

- Tableau will then ask you where to store the data abstract as a TDE file; select a file location on your laptop that suits you best.
- When the data is imported, you will see the fields on the left-hand side. The value field may be transported with a default column name. For example, it may read c2, which is simply Tableau's placeholder name for the column during the transport. It is shorthand for column 2. In this case, right-click on it and select the Rename option. Rename it to
HDI Average Value. Here is an example of the Rename option:
HDI Average Valuewill appear as a string, so we will need to make it a measure. To do this, drag it from the Dimensions shelf down to the Measures shelf.- The field will still be in the string format, so we will need to change it to a decimal format. To do this, right-click on the field and select Change Data Type, and change the type to a number. Here is an example:

- Now, when you drag HDI Average Value over to the Rows column, you will notice that it is a count measure rather than an average measure. Tableau does this because the measure was originally a dimension that could be counted rather than summed. To change the metric from COUNT to AVG, right-click on it in the Rows shelf and select Measure(Count(Distinct)), and then select AVG. Here is an example of this setting:

- Drag countryname on to the Rows shelf so it is on the left-hand side of HDI Rank.
- Select a symbol map from the Show Me panel. You should have Longitude in the Columns shelf and Latitude in the Rows shelf.
- Drag the hdilevel column on to the Color button. This will use Color to categorize the countries in terms of their development.
- Your dashboard should now look like the following screenshot:
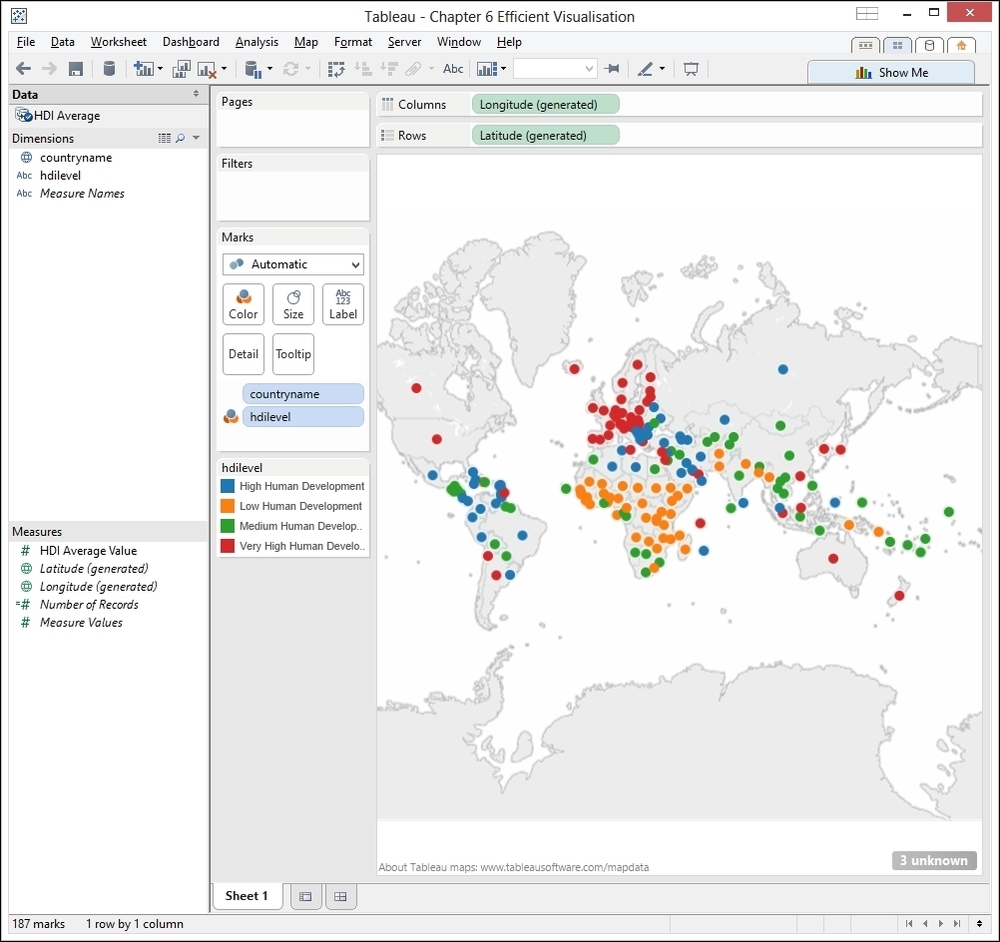
- Our data is now visualized very simply using a mix of data that was aggregated at the source, and then importing the data into Tableau's memory engine.
Tableau can connect to live data or data that is held in memory, or both. The Tableau data engine uses different levels of memory at different times, so people can explore their data more quickly. It also means that the business users are not touching the underlying data source, which means that pressure can also be relieved from the system.
A nice thing about the Tableau data engine is that we can combine data that has been held in different formats, such as SQL Server, Excel, or Teradata, and combine it together into one source. Regardless of the source of the software solution, users can connect to the data, consolidate it, and then analyze and visualize the data.
It isn't always easy to work out when to use in memory and when to use the source. Live connections are better if you have fast-moving data and a fast database since the data is changing all the time and you need a fast connection.
In memory is better where the underlying data source is slow or has a lot of user and operational pressure on it. Also, taking the data into Tableau means that you can access the data offline; for example, if you are working on a train or somewhere where you don't have good Internet access to connect to your company's data sources.
To summarize, it is good that Tableau gives us several options; we have looked at one method of connecting to data here, which combines the features of the source system as well as the fast features of Tableau.