
If you want to reduce the amount of data available for visualizations or restrict the data for a particular field value, applying filters is a very good solution. This recipe will provide a basic overview of filters, and later in the book you'll see some other uses of filters.
We will use the sample superstore sales saved data source for this exercise. Open a new worksheet and connect to the Sample – Superstore Sales (Excel) data source.
Once the sample file is loaded on the worksheet, perform the following steps to explore the Filters feature in Tableau:
- Drag-and-drop Sub-category from Dimensions into the Rows shelf.
- Then drag-and-drop Profit from Measures into the Text Marks box. You can also right-click on Profit and click on Add to Sheet. Your worksheet should look like the following screenshot:

- If we want to see the subcategories that generated profit of more than $50,000, right-click on the Text box from the Marks pane box where it says SUM(Profit), and click on Filter
- In the Filter dialog box, click on the At Least option and either drag the slide to 50,000 or type
50,000in the input box and hit OK.
- Once the filter is applied, you'll see eight subcategories that generated profit of more than $50,000.
- We can continue to filter this information further. For example, to remove Office Furnishings as a subcategory, right-click on Office Furnishings and click on Exclude. Now only seven rows of subcategories are visible.

- Both the filters will now show up in the Filters pane, as shown in the following screenshot:
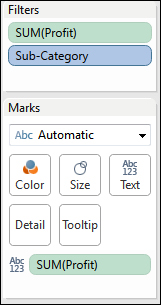
- To remove the filters, right-click on the Filters pane and select Clear Shelf.
- To change a filter, right-click on the Sub-Category filter from the Filters pane and select Filter.
- In the Filter window, you'll see tabs such as General, Wildcard, Condition, and Top.

- In the General tab, you can type or select a value from the field. In the Wildcard tab, you can enter approximate string values to match certain patterns. In the Condition tab, you can enter conditions by the Fields or Formula values. In the Top tab, you can select the top n or bottom n items by a field or using a formula.
..................Content has been hidden....................
You can't read the all page of ebook, please click here login for view all page.