
Often, our data is stored in different formats or different files. In relational databases, if two different tables have a common field, we can join these two tables with this field and pull the data in one single query. Tableau supports joins within a single data source connection; however, to merge multiple data source connections, Tableau uses a concept called data blending. In this recipe, we will look at how to blend two different data sources.
Download the following Google Spreadsheet, which contains the U.S. population by states, after signing in:
Download it as a CSV on your local hard drive and name it USStatesPopulation.csv.
Once you have downloaded the CSV file, create a new worksheet in Tableau and perform the following steps to merge the CSV file and an Excel file:
- In a new workbook, connect to the Sample – Superstore Sales (Excel) data source.
- Once the data is loaded and you can see Dimensions and Measures populated, click on Connect to Data in Data and select the text file
USStatesPopulation.csv. - Accept all the defaults in the Text File Connection dialog box and hit OK.
- Choose the Connect Live option in the next dialog box.
- Tableau will match field names, and if it finds the same field names in both the data sources, it will create relationships between those common fields. To manually create relationships, click on Data and select Edit Relationships.
- In the Relationships dialog box, select Sample – Superstore Sales (Excel) as the Primary data source. Tableau will make
USStatesPopulation.csva secondary data source file.
- Click on the Custom radio button and select State from the left-hand side column and State from the right-hand side column and hit OK.
- To see profit by state, drag-and-drop the State value from the Sample – Superstore Sales (Excel) data source into the Rows shelf and the Profit measure into the Text Marks box.
- Click on the USStatesPopulation#csv data source in the Data pane, and right-click on Census population_April 1, 2010 from the Measures pane and select Add to Sheet.
- As shown in the following screenshot, you should see three measure values in the Measure Values pane, Measure Names in the Columns shelf and Census population_April 1, 2010 and Profit in the datasheet:
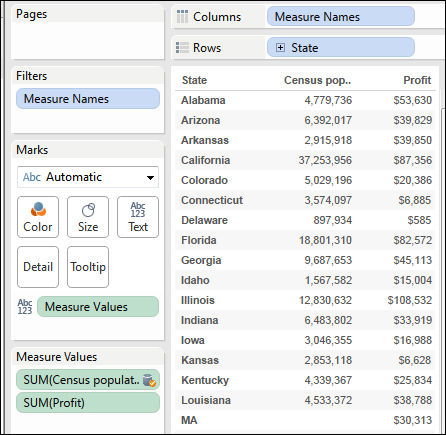
Tableau can merge two or more different data sources in the same worksheet by creating relationships among common fields of these data sources. You can customize the blending operation by specifying the common fields in the data sources in the relationships. You should also note that this blending is different from joining two tables, because when we join tables, we create row-level joins and we can add fields from both the tables. Whereas, in blending, we merely show different fields from different data sources in a single visualization.
Since the blending or merging of multiple data sources can prove challenging, it might be easier to understand this concept better by watching somebody actually do it. A YouTube user named James Wright uploaded a video of blending data at http://youtu.be/-G0lIz7y6y0.