
Let's get started with a simple project!
As always, you begin any project with a statement of the project's objectives. In this project, the objective is to use a simple text file (TripRuns.csv), which contains results from a professional driving services organization, to show how easy it is to create a simple visual analytics dashboard with IBM Watson Studio.
Now that we have our project objective stated and clearly in mind, we need to follow these step-by-step instructions:
- Click on New Project.
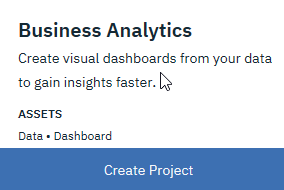
- Next, click on the Create a project page. Choose a project starter (required services are provisioned automatically. You can add other assets and services later). For this example project, we will select Business Analytics by clicking on Create Project, as shown in the following screenshot:
- Next, you need to select a region from the drop-down list where your project instance will reside (I've selected US South):

- After clicking on Select, the New project page, which is shown in the following screenshot, allows you to provide the appropriate project details before clicking on Create:

Once the project is created, we'll have a workspace where we can organize the assets that the project will use. There are many assets (data, collaborators, and analytic tools), but we need to start with the data. To load data into our project workspace, we can use either a direct database connector or simply drag and drop a file onto the landing zone (you can also browse to your file).
For our simple example, we are using a text file as our data source, so in the upper right of the project workspace page, you can click on the Find and add data icon, as shown in the following screenshot:

From there, you can click on Load and browse to locate and select the file that you want to use in the project (ours is TripRuns.csv). After the file has loaded, you then click on Files and you should see the file listed and ready to use:

Now that we have some data to work with, we can click on the menu selection Add to project, and then select Dashboard:

After you select Dashboard, you'll have to provide a name and description under Name and Description, and then click on Save:

After IBM Watson sets up the new dashboard for your project, you can customize it, starting with its general layout. You can start by selecting a preformatted template:

Once you select a template (I selected Tabbed and Freeform), you'll find yourself on the dashboard canvas (shown in the following screenshot), where we can design your dashboard:

Next, click on the + icon near Selected sources in the upper left-hand corner of the page:
![]()
After clicking the + icon, you can then select the TripRuns.csv data asset that we previously added to our project:

If you're wondering what Connections is, that is where you would define any data assets that are in the form of a direct connection to a database or other source. A connection asset contains the information that's required to create a connection to a data source. You create connections to IBM (or other) cloud services and on-premises databases.
After selecting our data asset, it should show up, as shown in the following screenshot. Now we are ready to proceed with constructing our dashboard:

When you hover over the eye icon next to a data asset, you will notice that Watson Studio gives you the option of doing a quick review of the data asset just by clicking on the eye icon. This comes in handy when working with multiple data assets, as shown in the following screenshot:

Since we are ready to proceed, we can just click on our data asset name (rather than the eye icon) and then click the button at the bottom right of the page with the caption Select. The dashboard canvas page is displayed once more. Notice that the page is split into two sections, as shown in the following screenshot:

On the right is the drawing space or canvas and on the left is the menu pane, which consists of three icons: Select sources, Visualizations, and Widgets. We have already set up our data source, so let's click on Visualizations. The visualization selector is displayed, where you can select the type of visualization that you want to use on your analytics dashboard:

To keep this example simple, we just chose Bar as the visualization type by clicking on the Bar icon. A Build your visualization template will be added to your canvas, as shown in the following screenshot:

From there, we can drag and drop columns of data into the desired visualization parameters, such as Bars and Length. Note that the required parameters are denoted by a red asterisk.
As with most Watson visualization interfaces, as you add or remove the parameter values, the visualization is updated in real time:

Once you are satisfied with your visualization, you can click the Save icon (located on the dashboard action bar) to save your dashboard. The dashboard that you have created is listed in the Dashboards section on the project's Assets page.
From the dashboard action bar, you are able to do the following tasks:
- Download the dashboard as a JSON file
- Create a permanent dashboard URL to share with others
- Undo/redo actions that have been performed on the dashboard
- Save the dashboard
- Add/remove widget connections
- Change dashboard properties, such as colors
- View your dashboard details, such as name and description, or choose an alternate Cognos Dashboard Embedded service instance if multiple services are associated with the project
- Find resources in the community, for example, useful datasets