
Before moving onto actually building a classification model, it should be noted that there are numerous nodes available on the pallet to help with or actually perform almost any operation or process that you need to perform without having to code anything!
If you take a moment to look over on the left-hand side panel (called the Nodes Palette), you'll see different types of nodes available for you to use while working on your data. These nodes are organized into the following six basic categories:
- Record operations: This can be used to perform operations such as selecting, appending, and sorting on the record (row) level.
- Field operations: These nodes are helpful in the data preparation phase. You can filter data, rename features, and choose the type of your attributes.
- Graphs: Nodes in this section will help you with basic data exploration and understanding distribution or relationship between features.
- Modeling: These nodes provide different modeling algorithms for different types of problems.
- Outputs: These nodes are helpful in understanding your data and model. You can display results in table format or get a report on evaluation parameters of your model.
- Export: After processing and modeling, this node will help you export data from the flow editor to your DSX project.
Let's try one out. They all are implemented in pretty much the same way: drag and drop the selected node on to the canvas and right-click to take further actions such as open, preview, or run.
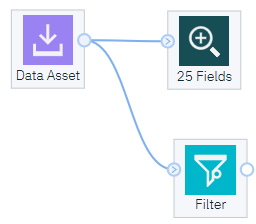
For example, let's look at the Filter node found under Field Operations. The following screenshot shows the Filter node added to the canvas and connected to our Data Asset node:
You can use the Filter node to rename columns, as shown in the following screenshot:

You can also filter out or retain only selected fields of data from your original Data Asset node:

Once you are happy with your data, you can set a variable to be the model's Target variable using the Type node. This will help the model to distinguish between input and target features. For example, you can do the following tasks:
- Drag and drop the Type node on the canvas.
- Connect the Type node to the Filter node.
- Right-click on the Type node and click on Open to open the node.
- Click on Read Values, then select the column name class and change the role of the variable to Target, and finally click on Save:

- To see what the distribution of the Target variable (ours is set to class) is, you can use the Distribution node (from the Graphs section of the node palette). Again, just drag the node onto the canvas and open and provide information such as Plot (select the class field under Field (discrete)) and under Color (discrete) (use class) and click on Save. After you run the flow, the output looks like this:

In this data, we see that there are more cronic cases (ckd) than non-cronic cases (notckd). This is our current flow displayed on the canvas:
