
The Think Phase—Create a Flexible Plan
Plans are worthless, but planning is everything.
—Dwight Eisenhower
In this second chapter about the Think phase, you’ll learn a smart way to identify which improvement opportunities you should begin with in the next iteration. It looks at questions such as: Which improvements will have the most impact? Which costs the greatest effort? How do you make the efforts and results measurable? And how do we plan for all this?
11.1 Prioritizing Improvements
For organizations already comfortable working with agile management, the Think phase is usually short. Then the results of the Do and Learn phases usually give a very clear picture of what the next logical step is in a new iteration of the Think–Do–Learn cycle. During these phases, all the ideas for improvements are already on the existing to-do list. The Think phase is all about getting your priorities right. Moreover, as you already saw in section 3.1, markets are showing increased levels of VUCA: Volatility, Uncertainty, Complexity, and Ambiguity. This brings the organization’s planning horizon much nearer, with the result that the effectiveness of developing large plans continues to decline, especially for the medium and long term. More and more organizations, therefore, choose to work on ideas and projects they can realize in the short term. Such programs can be adapted faster when new insights are available. Emphasis here is on the Do phase.
Look at Impact and Effort
In Chapter 10, you read how, in the first part of the Think phase, you identify what opportunities for improvement exist. Unfortunately, though, resources such as time and money are scarce. You simply cannot do everything you want, and that’s why you must constantly make choices regarding the activities that you will and will not perform. To make these choices, you first find out what the improvements will deliver and at what cost. Basically, you’re going to prioritize based on the impact and the effort of each activity. It is best to work this out on a wall, whiteboard, or brown paper, using a two-by-two matrix with an axis of high/low impact versus an axis of high/low-effort (see Figure 11.1).

Figure 11.1 The impact–effort matrix
As Figure 11.1 shows, you can plot your improvements on the matrix. This can be done globally, while the S/M/L/XL classification makes further refinement possible. Improvements in the top left quadrant have the highest priority, then those in the bottom left quadrant, and then the top right. The improvements in the bottom right quadrant, you can forget, unless you really have nothing else to do. The question now is the actual meaning of impact and effort. This is entirely dependent on your specific situation, and so you must formulate your own criteria.
From an internal perspective, a major impact might be to reduce waste (see section 10.2), which will produce cost savings. Another might be internal customer satisfaction. From an external perspective, for governments or nonprofit organizations, it concerns customer satisfaction of the external customers. This customer satisfaction is determined by both the expectations and the perceived experience of the customer, regarding the products, services, and channels. Consider, for example, the speed and quality of information, the usefulness of information, or the quality of a product (the SERVQUAL model is a useful tool here1; try Googling it).
For external customers of commercial organizations, it is about the impact, besides customer satisfaction, on value to the customer and the customer value: the amount of value you create for a client and, as a result, how much you can earn from him as long as this customer stays with you (Figure 11.2 presents this as a useful tree diagram). Customer value also includes cost savings. Incidentally, customer satisfaction has a strong influence on customer value, in particular the duration of the customer relationship, and the contribution to margin contained within that. Satisfied customers generally stay longer and spend more.2
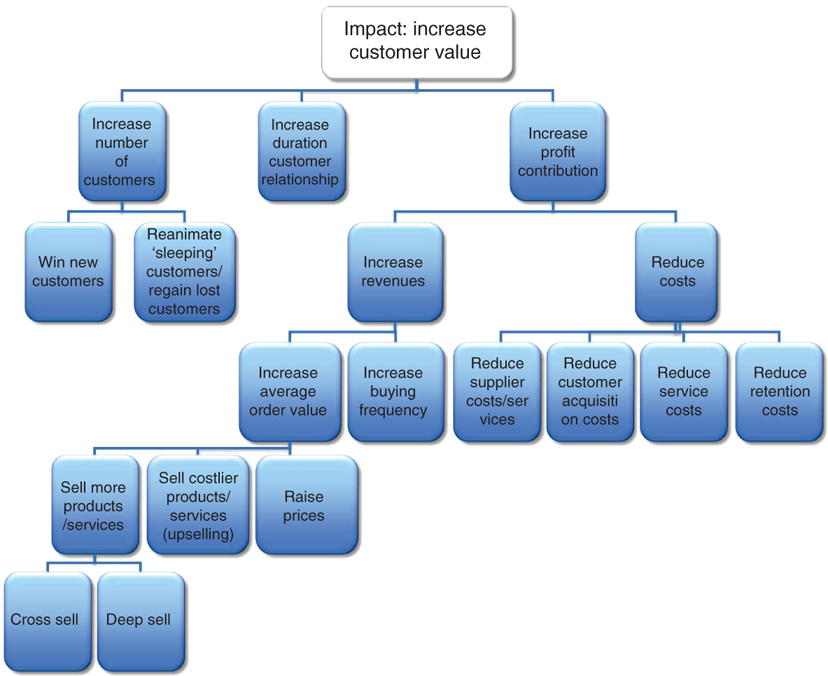
Figure 11.2 The impact on customer value can be seen on many different aspects
Besides the impact, of course, there was the effort. Effort breaks down into issues such as:
- investments and costs;
- time use;
- lead time;
- systems use;
- opportunity costs (the revenue lost by not using your scarce resources for the best possible alternative activity);
- risks.
Now that your improvements are prioritized based on impact and effort, you can write each improvement on a Post-It and stick them, one under the other, in order of priority, on your brown paper. You’ve just made your first visual list, your first product backlog. Congratulations. According to Lean’s pull principle, the team can now take the improvements on the list, one after the other, and get to work on them (once selected, an improvement jumps across to another prioritized list, the sprint backlog). The higher an item is on the list, the closer the moment when this will be executed, and so the more detailed the content definition should be. Why this is so, is covered in the following section.
11.2 A New Way of Planning
Within agile management, planning means, more than anything else, prioritizing, and time-boxing is a very important aspect of prioritizing. This means that, in practice, meetings and projects always end when the allocated time is up. That forces everyone to separate the wheat from the chaff and get right away to the core tasks. If the duration and frequency of discussions and projects are always the same, it makes planning easier and takes less time. This lets you deal with what really matters: the meaningful work.
Agile management teams work in a fixed iteration rhythm (the “heartbeat”). That is, they always use the same fixed periods to complete their operations from start to finish. The length of this period must be short in order to keep the speed high and to force the teams to make their projects as small as possible. In general, this period is somewhere between one and four weeks, where three weeks is the most-common duration. The period needs to be shorter if the environment is very complex, if there is a lot of dynamics and incidents, if there is much to be adjusted, or if the team is inexperienced. You call this period a sprint. The idea of a sprint is that the team focuses entirely, during the sprint, on the team-chosen activity and nothing else. You are unlikely to ask Usain Bolt for his autograph when he is adjusting his starting blocks for the Olympic 100 meters final.
In a sprint, there is a maximum amount of work the team can do. This capacity is also called the velocity. At the beginning of each new iteration, the teams must determine what improvements they can and want to take on in the coming period. The can is then determined by the velocity. The want has to do with which improvements are at the top of the product backlog and how much time these activities will cost. But how do you determine the time needed?
The “Story”: What Are You Going to Do for the Customer?
The rough time-estimates you made for the effort should therefore be refined, but still not very precise (not, for example like PRINCE2, in which you can graduate via a Gantt chart). That just takes too much time. Above all, plans must be flexible enough to change in response to unforeseen events during their lifetime. To estimate the time required for each improvement, agile management uses a methodology called the user story, usually shortened to simply story. In a story, the team describes, in the simplest possible way, what they want to do and what this will deliver to the customer. As a guideline, you could say that a child or an elderly person should be able to easily understand your stories. If you cannot explain it simply, you don’t understand it well enough yourself.
Stories are usually structured like this:
as [type of client] I want [to do something] so that I [get a certain benefit]
Here are some examples of stories to follow to give you a better picture:
- As a potential buyer on eBay, I want to see the feedback from other buyers, so that I can judge the quality of the seller.
- As a train traveler, I want to hear directly why the train has stopped and how long it will take to get to my destination, so I can know if I’m going to make my connection.
- As a warehouse worker, I want to be able to directly re-order a product when I see that stock is too low, so I do not always have to walk back to my desk and computer.
The story should deliver a so-called shippable increment, that means a product or service in a condition fit to be offered to your internal or external client. If a story has a larger scope (and therefore cannot be realized in one sprint) or multiple stories are interdependent, you speak of an epic.
The Definition of Done and Working with Points
When the team has “written” the story, the following question still must be answered: When do we agree, together, that it is finished, ready? This is what we know as the Definition of Done. In order to maintain high quality, it describes when the result is acceptable for the client (the Product Owner). Consider criteria such as: How will a concrete end-result look? Exactly what is it and what isn’t it? Has it been tested? Is it already working or still to be implemented? Do we already have customer feedback? Is it documented? And so on.
Finally, it remains to be determined how long it will take to achieve the story. Have you ever remodeled your house? Chances are you found out that it was difficult to determine, in advance, the required activities and the time each needed. That’s because people are not very good at estimating absolute units of something. But fortunately, we are good at estimating relative stuff: a Great Dane is heavier than a Chihuahua. A useful way to estimate the time needed for a story, is to work with a Points system, where you are limited to choosing from 1, 2, 3, 5, 8, 13, and 21 points (maybe you recognize the famous Fibonacci sequence). The smallest story gets 1 point and the biggest 21 points. For this to be really useful, it is important that you use this consistently over a long period. In the beginning, it is difficult to assess, and for the team to know, how many Points it can handle in one sprint (the velocity), but one should be confident that the team will discover this for themselves very quickly. Incidentally, if a story gets more than 21 Points, it should simply be cut up into smaller stories, becoming an epic.
Meetings
Meetings in agile management should have, as much as possible, the style of a workshop and should be aiming for a specific end-result. Two types of meetings are fundamental to working with agile management, and both should be as short as possible. The first is the planning meeting, which occurs at the beginning of a new sprint. As a rule of thumb, you can say a planning meeting will take up one hour per week. So in a three-week sprint, there will be three hours of planning meetings. In advance, the Product Owner must ensure that the stories on the product backlog have been prioritized. During the Planning Meeting, and in consultation with the Product Owner, the team agrees the Definition of Done for the stories at the top of the Product Backlog. On this basis, the team awards points to these stories. It pulls stories out of the Product Backlog and awards them points, until the sprint is full. The team then determines the activities required by the story and assigns them to the team members. Finally, the team members and the team leader commit to all the agreements they have just made together.
The second type of meeting is the Daily Standup (this is also called the Scrum and takes its name from the sport of rugby). As the name suggests, this meeting takes place daily at the start of the working day. Moreover, members stand during the meeting, to maintain high energy levels. It may take not more than fifteen minutes. Each team member answers three short questions:
- What have you done since the last Standup?
- What are you going to do next?
- Do you need help with something (for example, troubleshooting or removing impediments)?
This way, everyone is quickly informed of the status of each other’s work and any issues are resolved quickly. Where necessary, the planning can be adjusted immediately.
Some agile managers use a third type of meeting, called either a huddle meeting or sync meeting. This is intended to balance coordination between different teams and so avoid things being done wrong or done twice, or not done. See Figure 11.3 for an overview of these meetings and others we discuss later.
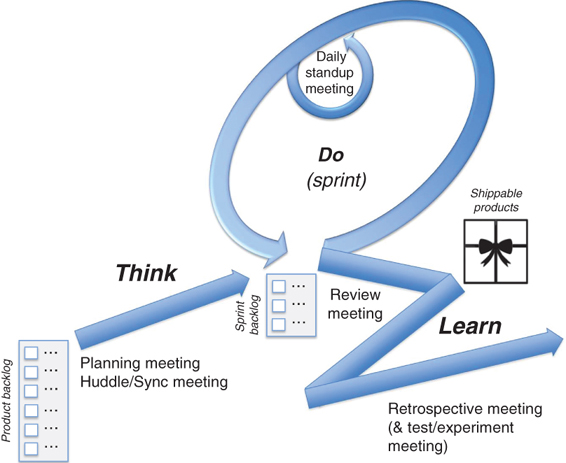
Figure 11.3 The meeting structure around sprints mainly uses Scrum methodologies
Visualizing the Plan: Working with a Kanban
In Chapter 10, you read that we work visually and in workshop format as much as possible in agile management. This means lots of sketches, cutting and pasting using brown paper, whiteboards, Post-its, and marker pens. Visual working applies to planning also: and here we use a board called a Kanban. It allows the team members to see at a glance the planning and current status. As Figure 11.4 shows, on the left is a hierarchical list of all the current sprint stories. Each story will have its own horizontal path, which contains all the activities required for realization of the story. These activities change status during the sprint. The first status is To do. Once execution of an activity begins, it moves one column to the right and gets the status Doing. When the activity is completed, it moves to Done. This format can always be refined to meet the specific needs of the team. For example, by breaking-down the Doing phase into design, construction, review, and test phases.

Figure 11.4 A Kanban makes planning visual
Planning discussions always happen with visual support. This ensures the team quickly gets a grip on the schedule. Planning meetings and Daily standups, therefore, also take place in front of the Kanban. And for the huddle/sync of Product Owners an effort/impact-wall and/or a portfolio-wall is often used, on which the Themes (a cohesive group of ideas aimed at achieving a certain strategic target) and Epics are pasted. Thus, it becomes clear where the potential overlaps and blind spots are, and a rough schedule for the medium to long term can be made.
No matter how objective you try to determine the impact and effort of improvements, there will always be a certain degree of subjectivity involved. In order to limit this in the future, as much as possible, it is useful to check what you thought would happen against what actually did happen. So you can learn from what you do and get better at the implementation of the Think phase. Therefore, it is necessary to measure your efforts and results, and this starts with formulating hypotheses. The next section tells you how you go about this.
11.3 Working with Hypotheses and Metrics
Just like the scientific method, agile management works with hypotheses. Obviously, you are not going to invest time and money in an “improvement” unless you expect it to yield a particular result; its impact, as discussed in section 11.1. For example, you hope to increase customer satisfaction, or to achieve higher conversion rates. And as Lord Kelvin said: “If you cannot measure it, you cannot improve it.”
A hypothesis is a specific statement about your expectations; it makes your assumptions explicit. That statement must be SMART-formulated to make it testable. After the experiment, you should be able to confirm or refute the hypothesis, what we call verification and falsification. By doing exactly this, you learn from your efforts. You discover what does and does not work; to measure is to know. How do you test a hypothesis? See Chapter 12.
A hypothesis is always formulated as a statement, which may only be proven true or false. Thus, it is black or it is white; it cannot be gray. Some examples:
- Replacing the paper form with a digital form must immediately reduce the duration of the application process by at least 2 days.
- By working with another parts supplier, we save at least $10,000 in the first month.
- Providing a customer with a dedicated contact-person will lead to an increase in customer satisfaction of at least 10 percent within one month.
- By adding said functionality to the site, customer churn will decline by 10 percent within one month.
- The new packaging color will result in a revenue increase of at least 10 percent in the first month.
- A 10 percent price cut will bring at least 1,000 new customers within one month.
- Discontinuing this specific service will not lead to complaints.
As you can see, the hypotheses revolve around certain key performance indicators (KPIs), such as customer satisfaction and customer churn. These KPIs are used to make your hypotheses testable; they form the basis for measurements (also known as metrics). When choosing your KPIs, you should think carefully about the distinction between lagging and leading indicators. Simply put, this means that one is a consequence of the other. Let’s clarify this with a simple example: if someone is trying to lose weight, they will regularly stand on their scales to check their weight. This lagging indicator is easy to measure, but difficult to influence. What matters is the amount of calories consumed and burned. These Leading indicators are exactly the opposite: they are easy to influence, but difficult to measure.
Looking for relevant KPIs? Go to mikehoogveld.com for a list of the 50 most-commonly used KPIs and the associated explanation on how to use these in your hypotheses. When you finish formulating your hypotheses, you have also completed the Think phase and are ready to get started with the Do phase. Read more about this in Chapter 12.
By reading Chapter 11, you’ll have learned the following:
• Planning is also part of the Think phase. Within agile management, planning must proceed quickly and flexibly so that you can focus fully on the content of the Do phase. Therefore, you work with time-boxing and a fixed rhythm, as in a sprint.
• The first step is to globally-prioritize your inventory of improvement opportunities. You can do that with the impact/effort-matrix.
• Next you refine this by translating the improvements into stories and assign them points for the amount of work each requires. Then you decide which stories can be realized in the next sprint.
• During the Planning Meeting, Daily Standups, and Huddle/Sync meeting, planning is discussed visually. You use tools such as the impact/effort-matrix, Kanban, and portfolio walls.
• To learn from your efforts and their results, it is useful to work with assumptions and KPIs.
References
1. Parasuraman, A., V. Zeithaml and L. L. Berry. (1988). “SERVQUAL: A Multiple-Item Scale for Measuring Consumer Perceptions of Service Quality.” Journal of Retailing 64–61, pp. 12–40.
2. Reichheld, F. F. (2003). The One Number You Need to Grow. Brighton: Harvard Business Review.