
Salesforce provides us with some good tools to create reports and graphical charts. We can create reports and charts using a simple point-and-click tools.
By the end of this chapter, we should be able to:
- Identify which report type is suitable for business needs
- Create custom reports
- Create graphical dashboards
- Schedule a dashboard for automatic refresh
- Set up an analytical snapshot
The most important function of an enterprise-level application such as CRM is how it displays the reports. As the application performs a large amount of data operations and manipulations, performing analytics and creating visual graphs from the data is very important. Reports and analytics are two one of the most powerful tools given by Salesforce.com.
In this chapter we are going to look at some of the most important aspects of analytics provided by Force.com. We have loaded all the necessary data to generate a report in the last chapter. Now let's start building one.
A report is a textual work (usually of writing, speech, television, or film) made with the specific intention of relaying information or recounting certain events in a widely presentable form.
In simple terms reports are tabular representations of large amounts of data. They can be conditional reporting, for example, a report of all the books purchased in the last quarter or a future forecast or report on the number of books that will be returned by members in the next week or the collection of the entire data, and a report on the number of books in the library.
Salesforce provides us with standard reports for the different sets of data of standard objects by default, which is available under the Reports tabs as shown in the screenshot below.

We can also create custom reports on the standard and custom objects for our application. There are three types of custom reports. Let us look at each one of them in detail.
- Tabular reports: Tabular reports are similar to a spreadsheet; they consist simply of an ordered set of fields in columns, with each matching record listed in a row. These types of report populate tabular data without subtotals or aggregation of any column. They are good for representing detailed data of objects for auditing purposes. They can't be used to create groups of data or charts, and can't be used in dashboards unless rows are limited. Examples of tabular reports are library blacklisted members lists, media inventory reports andso on.
- Summary: This type of report allows the user to group rows of data, view subtotals, and create charts. They can be used as the source report for dashboard components. This type of report can be used to show subtotals based on particular fields. For example, a report of available movies in the library categorized by their release date, and a report of available books categorized by their uthors.
- Matrix: Matrix reports allows the user to group and summarize data by both rows and columns. They can be used as the source report for dashboard components. This type of report is used for comparing related totals, especially if there are large amounts of data to summarize and you need to compare values in several different fields, or you want to look at data by date and by product, person, or geography. For example, a report of the available movies in libraries categorized by movie director and release date.
The report builder is the quick and painless way of creating amazing custom reports. To avoid confusion let us quickly see a flow chart for the activities we will be doing to generate the report.
The process of creating a report is summarized as shown in the following image:

Let us create a report following every step from the flow chart in detail:
- To create a report, first go to the Reports tab. If the tab is not available on your application click on the + on the tab and select reports.
- Click on Create New Custom Report on the tab as shown in the following screenshot:
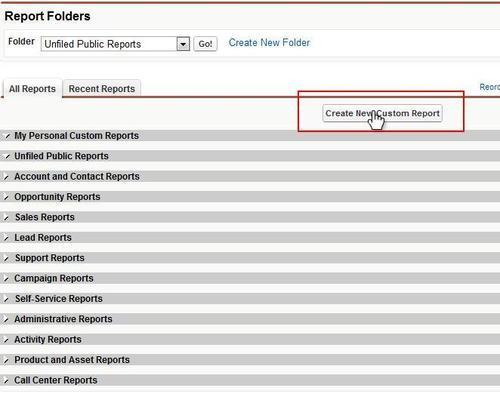
- Select the data object and the report type and click on Create. On clicking Create it will launch the report builder. The report types are generated based on the relationships of the object with other objects. We can also define a custom relationship and create reports on completely different objects. We will study how to create custom report types in the next section.

The report builder is the easiest way to generate a report. The report builder provides us with different sets of options for different types of custom reports.
The following is the report builder interface for a tabular report. As seen in the preceding flow chart, most of the steps in all three types are similar. Matrix and Summary reports have additional steps that we will discuss later.

The report builder is shown in the preceding screenshot. The most important features of the report builder are marked in numbers. Let us see what each number corresponds to:
- This option lets you choose the type of report to build. The options as discussed before are Tabular, Summary, and Matrix.
- The list of all the fields on the object is displayed in the panel on the left. We can drag-and-drop any field as the column on the main panel, marked by 3. Additional filters to select the columns are given on the top of the left panel. They include, display all columns, display only text, display only numeric and show only date fields. The column filters help in choosing the fields.
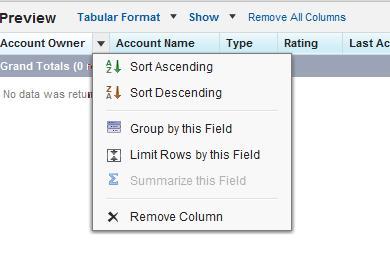
- The fields are dragged as the column on the main stage. Once the fields are brought on the stage we can set them to sort according to the field as shown in the following screenshot:
- We can set additional filters for data to get specific reports as shown in the following screenshot:

Field filters let us choose the data according to the field, for example, the account name begins with XYZ or the account city is San Francisco. We can also limit the rows based on the field, for example, top five high revenue generated accounts or five members with maximum number of dues in the library.
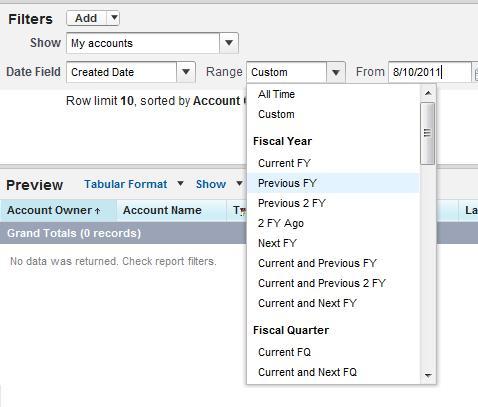
The reports can be drilled down based on the data as shown in the figure, for example, generating a report for all the accounts in current fiscal year and so on.
There are additional steps for matrix and summary reports as shown in the next screenshot. These options are seen only when we select matrix and summary in the report type. The following screenshot is for the matrix report type:
The additional options provided during the matrix and summary report are as follows:
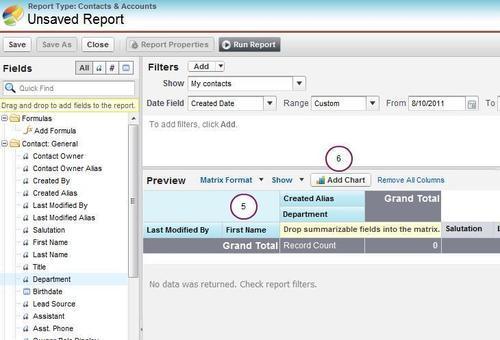
- Select the field to group by for rows and columns. For a summary report only one option is seen on the main page to group by rows. The fields are dragged in the place holders to group by the fields.
- The add chart option the chart option helps us add a custom chart to the report. We can also create the chart while creating the dashboard. When we click on add chart, it gives us additional options to choose the chart type and its value as shown in the following screenshot:

We will look at the option for creating charts in detail while creating the dashboard. After we enter all the values all we do is click on run report and watch it fetch data.
When we preview the report in the report builder, only subsets of values are used.
Once the report is generated, we get the following options.

The reports, once generated, give us the following options. The numbers correspond to the numbers on the previous screenshot:
- Changing the time frame. We have already set a filter for generating reports, the time frame can also be changed from this block once the report is generated.
- The report can be exported offline to other spread sheet applications using this option.
- The report is generated as a plain text output using the printable view.
- The report can be saved as a copy using the Save As option.
- Customize opens the report builder again.
- Run Report lets us recalculate the report based on new data. This is useful ifdata is time dependent.
Not only can we run the reports on the browser, we can also schedule it to run at a specific time and e-mail particular reports on time. This way we can fetch the data such as end of the day sales reports and so on, without manual intervention.
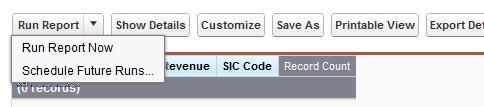
To schedule a report, first follow the entire step and generate a report. On the report page as shown in the next screenshot select the arrow beside the run report. In the drop-down select the Schedule Future Runs… option.
If the report is not saved it will open the save report dialogue box. Save it and continue. If the report is saved it will open the next page as seen in the following screenshot:
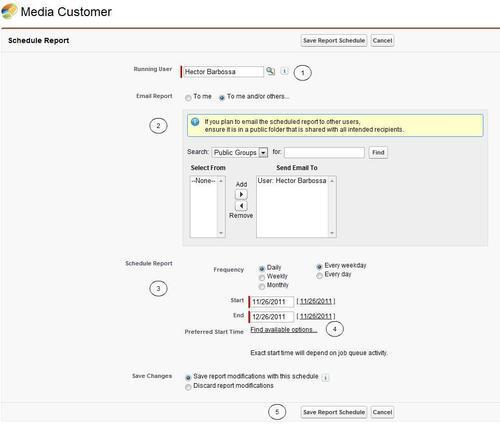
Let us look in detail at the numbers markedon the screenshot above:
- Select the user perspective on which the report will be run. The report will be filtered based on the data access to this user. If the user is at the top of the hierarchy and the recipients are below him in the hierarchy, they can view the data not accessible to them. Hence, we have to exercise caution when selecting the user so that we don't provide unauthorized access.
- Select the appropriate users to e-mail this report to. If more than one user is in the delivery list or it is sent to a public group we need to save this report in the public folder where all the recipients will have access to it.
- Select the date and schedule for the report.
- Find the available options for the appropriate time. The time depends on other scheduled reports queued by other users. The exact time is also determined by the availability of bulk queues.
- Save the schedule report.
The report will run at the specified time and we will receive an e-mal containing the report.
The Custom report type defines the set of records and fields available to a report based on the relationships between a primary object and its related objects. Reports display only records that meet the criteria defined in the report type. Salesforce provides the administrators or users with manage custom report types to create custom report types such as standard report types.
Users can create a report based on a custom report type once it is created.
To setup a custom report type:
- Navigate to Setup | App Setup | Create | Report Types and click on new Custom Report Type.
- Define a custom report type by name, description, primary object, development status, and the category to store it in as shown in the following screenshot and click on Next.

- Choose the objects for the custom report type. The objects are available based on the primary object's relationships to other objects. Only the objects with a lookup or master-child relationship with the primary object are seen in the list. Save the relationship.

- On the custom report type page layout related list click on the Edit Layout button as shown in the following screenshot:

- On the edit layout we can specify which standard and custom fields a report can display when created or run from the custom report type. Once added select Preview Layout to check if the correct fields are added.

The custom record type will be available in the report type while creating reports.
The general library needs to get an inventory check of all the media items available presently in the library and are scheduled to be returned by the end of the week. The availability of the item is determined by a checkbox check-out on the media object. The report should be grouped by the type of the media item (books or movies). Generate the report for the same.
We have already seen how to create a report in the previous section. Refer to the section on report builder to create a report.
The librarian would like the report generated at the end of every working day and e-mailed to her. Please schedule the report prepared in the previous exercise to be e-mailed every day at 5 p.m.