
Chapter 16

Visualization of Historic Landscapes
A graduate of the Copperstown Graduate Program in museum studies, Patrick Reynolds has over 15 years of experience in working with museums and historic sites. He came to SketchUp in 2007 as a tool for use in exhibit design, education, and preservation of historic sites.
Project: Modeling of the vanished town of Byng Inlet
Tools: SketchUp 7, Google Earth, historic maps, photographs
This project was started by a simple connection made through the Internet. A resident of a remote town in Ontario posted the following note on the Google SketchUp Help Discussion Group: “Hey Folks, I am interested in recreating a northern Ontario lumbering town inside a computer using various source materials. Can SketchUp do this?” I responded volunteering my time for the project so that the “kids living there can see what the town looked like.” After a series of e-mails and trawling the Internet for historic photographs and maps, we indeed proved that SketchUp “can do this.” In fact, it is the built-in tools of SketchUp that make it ideally suited to this task.
The project was a volunteer project as a prototype for future projects. The total time taken by the project was approximately 120 hours including research and modeling. The final output is a georeferenced model for private viewing in Google Earth and SketchUp.
Project Context
Historians and educators frequently encounter puzzles from the past. Vanished historic landscapes are often full of mystery and intrigue. Although two-dimensional photographs and maps can provide insight and understanding, they lack a layer of realism that a three-dimensional model can provide. This project uses SketchUp to push and pull the flat remnants of the past into a three-dimensional, “living” model that can be used to analyze photographs and provide insight into what life in this remote village of Byng Inlet must have once been like.
Historic Byng Inlet, located in Perry Sound, Ontario, was once a thriving industrial town. The complex at Byng was at one time the second largest sawmill in Canada, which employed several hundred workers while the town’s overall population was only 4200. At its peak, the village included a school, church, general store, railroad depot, hotel, and even a modest movie theatre. Today, the site is mostly abandoned, home to just a few families, and is primarily an area widely known for sport fishing.
The Graves & Bigwood sawmill was built and completed by 1902. The mill and its facilities covered over 1 square mile with a large lumber yard, green lumber yard, planing mill, 11 wood-fired boilers for generating steam power, and dock slips and a box factory close by. A massive mill fire that occurred on May 20, 1912, saw losses in excess of over 55 million feet of lumber. The Graves & Bigwood Company mill was rebuilt. In 1927, after the nearby sources of lumber were depleted, the mill was closed down. Without any other form of industry to keep the population employed, most of the people left the area.1
This project took place entirely “in the cloud” of the Internet. There was a small but substantial collection of photographs of Byng Inlet. You may notice that the quality of some of the images used throughout the project is poor. This is due to two factors: They are old photographs and do not have the resolution we expect today from digital cameras. Second, the images were optimized for Web delivery and viewing; although such low-resolution images are a detriment to viewing in printed form, they are ideal for use inside SketchUp models.
Technical Aspects
SketchUp was used for the project because numerous built-in features of this tool made the assembling of various parts of the re-creation quite easy. Terrain data (TIN) was imported into SketchUp from Google Earth. The built-in ability of SketchUp to import and scale images as textures allowed maps to be imported at scale; finally, photographs were used to enhance the buildings in the model using historic photographs that were brought to life via the integrated Match Photo tools. Most of the modeling was done with the native SketchUp tools.
New Approaches
SketchUp has quite a large user base in the field of architecture; but its use in modeling historic sites has only begun to be exploited. The ability to match photographs and use the program for what I call “poor man’s” photogrammetry makes SketchUp a very useful tool for pulling historic photographs into a three-dimensional model. This is a very powerful tool native to SketchUp and is frequently underutilized as it is used for little else other than for creating very simple Match Photo buildings for Google Earth. As detailed in this chapter, this feature can be used for many other advanced applications.
Step 1: First Attempts via Match Photo
Goal: To provide preliminary explorations of modeling.
Input: One historic photo of the mill.
Tools: SketchUp Match Photo.
Photogrammetry is a term used by cartographers, archaeologists, and architects. It refers to a process in which geometric properties of objects are determined from photographic images. There are currently many high-end software packages that make photogrammetric calculations using very complex formulas based on optics and projective geometry. Although these programs have a very high degree of accuracy, they are often expensive and difficult for a layman to use.
The Match Photo feature of SketchUp allows even a novice user to create reasonably accurate three-dimensional models from photographs. In the case of historic photographs, one has to make a few inferences about scale and proportions to get the model as accurate as possible. Before beginning the modeling process, it is advised that you become acquainted with the architecture of the concerned area and era.
The photo matching process is rather straightforward. First, the image is brought into a blank workspace using the Camera > Match New Photo menu items (See Figure 16.1). As shown in this example, the reference photo should provide a three-quarters view of the building. The Match Photo interface can be a bit overwhelming at first, but there are three steps that can simplify the visual confusion:
1 Set the origin to the corner of the building by dragging the yellow square to the corner of the building.
2. Using the green and red alignment guides, align the guides to two perpendicular faces on the building. In this example, I used window frames. Care should be taken to accurately position the guides. Zooming in with the scroll wheel can help to increase accuracy. Avoid using the ground plane, which is frequently off-axis.
3. Finally, scale the drawing. In the case of historical photographs, you may need to use some common sense and logic to make an educated guess on the scale. Scaling is done by dragging the blue axis up and down or by typing a value in the Match Photo Spacing dialog box.
Once the axis and scale are set for use in Match Photo, the basic cubic form of the building can be modeled with the L using the red, green, and blue axes for proper alignment. Right-clicking on the faces of the building will allow you to Project Photo to each applicable surface. Once the photo is applied as a texture, the size of the building can be adjusted and the gable of the roof can be drawn.

FIG 16.1
Step 2: Combining the Model with Historical Maps
Goal: To integrate scaled map and model into Google Earth terrain.
Inputs: Photograph-textured building and 1899 insurance map.
Tool: SketchUp.
The seamless integration of SketchUp and Google Earth allows you to quickly and easily geolocate and import terrain data for models. With contemporary buildings, it is quite easy to locate the building site in Google Earth, zoom-in to a convenient scale, import the data, and fine-tune the location of the building to match the Google Earth imagery.
In the case of Byng Inlet, the Google Earth imagery did not show where the historic buildings were located. Further research and intermediary steps were required to locate the photo-matched buildings. A lengthy search of the Internet succeeded in locating an 1899 insurance map of the area, compiled by Charles Goad; this map showed the mill and the immediate vicinity and was used for insurance evaluation at the turn of the century. This type of insurance map is fairly common for towns and cities of even small sizes. They were created to assist fire insurance companies in assessing the risk associated with insuring a particular property.
The insurance map was brought into SketchUp and carefully “stitched together” to overcome the overlap caused by scanning the originals in book form. Once combined, they were grouped, and then scaled to the correct size using the Tape measure tool. In this example, the scale was set as 50 feet to the inch.
Scaling the map accurately is a very important step in assembling a map to Google Earth terrain.
Most maps have an illustrated scale. Place the Tape measure tool on the scale, drag it to the appropriate increment on the map, and then immediately type in the increment of the scale (in this case, 50 feet). You will then be asked if you want to resize the model. If “Yes” is your answer, you can scale the entire model proportionately.
Once the map was scaled, the model buildings were placed onto the map. They, in turn, were scaled to the map using the Tape measure. The groups bounding box was grabbed by the corner while simultaneously holding down the Shift key to ensure that it is uniformly scaled. The resultant model is a scaled photo-textured model on a scaled map. This does indicate progress, but a village is yet to be re-created. Further research and modeling is required to bring it to life.
Tip
Scaling with the Tape measure tool is the fastest way to rescale an entire model, and it scales all dimensions equally. This can be accomplished with the Scale tool; but difficulty arises when trying to scale all X, Y, and Z dimensions equally.
Step 3: Combining the Model with Georeferenced Terrain Data
Goal: Integration of model into Google Earth.
Inputs: Photo-textured building and Google Earth terrain.
Tools: SketchUp, Google Earth.
In this example of re-creating the historic Byng Inlet village, the terrain data obtained from Google Earth did not contain any matching visual clues – the historic buildings are mostly gone. The steps below (Figures 16.2a and 16.2b) illustrate how the use of historic maps as an intermediary step will allow you to accurately scale and locate your model.

FIG 16.2a
With the model opened in SketchUp, it is now necessary to locate the terrain in Google Earth. Zoom close to the landscape and center it in the Google Earth window. To ensure that the Google Earth terrain is properly oriented, make sure to hit N. This will orient the tool toward north and set your view perpendicular to the surface.
In SketchUp, toggle the Google toolbar from the View menu, and select the Google Toolbar to make it visible. Next, select Get Current View. The program will automatically import the terrain and landscape portraits into your model as groups. A careful study of the map and landscape will give clues regarding proper orientation and alignment. You may encounter variations in alignment. Early cartographers often used magnetic north for surveys. For contemporary modelers, it is important to remember that magnetic north moves. Adjustments vary from location to location; in the end, I made the adjustment visually, using the stream and shoreline in both sets of data to orient the respective overlays.
The image in Figure 16.3 shows the historic insurance map overlaid with Google Earth terrain. To allow the best placement, it was set to be partially transparent so that it was possible to see both the map and the terrain. Transparency was adjusted by activating the Materials dialog box via B or Paint Bucket.
The map was then sampled using the Eyedropper tool, which makes the map active in the Materials dialog box. Transparency was adjusted using the opacity slider at the bottom of the dialog box. Note the 12° discrepancy in “true north.” Final elevation of the building was set in the subsequent steps.
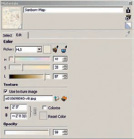
FIG 16.2b
The Earth’s magnetic North Pole is constantly moving. When working with old maps, you may find that the North indicated on these maps does not allow the features to line up with any existing features. It is possible to mathematically correct for this; but it can be quite a technical process. In the case of Byng Inlet, adjustments were made using visual clues from both the Google Earth snapshot and the historic insurance map. A best-guess estimate proved quite serviceable and accurate for this model.
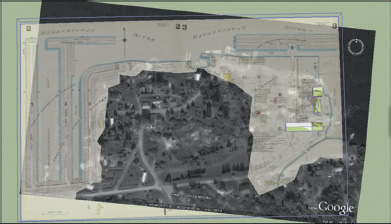
FIG 16.3
Before discussing the modeling in depth, it is helpful to learn a bit about how SketchUp implements terrain data in a model. When SketchUp imports terrain data, there are actually two sets of data that are imported. First is a flat snapshot of how the terrain looks like from satellite observations, and the second is the actual terrain/elevation data – a skin on which the satellite image is projected. The view of these layers can be toggled on or off by utilizing the Toggle Terrain tool on the Google toolbar.
Tip
The above information about how SketchUp implements terrain data is pointed out here because one needs to remember what surface you are modeling on. Modeling on the Google Earth layer can cause you to end up with buildings that are aligned with the ground but not necessarily vertical as they are in real life. If you are beginning to model using terrain data imported by Google Earth, unless the land is perfectly flat, it is best to model on the Google Earth snapshot first and then move to your model and adjust it to the proper position on the terrain.
Step 4: Additional Modeling and Refinement
Goal: To detail buildings based on location abstracted from map and the addition of details provided by historic photographs.
Inputs: Outlines from the map combined with historic and contemporary photographs.
Tools: SketchUp native tools, Rotated Rectangle Ruby script.
A problem that is frequently encountered by novice users is how to properly seat buildings on a hilly terrain. Online tutorials detail how to form the buildings and extract surface materials but overlook the fact that at times the buildings end up appearing to float on air. Common sense should be the guidepost. Just as in real life, buildings need a proper foundation to rest on. These foundations account for the varying terrain.
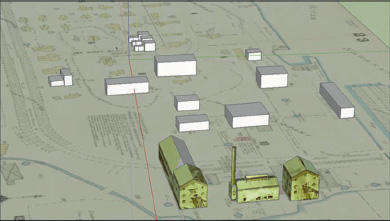
FIG 16.4a
Unlike the modeling of contemporary buildings that are shown on the Google Earth terrain, this example uses the historic insurance map as the primary source for location information. The map was imported and grouped to keep it from “sticking” to the modeled buildings. It was also assigned to a layer so that it can be quickly hidden or displayed as the modeling progresses.
SketchUp’s inference engine uses the main axis of the model as a reference. When modeling real-world situations, often features are not perfectly aligned to the axis. Using the Rotated Rectangle Ruby script will allow you to easily draw buildings that are not aligned with the model’s main axis. In this manner, you can quickly trace the building outlines indicated on the map.
After the preliminary outlines of the building are traced, it is time to begin detailing. As stated previously, historians need to play detective when recreating historic buildings. A quick search of the Internet revealed a few historic photographs that provided details about appearance and construction. A search of popular photo-sharing sites like Flickr or Picasa also turned up some contemporary photographs of a few extant buildings in Byng Inlet.

FIG 16.4b
For this exercise, the buildings were not modeled in extreme detail; simple building profiles and the most basic features of windows and doors were added to give the town a sense of realism. While modeling one house at a time normally, I found an interesting tip for drawing the roof. I was getting bogged down in trying to scale the roof to make a proper overhang. After repeatedly modeling many houses, I found a streamlined and efficient method to do this, which is outlined here:
Starting with the basic block of the house, group just the top face; then using the Scale tool, scale the eaves as needed to produce the eave of the house. Next, pull up the offset portion to get it to the proper height. The inference engine of SketchUp then allows you to find the center of the roof. The Line tool is used to draw the pitch of the roofline. Now, using the Offset Line option on the front (triangular) face, you can draw a perfectly symmetrical eave. Line will be needed to complete the fascia. Finally, use the Push/Pull tool to carve out the roof and pediment. These simple steps are roughly illustrated in Figure 16.5a.
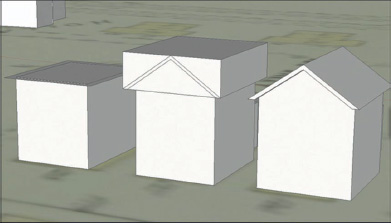
FIG 16.5a
Windows were added based on the historic photographs. Google’s Window Maker Ruby script is ideally suited for adding simple windows. A dialog box allows you to specify the height, width, and type (double hung or slider) of windows. This plug-in has the added convenience of cutting an opening in the wall as the window is placed, which makes it easy to quickly populate your models with low-poly windows.
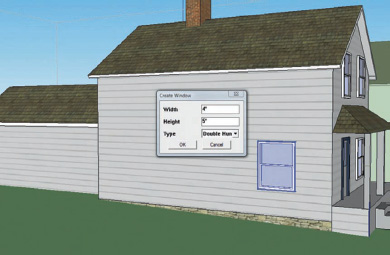
FIG 16.5b
Next, a simple door and a porch were added, and the model was textured to make it look real. This house was made into a component as it was used repeatedly in the model. Finally, the Google Earth terrain layer was turned on by using the Toggle Terrain icon. Using the Move tool, the height or altitude of the building was adjusted so that its foundation was inset into the Google Earth terrain layer of the model.
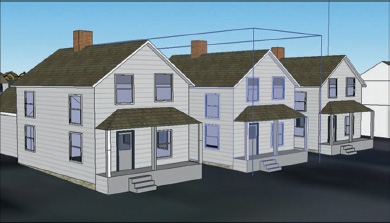
FIG 16.6
Modeling from historic photographs can be challenging. Take time to familiarize yourself with the layout of the town. Pay attention to key landmarks and buildings, and use them to determine where the photograph was taken. Was the photograph taken from a hill or a prominent vantage point? Byng Inlet’s photographs are dominated by the large cylindrical sawdust burner that tower over many of the buildings in the town. The use of key features as anchors will help you to reconstruct the locations where the photographs were taken and the angles they illustrate.
As seen in the illustration below (Figure 16.7), it is possible to infer where the photographs were taken. In this example, the historic photograph has been added to a plinth modeled on the ground. For educational purposes, these plinths were added to several locations in the model that match the historic buildings with those modeled in SketchUp.

FIG 16.7
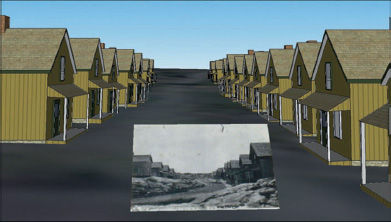
FIG 16.8
When there is a need to model multiple instances of buildings that are identical, make them a Component. Components allow you to reduce the size of the model file and let SketchUp perform better. Setting the axis of the component at the base of the foundation allows them to “stick” to the surface where they are placed. Another advantage of using Components is that when you change or edit one instance of a Component, the change is reflected in all instances of that Component. In this model, many of the workers’ houses were instances of the same Component; they can quickly populate the model with adjustments made only to their location and elevation.
As an experiment, I began to abstract imagery for the faces of buildings and applied them to the buildings in the model. This was not done via photo matching but by selecting the face of the building and then importing the images via the File/Import option on the toolbar. This led to some visually intriguing results. These images can be left as they are, or traced and modeled for further refinement of the model.
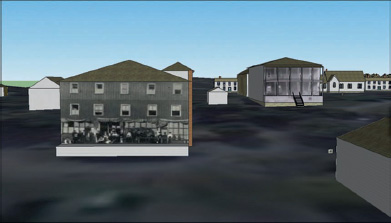
FIG 16.9
Step 5: Exporting the Model to Google Earth
Goal: To export a.kmz file for use in Google Earth.
Input: Model feature in the Tools/Google Earth toolbar.
Tools: SketchUp, Google Earth.
When modeling is complete, it is very easy to view it in Google Earth. Under the Tools/Google Earth toolbar, you will find a command called Place Model. Activating this option will open a progress bar indicating the status of your export. When complete, Google Earth will immediately open and your model will be displayed in the sidebar under “Temporary Places.”
Tip
The procedure used in this tutorial is intended for private viewing and not for inclusion in Google’s public 3D building layer. This model is too large for inclusion, and since it is based on buildings that no longer exist, it will not be accepted by Google.
For a model to be accepted by Google Earth, the following criteria must be met (adapted from Google, see http://sketchup.google.com/3dwarehouse/):
1. Models should represent structures that actually exist.
2. Ensure your model sits properly on the terrain in Google Earth.
3. Models should not include an excess of entourage (trees, cars, and people).
4. Models should be completely photo-textured. Improper or partial texturing is one of the more frequent reasons for rejecting a model.
5. Models should be of the correct size and height, and be properly aligned to match what appears in Google Earth’s aerial photography.
6. Models should not be too complex. When modeling for Google Earth, you need to strike a balance between realism and simplicity.
7. Models should not exhibit “Z-fighting.” Z-fighting is the flashing you see when two or more coplanar faces are overlapping.
8. Models should not include more than one discrete structure each.
For a more complete and detailed list of criteria, refer to this Web site: http://www.google.com/intl/en/sketchup/3dwh/acceptance_criteria.html.
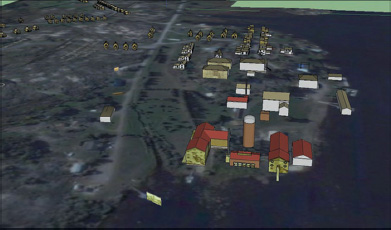
FIG 16.10
Conclusion
The final model contained over 100 buildings, scaled and geolocated. The resultant model is viewable in SketchUp or Google Earth and is currently being used by schools in the vicinity of Byng Inlet to teach the children more about the once-thriving community of this town. As my contact in Ontario viewed the model, he exclaimed: “This is amazing! I never knew there were so many houses and buildings. … They are all gone.”
The recently released Google Earth API has many additional features to add more layers of content to the SketchUp model once it is imported into Google Earth. Placemarks, Web links, and even recorded narrations can now be added to location tours, allowing limitless possibilities for educators and historians.
SketchUp is ideally suited for modeling historic sites from photographs. The ability to import terrain and utilize historic photographs for textures allows for a synthesis of information that would be difficult to achieve with other software solutions. The amount of detail and accuracy included in the model is limited only by the amount of source material available. Google SketchUp is an immensely powerful tool, limited only by your imagination.
Resources
An early version of the model in this tutorial can be found in the 3D warehouse by using the search term, “Byng Inlet.” The final model was too large for inclusion into the 3D warehouse, but most of the significant items covered in this tutorial can be seen.
The authors thank Gary McLaughlin of Byng Inlet, Ontario, for the use of photographs in this project.
Software
SketchUp, Google Earth
SketchUp Plug-Ins
Rotated Rectangle and Window Maker are available from http://sketchup.google.com/download/rubyscripts.html.