11
Cypher Ecosystem
In the previous chapters, we looked at all the aspects of querying graph databases using Cypher. This chapter focuses on the Cypher ecosystem. You will be introduced to a selection of tools and packages available for more advanced data processing, along with visualizing the results as graphs, tables, and more.
We will look at the following topics in this chapter:
- Using Neo4j extensions
- Using visualization tools
- Using Kafka and Spark connectors
- Using Graph Data Science
- Using Neo4j Workspace
First, we will take a look at the Neo4j extensions.
Using Neo4j extensions
While Cypher is a very powerful language for expressing graph traversal in a simple manner, it is difficult to implement complex graph analytics or handle different kinds of data effectively. This is where Neo4j extensions come into the picture. Neo4j provides the ability to build and register plugins with procedures that can be invoked from Cypher to perform more complex operations.
In the following screenshot, we can see the plugins available to install for the selected database in Neo4j Desktop:
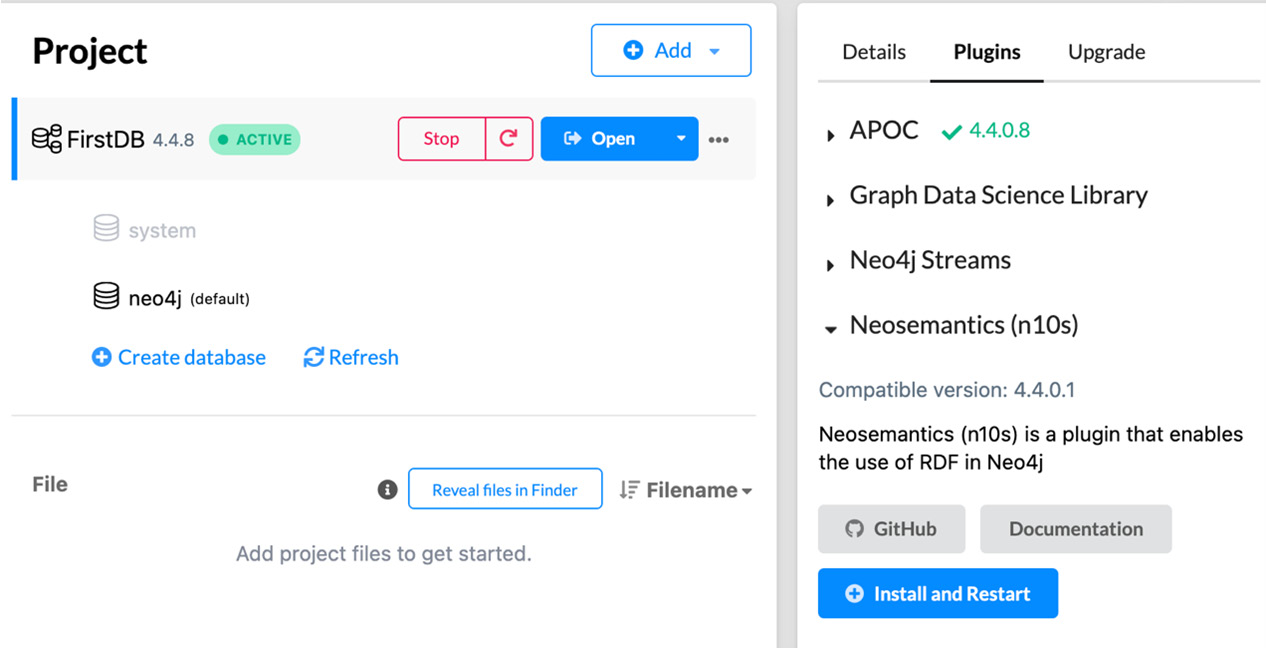
Figure 11.1 – Plugin management in Neo4j Desktop
Let’s review what these plugins provide in the following list:
- APOC: APOC is short for Awesome Procedures On Cypher and is an add-on library that provides a lot of functions and procedures that add useful functionality to Cypher. We discussed the important features of this extension in detail in Chapter 10, Using APOC Utilities.
You can find more details on this at https://neo4j.com/labs/apoc/.
- Graph Data Science library: The Neo4j Graph Data Science (GDS) library provides a lot of analytical capabilities to analyze the data in graph databases by leveraging graph algorithms and machine learning workflows. Some of the graph algorithms provided are as follows:
- Community detection
- Centrality
- Node similarity
- Path finding
- Link prediction
It also provides a catalog of procedures to support data science workflows and machine learning tasks on graph data. All these procedures are built for massive scale and parallelization. You can read more about graph algorithms and machine learning capabilities at https://neo4j.com/product/graph-data-science/.
- Neo4j Streams: The Neo4j Streams plugin integrates Neo4j with Apache Kafka to act as a source or sink. There are two different aspects to this connector. There is a version called Kafka Connect, which only works with Neo4j as the sink. This is deployed on Kafka servers. This works with Confluent Cloud as well. You can read more about this at https://neo4j.com/labs/kafka/4.1/kafka-connect/. The second version is a Neo4j extension that needs to be deployed on a Neo4j server. In this aspect it can work with Neo4j as the source or the sink. It provides some change data capture (CDC) capabilities also. While this can make it easy to do certain things, it also means a certain percentage of CPU will be used by this plugin, thus reducing the processing capability available for the database server to carry out its usual functionalities. You can read more about the features and capabilities at https://neo4j.com/labs/kafka/4.1/.
- Neosemantics (n10s) Neo4j RDF and Semantics toolkit: This plugin enables the processing of Resource Description Framework (RDF, https://www.w3.org/RDF/) datasets and mapping them to property graph format for storage in Neo4j. It supports RDF vocabularies, such as OWL, RDFS, SKOS, and others, in a seamless manner. You can use this plugin to consume or generate RDF data. It can also validate graphs against defined constraints expressed in Shapes Constraint Language (SHACL, https://www.w3.org/TR/shacl/). You can read more about this plugin at https://neo4j.com/labs/neosemantics/.
We have introduced these extensions so that developers are aware of external plugins that can expand Cypher’s functionality. It is out of the scope of this book to go deeper than this, but feel free to visit the sites provided to understand more about these extensions and how they can help us to build better solutions.
We will take a look at visualization tools available for Cypher to present results next.
Using visualization tools
We will take a look at the visualization tools available to present the results. The visualization tools available from Neo4j are already installed in Neo4j Desktop by default. These are as follows:
- Neo4j Browser: We have looked at using Neo4j Browser to interact with databases in Chapter 1, Introduction to Neo4j and Cypher. It is a very good tool for developers to interact with databases.
- Bloom: Bloom is a more powerful graph visualization tool than Neo4j Browser. While Neo4j Browser is aimed more at developers, Bloom is aimed at end users exploring graphs using more natural language queries. It provides the following capabilities:
- High-performance, GPU-powered rendering to create large graphs with physics-based layouts.
- Data exploration functionality without needing to learn Cypher with the ability to use near-natural language search phrases.
- The ability to selectively expand the nodes and relationships along with inspecting the properties.
- The ability to visually edit existing records and add new records.
- The ability to create different views and perspectives of the same graph and share those perspectives with different users. This can be customized to meet different business requirements from the same data.
Along with these visualization tools, Neo4j Desktop also provides options to explore other visualization aspects via graph apps. You can install graph apps at https://install.graphapp.io/.
Let’s take a look at a few of the graph apps and utilities available at the preceding link:
- Graph Gallery: This graph app provides a lot of example graphs that developers can play with to familiarize themselves with graph databases and Cypher. You can find more details at https://medium.com/neo4j/meet-the-graph-gallery-3666a127efee.
- Charts: This graph app provides functionality to build charts using graph data. It provides a visual query builder, so that the user does not need to know Cypher fully to use it. It gives options to developers as well as business users to build simple dashboards with charts to provide insights from graphs. You can read more at https://medium.com/neo4j/creating-charts-from-your-graphs-2f5b4e86fd6c.
- GraphXR provides the ability to explore graph data in virtual reality (VR). To learn more about this, please visit https://neo4j.com/blog/graphxr-graph-app-neo4j-desktop/.
- NeoDash is a no-code utility to quickly build dashboards with Neo4j as the backend database. It is a lightweight app that hooks into Neo4j to build dashboard widgets quickly. You can read more about this at https://nielsdejong.nl/neo4j%20projects/2020/11/16/neodash.html.
- Graphlytic Desktop: Graphlytic is capable of building a graph data model from scratch by combining various data sources. It also provides pattern-searching functionality and visual analytical exploration of graphs. You can find out more about this at https://graphlytic.biz/blog/how-to-install-graphlytic-in-neo4j-desktop.
- SemSpect: This is another visualization tool that can assist the exploration of large graphs without using Cypher to get intelligence and perform analytics. It instead explores graphs using the model semantics. You can read more about it at https://neo4j.com/blog/semspect-different-approach-graph-visualization/.
- NeoMap Map Visualizer: This visualization tool overlays data onto geographical maps. It leverages the geographical coordinates (point properties) in the data to display the nodes on a map. You can learn more about this tool at https://medium.com/neo4j/introducing-neomap-a-neo4j-desktop-application-for-spatial-data-3e14aad59db2.
- Neo4j Commander 3: This tool provides an intuitive way to edit the data in a graph without relying on Cypher. You can read more about this tool at https://medium.com/neo4j/editing-data-in-neo4j-graphs-doesnt-have-to-be-hard-8e9791c731bc.
We have only discussed the tools available for Neo4j Desktop here. There are other visualization tools such as Linkurious, yWorks, and KeyLines, among others.
Let’s take a look at Kafka and Spark connectors next.
Using Kafka and Spark connectors
Neo4j has official support for Kafka and Spark connectors that can read and write data to graphs. The Kafka connector makes it easy to ingest data into Neo4j at scale, without needing to build custom client code. Spark connector simplifies the reading and writing of data to graphs using dataframes. Let’s take a look at the core features provided by these connectors:
- Kafka connector:
- Provides the capability to ingest data into Neo4j using templatized Cypher queries
- Can handle streaming data efficiently
- Runs as a plugin on existing Kafka installations
- You can read more about this connector at https://neo4j.com/labs/kafka/4.1/kafka-connect/
- Spark connector:
- Makes it easier to read nodes and relationships into a dataframe
- Makes it possible to take the data from dataframes and write it into Neo4j easily
- Supports using Python or R as the language of choice in Spark
- Makes it easier to leverage all the capabilities of Spark to massage the data before writing it to Neo4j
- You can read more about this connector at https://neo4j.com/docs/spark/current/overview/
Now let’s look at the Graph Data Science plugin.
Using Graph Data Science
Neo4j’s Graph Data Science (GDS) library implements a lot of graph algorithms to help users derive intelligence from data. They are implemented to run in parallel, allowing algorithms to run fast and provide results quickly.
The algorithms included are as follows:
- Node centrality algorithm
- Community detection algorithm
- Similarity algorithms including the Jaccard, Cosine, Pearson, Euclidean and k-nearest neighbor algorithms
- Path-finding algorithms including the Dijkstra, A* shortest path, Yen’s shortest path, breadth-first, depth-first, and random walk algorithms
- Node embedding algorithms including FastRP, GraphSAGE, and Node2Vec
- Link prediction algorithms
Along with these graph algorithms, this library also provides the following machine learning pipelines:
- Node classifications
- Link predictions
This library is a must-have tool in any data scientist’s toolkit to process graph data effectively and extract intelligence and outcomes from the data.
Next, let’s look at Neo4j Workspace, which is a new feature released recently to help developers work with Neo4j without needing to write any code.
Using Neo4j Workspace
Neo4j Workspace is a new tool to help developers quickly map and load the data and analyze it with visual tools such as Neo4j Browser and Bloom without needing any coding experience. It makes it easy for graph enthusiasts, explorers, and data scientists who lack coding experience or knowledge of Cypher to get started very quickly. It includes other tools such as Data Importer, which provides a UI to map CSV/TSV data to a graph model and load the data into a graph. Browser and Bloom are also included to help explore the data visually in a single place. Workspace is still in early access; users can register for access at https://neo4j.com/product/workspace/.
Now, let’s summarize what we’ve learned in this chapter.
Summary
In this chapter, we took a brief look at Neo4j extensions including APOC, the Graph Data Science library, Neosemantics, and Neo4j streams, which can enhance Cypher’s capabilities to handle complex activities in Neo4j. We also talked about visualization tools such as Bloom, NeoDash, and others that are available to explore graph data using charts and maps, among other things.
In the next chapter, we will take a look at some tips and tricks to help you get the most out of Cypher.