
Chapter 13. Customer Feedback Systems
A big piece of the quality puzzle is the customer. Software companies such as Microsoft write software for people—software that can help people be more productive or accomplish tasks they wouldn’t be able to do otherwise. This chapter discusses the tools and techniques Microsoft uses to gather data from our customers and partners to help us improve the quality of our products and to influence our testing.
Testing and Quality
I hope this isn’t a shock, but customers don’t really care about testing. At some level, I suppose they care that some effort went into testing the product before they spent money on it, but they’re not at all concerned with most of the actual work that testers do.
Imagine that you are browsing for software at a store and pick up a box to read the bullet points on the side describing its features:
Ran more than 9,000 test cases with a 98 percent pass rate.
Code coverage numbers over 85 percent!
Stress tested nightly.
Nearly 5,000 bugs found.
More than 3,000 bugs fixed!
Tested with both a black box and white box approach.
And much, much more...
Those bullet points are all interesting to the engineering team, but the customer doesn’t care about any of them. Customers only care if the product solves a problem for them and works in the way they expect. If you consider software quality to be the value it provides to the user, most test activities don’t directly improve software quality. Despite this, testing is indeed valuable (or I wouldn’t be writing this book). So, what does testing do?
Testing Provides Information
The bullet points mentioned previously provide information about the testing activity and, in some cases, the status of the product. This information is critical in assessing progress and identifying risk. For example, if the latest report from the test team says that they have run half of their tests and have found 40 critical “severity 1” bugs, that relates a different risk metric than if test tells you they’ve run all of their tests and found only 1 critical bug. Of course, this is not enough information either—you would want to know what types of tests were done, which scenarios were tested, which areas of the product they had tested, how many noncritical bugs were found, and dozens of other points of data. I’ve never liked the idea of test being the gatekeepers of quality. Rather, I like to think that the information that testing provides helps the product’s decision makers make the right decisions regarding schedule and risks.
Quality Perception
If everything goes perfectly, the work that the test team does increases quality by decreasing risk. In reality, this doesn’t always happen. Too often, the information provided by the test team is not reflective of the way customers will actually use the product.
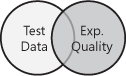
You can think of test data and customer-perceived quality (I like to call this experience quality) as two related but distinct spheres of data relating to quality:

If our test information were perfect, we would be able to predict the experience quality that our customers will have—that is, at the time of release, we would know within a few points what the customer satisfaction numbers would be when we survey customers six months later. Our two spheres of quality would nearly overlap:

Most of the time, these circles intersect, but rarely quite as much as we hope:
Microsoft is working hard to get experience quality and test data to match—by finding more measurements that can predict how customers will perceive quality. Data that shows how the customers are using a product, where it is failing them, and what they like and dislike about the product is invaluable in developing quality software.
One of the big problems many of Microsoft’s large software projects face when gathering customer data is processing all of the diverse sets of data in a way that accurately reflects the diversity of needs of the customer base. Product support data, e-mail, customer surveys, and usability studies all provide valuable information, but it can be difficult to prioritize the feedback and understand the scenarios surrounding these data points, as depicted in Figure 13-1. Moreover, we discovered that often the data from various sources didn’t agree, was subjective, and we frequently couldn’t process and comprehend all of the data.

There are many ways to find and collect information and feedback from customers. This chapter discusses four methods in use across most product teams: Customer Experience Improvement Program (CEIP), Windows Error Reporting (WER), Send a Smile, and Connect. Many of these tools are available to our partners and Microsoft corporate customers.
Customers to the Rescue
The best way to find out how customers use your software is to watch them. When you have only a few users, and know when they will be using your software, and if they agree to let you watch them, this is a great solution. Knowing how the customers use your software goes beyond what can be discovered by a usability study. Knowing how the customers use your software means that you know how they learn to use the program, which tasks they perform most often, and which tasks they never use.
When you install certain Microsoft applications, the dialog box shown in Figure 13-2 opens asking if you would like to help make the application better by providing feedback on your use of the product. If interested, you can enroll in the Customer Experience Improvement Program (CEIP). When you opt in to this program, anonymous data about how you use the application is occasionally uploaded to Microsoft when your computer is idle. At Microsoft, we know that to make great products, we need to understand as much as we can about how the products are used. Millions of people use Microsoft products, so it is impossible for us to contact even a fraction of the customer base for some of our larger products. CEIP data provides a massive amount of information that helps us understand how customers use our products—I like to think of CEIP as being just like one of those Nielsen Ratings boxes used for collecting TV ratings, except for software.

When a customer agrees to participate in the program, we collect anonymous, nontraceable data points detailing how the software is used, what hardware the software is installed on, and a variety of other bits of information to aid in understanding customer usage (confidential or personally identifiable data is never collected). The initial consumers of this data are often designers or user experience engineers. The data, collected from millions of customers, provides a unique insight into how they use our products. Some examples of the types of data collected are as follows:
Application usage
How often are different commands used?
Which keyboard shortcuts are used most often?
How long are applications run?
How often is a specific feature used?
Quality metrics
How long does an application run without crashing (mean time to failure)?
Which error dialog boxes are commonly displayed?
How many customers experience errors trying to open a document?
How long does it take to complete an operation?
What percentage of users is unable to sign in to an Internet service?
Configuration
How many people run in high-contrast color mode?
What is the most common processor speed?
How much space is available on the average person’s hard disk?
What operating system versions do most people run the application on?
The data points can influence many aspects of product development. Figure 13-3 and Table 13-1 show example CEIP data measuring the amount of time users spend running an application. In this case, the product team initially assumed that users of the software ran the program constantly in the background, and that they would switch tasks to activate the application from time to time. Based on this assumption, a significant portion of their test scenarios and development efforts concentrated on measuring resource usage over time and in detecting other issues that might occur while running the application for long periods. The CEIP data supported this assumption and showed that one-quarter of the users ran the product for 8 hours or more, and that nearly half the users ran the program for sessions lasting at least 2 hours.
Time spent running application in 24-hour period | Sessions | Percentage of total | Active session time (in seconds) | Average minutes in session | Percentage of time active |
Less than 5 minutes | 2,496,181 | 24% | 17,811,873 | — | — |
6–30 minutes | 1,596,963 | 15% | 8,572,986 | 18 | 31% |
31–60 minutes | 691,377 | 7% | 4,997,432 | 45 | 16% |
1 hr | 757,504 | 7% | 6,957,789 | 90 | 10% |
2 hrs | 487,616 | 5% | 5,645,785 | 150 | 8% |
3 hrs | 395,007 | 4% | 5,514,112 | 210 | 7% |
4 hrs | 347,705 | 3% | 5,593,810 | 270 | 6% |
5 hrs | 331,561 | 3% | 6,135,420 | 330 | 6% |
6 hrs | 355,017 | 3% | 7,785,188 | 390 | 6% |
7 hrs | 457,104 | 4% | 12,357,653 | 450 | 6% |
8 hrs and up | 2,636,023 | 25% | 68,692,969 | 960 | 3% |

The unanticipated piece of data that the product team discovered was that nearly one-quarter of the users ran the application for 5 minutes or less, and that another 15 percent ran the program for less than 30 minutes. Instead of leaving the application running in the background for quick access, a significant percentage of the users started the application to view updated data, and then closed the application shortly after. After analyzing this data, the test team reprioritized a portion of their test scenarios and performance work around improving application start-up and shutdown time to improve the experience for people using the application in this manner.
The CEIP data drives many design decisions but is also quite beneficial to test teams. Data from released products can influence the testing approach and strategy used for future versions of the product, as well as to aid in root cause analysis of significant issues found after release. During the product cycle, frequent analysis of this data from beta users and key partners makes it possible for the test team to consistently update test scenarios and priorities as the team gains a greater understanding of customer usage patterns and pain points.
Note
The top three most-used commands in Microsoft Office Word 2003 are Paste, Save, and Copy (courtesy of CEIP data).
Through my years at Microsoft, I have analyzed many bugs found by customers after product release to identify how our team could improve testing in subsequent product work. Somewhat surprisingly, I discovered that only a few of the customer errors were in areas that we “missed,” such as areas where we didn’t have test coverage or scenarios. Most of the errors were right in the middle of areas where we had defined test scenarios or high code coverage—but the errors were apparent only when the customer scenario differed from our scenario. In recent years, CEIP data has helped many test teams begin to bridge this gap.
More Info
For more information about CEIP, see the Microsoft Customer Experience Improvement Program page at http://www.microsoft.com/products/ceip.
Note
An early pilot of an MSN subscription service timed out the sign-up process at 20 minutes. CEIP data revealed that many users took longer than 20 minutes to complete the sign-up process and were disconnected before they could finish!
Games, Too!
Inspired by CEIP, the Microsoft Games Systems team created an application instrumentation tool named VINCE (Verification of Initial Consumer Experience), also named after Voodoo Vince, the first game instrumented with the toolset. Today, whereas CEIP can run on all versions of the Windows and Windows CE operating systems, VINCE can run on Xbox and Xbox 360, as well as the PC platform, and supports issues specific to games. For example, beta users can provide feedback on how difficult they thought a certain portion of the game was by completing a short customer survey designed to be answered quickly using the game controller.
One of the most successful instrumentations to date is with Halo 2. The single-player campaign of Halo 2 consists of 14 levels, and each level consists of dozens of encounters (there are 211 total encounters in the game, ranging from 2 minutes to 30 minutes in length). Using instrumentation, the team was able to get consumer feedback on each of the encounters at least three times. Overall, they collected more than 2,300 hours of gameplay feedback from more than 400 participants—something that would have been impossible without instrumentation.
One example of how this data was used is on a Halo 2 level called Gravemind, which is about two-thirds of the way through the game. The encounter takes place in a room filled with enemies, including the vicious Brutes. This is the first time the player fights Brutes, and this room is particularly lethal.
By looking at the instrumentation reports, the Halo team was quickly able to identify this encounter as being especially difficult immediately after the testing session. Further analysis of the encounter showed that a high number of deaths occurred as a result of plasma grenades, needlers, and Brute attacks. One valuable feature of VINCE is that it can capture video of areas requiring additional investigation. Watching the associated video revealed that the arc of the plasma grenades was too flat (not giving players enough time to dodge the grenades), that Brutes were killing players from behind (players were dying immediately, without knowing why), and that people were incurring a lot of damage from the needler weapon (because some enemy characters were holding two needler weapons, making them extremely deadly).
The Halo team made several changes based on this feedback: a global change about how grenades are thrown (removing the instance of flat-arc grenades in that encounter), the location of enemies in the room (all enemies appear from one location instead of several to reduce the chance of the player being killed from behind), and an overall reduction in waves of enemies the player has to battle through. Other minor changes were made as well. Through iterative testing, they found that the design changes dramatically reduced the number of deaths in this room while improving the attitudinal feedback (a.k.a. the fun factor) about this encounter. In other words, they were able to reduce the difficulty and number of deaths without making the encounter too easy for players.
Customer usage data is an important technique for influencing product and test design for any software application. The data can be used to define missing scenarios or to modify existing testing scenarios and configurations. It is certainly not the only way to influence design, and it isn’t helpful at all if the appropriate instrumentation to supply feedback does not exist in the product code. It is one significant technique that teams at Microsoft use to aid in designing, creating, and testing programs that recognize and support key user scenarios and areas of customer pain and frustration.
Windows Error Reporting
One thing that’s been amazing at Microsoft is the impact that our monitoring data has had on how we prioritize our software work. I’m sure you’ve all seen in Windows that whenever an application or the system malfunctions, you get the ability to send a report back to Microsoft.
We get a lot of those reports, and we’ve created very good data-management systems to go in and look at those things, and therefore understand what drivers aren’t reliable.
We allow anyone who has an application that runs on Windows to sign up and get the reports that relate to their application, and we’ve got winqual.microsoft.com where people can do that.
Today we’ve seen a lot of that activity from the driver manufacturers, but we want to see even more at the application level so it gets us working together on anything where a user is not having a great experience.
Just about every Microsoft customer has seen the Windows Error Reporting dialog box shown in Figure 13-4.
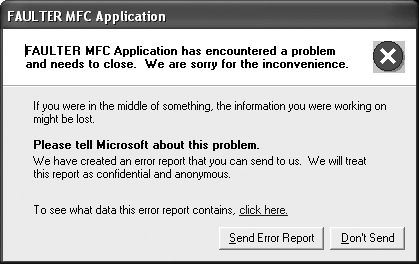
Most users of Windows see a similar dialog box each time an application crashes. Although I, for one, would like to see far fewer appearances of this dialog box, it has one advantage: Every time it appears, in the background it is generating data points that Microsoft uses to increase product quality. The dialog box shown in the figure is a part of the Windows Error Reporting (WER) infrastructure. Note that on the Windows Vista operating system, errors can be configured to be automatically sent to Microsoft without the need to interact with an error reporting dialog box.
The Way We WER
WER is a flexible event-based feedback infrastructure designed to gather information about the hardware and software problems with applications or the operating system that Windows can detect, report the information to Microsoft, and provide users with any available solutions. WER is a simple and secure method for users to provide information about application crashes and provides a database that categorizes and prioritizes reports for Microsoft and partner software vendors. It also provides a means for Microsoft and vendors to respond with status reports, requests for additional information, or links to other information about a specific issue.
On Windows Vista, Problem Reports and Solutions in Control Panel, shown in Figure 13-5, keeps a record of all system and application issues reported through WER and gives you more information about the errors, including a list of all existing possible solutions for these problems.

WER works a lot like a just-in-time (JIT) debugger. If an application causes an error that is not caught by any of its own error handlers, the Windows error system catches the error. In addition to displaying the error reporting dialog box, the system captures data at the point of failure, including the process name and version, loaded modules, and call stack information. The entire process looks something like this:
The error event occurs.
Windows activates the WER service.
WER collects basic crash information. If additional information is needed, the user might be prompted for consent.
The data is uploaded to Microsoft (if the user is not connected to the Internet, the upload is deferred).
If an application is registered for automatic restart (using the RegisterApplicationRestart function available on Windows Vista), WER restarts the application.
If a solution or additional information is available, the user is notified.
Although WER automatically provides error reporting for crash, hang, and kernel faults, applications can also use the WER API to obtain information for custom problems not covered by the existing error reporting. In addition to the application restart feature mentioned previously, Windows Vista extends WER to support many types of noncritical events such as performance issues.
Corporate Error Reporting
Corporate Error Reporting (CER) is a version of WER that companies can use to capture crash information from applications and forward the reports to Microsoft when they occur.
CER provides companies with several benefits. Many companies do not want their users to automatically forward crash data to Microsoft because of concerns of forwarding company confidential information. (Microsoft places strict confidentiality restrictions on the crash information it receives.)
The primary benefit companies that implement CER receive is the ability to track crash errors in the environment. By recording hard data of when corporate users experience crash events, companies can prioritize which updates to their production environment will have the most positive impact. This information is also a valuable metric for the IT department to measure the effect it has on improving user productivity.
Filling the Buckets
You might wonder who the poor soul is who is responsible for looking at millions and millions of crash reports from WER. Fortunately, this job is a great task for a computer to help accomplish, and the backend error reporting system does a fantastic job of processing an enormous number of error reports.
The crashing process name, version, call stack, processor registers, and other collected data are automatically analyzed and sorted into buckets. A bucket is a categorization of all instances of a specific error associated with a particular version of a driver, application, Windows feature, or other component. By using buckets, the product teams can appropriately prioritize how they will address WER reported issues. In other words, product teams sort WER issues by number of hits in each bucket. To ensure that they address the issues causing the most customer pain, all issues that exceed a team-designated threshold for number of occurrences are automatically entered as bugs in the product bug tracking systems so that teams can focus on the issues causing the most customer frustration.
Emptying the Buckets
As more error reporting data becomes available, trends inevitably develop. Analysis of data shows that across all reported issues fixing 20 percent of the top-reported bugs can solve 80 percent of customer issues, and that addressing 1 percent of the bugs would fix 50 percent of customer issues, as shown in Figure 13-6. Simply put, of the total number of crashing errors experienced by customers, most are caused by a small number of actual errors. The same analysis results are generally true regardless of the application. The goal of the product team is to look first at those defects that are causing the most crashes. Focusing on them will produce the biggest return for the smallest relative effort.

Like other feedback data, WER information is always beneficial but is critically effective when collected and analyzed during beta releases. Table 13-2 contains typical crash data for the top 10 issues found in an application. Many product teams set goals regarding WER data collected during product development. Common goals include the following:
Coverage method. When using the coverage method, groups target to investigate N percent (usually 50 percent) of the total hits for the application.
Threshold method. Groups can use the threshold method if their crash curves (one is shown in Figure 13-6) are very steep or very flat. With flat or steep crash curves, using the previously described coverage method can be inappropriate because it can require too many or too few buckets to be investigated. A reasonable percentage of total hits for the threshold method is between 1 percent and 0.5 percent.
Fix number method. The fix number method involves targeting to fix N number of defects instead of basing goals on percentages.
Bucket ID | App name | Version | Module name | Module version | Symbol | Hits | Type |
231387 | app.exe | 1.0.0.1 | appsupp.dll | 6.1.0.0 | appsupp.dll!Erase | 1,511,546 | Crash |
309986 | app.exe | 1.0.0.1 | app.exe | 1.0.0.1 | app.exe!Release | 405,982 | Crash |
195749 | app.exe | 1.0.0.1 | appsup.dll | 6.1.0.0 | appsupp.dll!Draw | 394,517 | Hang |
214031 | app.exe | 1.0.0.1 | appsup2.dll | 6.1.0.2 | appsup2.dll!Reset | 137,638 | Crash |
485404 | app.exe | 1.0.0.1 | app.exe | 1.0.0.1 | app.exe!SetObject | 100,630 | Crash |
390064 | app.exe | 1.0.0.1 | appsup2.dll | 6.1.0.2 | appsup2.dll!Display | 95,604 | Hang |
208980 | app.exe | 1.0.0.1 | appsup3.dll | 1.0.0.1 | appsup3.dll!AppPrint | 74,997 | Crash |
204973 | app.exe | 1.0.0.1 | app.exe | 1.0.0.1 | app.exe!Release | 55,434 | Crash |
407857 | app.exe | 1.0.0.1 | app.exe | 1.0.0.1 | app.exe!MainLoop | 54,886 | Crash |
229981 | app.exe | 1.0.0.1 | appsupp.dll | 6.1.0.0 | appsupp.dll!function | 51,982 | Crash |
Test and WER
At a minimum, test should be responsible for monitoring the aggregated crash data and measuring the progress against fix goals. A wealth of additional information can be mined when you know all the different ways customers have found to crash an application.
It is vital to fix the issues causing the most customer pain, but big improvements come from investigating the root cause of the issues customers are experiencing most often. Often, understanding how an error was created or how code analysis tools, testing, or another process missed detection of the bug can lead to implementation of a solution that prevents similar types of issues from ever occurring again. Fixing the bug alone is great for the customer, but being able to prevent a class of bugs from ever seeing the light of day is a fantastic opportunity.
Analysis of the root problem can also lead to identification of crash patterns. In the world of software, design patterns are common solutions to recurring problems. In this light, you can think of a crash pattern as a common, transferable method for crashing a perfectly good program. Analysis of common crashing problems often reveals other areas of the product that might crash in the same way. Patterns can be (and are!) applied to many other types of bugs as well.
More Info
For more information about WER, see the Windows Error Reporting topic on Microsoft MSDN at http://msdn.microsoft.com/en-us/library/bb513641.aspx.
Smile and Microsoft Smiles with You
Start every day off with a smile and get it over with.
I often wonder what’s going through the mind of someone using a piece of software I’ve worked on. Which parts do they like? Which parts do they despise? How can I find out more about their experience? CEIP and WER give me the data to find out which features customers are using and whether the application is crashing or locking up, but I know that for every crashing bug, someone might run into at least a hundred other issues while using any software program. We want users to feel good about and enjoy the experience of using our products. Despite our best efforts during the design and development process, we know that users often feel frustrated while using our products. But what specifically about our products is frustrating—and, conversely, what do users love about our products?
Emotional response is difficult to measure: Usability lab studies measure user performance on a set of tasks, but given their structured nature, these studies do not reliably reproduce the right context to elicit emotional responses from users. Surveys measure usage and satisfaction but rarely capture how users feel about our products. Site visits and focus groups produce retrospective accounts of users’ experiences, but users are notoriously poor at recalling enough context to relate the details of those experiences.
Emotional responses have always been a challenge to capture because of the difficulty of reproducing the exact context that triggered the reaction. As a result, traditionally little data has been collected in this area. One solution is to ship each software release with a set of electrodes and hardware to monitor pulse rate and a variety of chemical and electrical signals to gauge emotional reaction to using the software. Unfortunately, what I’d expect that we would find is that human emotion is difficult to measure (not to mention that most users probably wouldn’t properly configure the measurement devices).
An alternate method for collecting customer feedback is the Send a Smile program. Send a Smile is a simple tool that beta and other early-adoption customers can use to submit feedback about Microsoft products. After installing the client application, little smiley and frowny icons appear in the notification area, as shown in Figure 13-7. When users have a negative experience with the application that they want to share with Microsoft, they click the frowny icon. The tool captures a screen shot of the entire desktop, and users enter a text message to describe what they didn’t like. The screen shot and comment are sent to a database where members of the product team can analyze them.
External customers who have participated in Send a Smile studies have come to love the tool. They find great pleasure in clicking the frowny icon when something bothers them and are pleased with the fact that they have to do nothing more than click an icon, type a comment in the text area shown in Figure 13-8, click Send, and the feedback forwards to Microsoft. Participants in this program have a direct connection with the feedback program administrator and find out later how much of their feedback influenced a new or changed product design.

The Send a Smile program is relatively new, and not all Microsoft groups are using it at this time. The system does have an enormous amount of potential for gathering customer input. It encourages customers to provide quick, spontaneous feedback at any time. Think about all of the times you have been frustrated with an application and couldn’t do anything but groan about the problem—or the times you were using a new piece of software and were a bit surprised how well it worked for you. Programs like Send a Smile provide users an opportunity to provide this feedback immediately.
Send a Smile Impact
Although Send a Smile is a relatively new program, the initial benefits have been significant. Some of the top benefits include the following:
The contribution of unique bugs. The Windows and Office teams rely heavily on Send a Smile to capture unique bugs that affect real consumers that were not found through any other test or feedback method. For example, during the Windows Vista Beta 1 milestone, 176 unique bugs in 13 different areas of the product were filed as a direct result of Send a Smile feedback from customers in the early adopter program. During Office 12 Beta 1, 169 unique bugs were filed as a result of feedback from customers in the Office early adopter program.
Increased customer awareness. Send a Smile helps increase team awareness of the pain and joy that users experience with our products.
Bug priorities driven by real customer issues. Customer feedback collected through Send a Smile helps teams prioritize the incoming bug load.
Insight into how users are using our products. Teams often wonder which features users are finding and using, and whether users notice the “little things” that they put into the product. Send a Smile makes it easy for team members to see comments.
Enhancing other customer feedback. Screen shots and comments from Send a Smile have been used to illustrate specific customer issues collected though other methods such as CEIP instrumentation, newsgroups, usability lab studies, and surveys.
Connecting with Customers
In my early years as a software tester, I used a beta version of a product called Microsoft Test that came with my company’s MSDN subscription (this product later became Microsoft Visual Test). For a prerelease application, it worked surprisingly well, but l did run into a few roadblocks and had a few questions that I couldn’t answer. As the only tester at my company, my options for feedback were limited, but our CEO had one option for me. Armed with his CompuServe[1] account name and password, I logged on and found a Microsoft forum where I could ask my questions. I had never even called a product support line before and had no idea when (or whether) I would get any answers. I checked in the next day and was surprised to see that I not only had a response, but that I had reasonable answers for my questions and that my suggestions would be considered by the product team. I asked a few more questions over the next few months, and each time someone from the product team responded similarly. Over time, I also learned a lot from reading other testers’ questions and the posted answers. I even remember answering a few!
Today, newsgroups and forums remain a method for customers and Microsoft product team engineers to communicate. The hierarchy under microsoft.public.* contains hundreds of newsgroups with active participation from Microsoft engineers and their customers. Hundreds of other active discussions take place in the online forums at forums.microsoft.com. Nearly another thousand Microsoft employees blog about their products and jobs on http://blogs.msdn.com. Customer feedback received through any of these means is taken seriously and is used to help weigh decisions on fixing bugs and adding or changing features or functionality.
Microsoft Connect (http://connect.microsoft.com) is yet another way for Microsoft employees and customers to communicate, but Connect adds unique and valuable information to the conversation. The goal of Connect is to create a community around product feedback and provide customers with a channel for communication with the engineering teams working on Microsoft products. Customers can report bugs, ask questions, and even make suggestions for new features. The “fun” part of using Connect is that bugs and suggestions can be voted on by members of the community. When a user makes a suggestion or enters a bug report, other people who think the suggested feature would be valuable, or who are also experiencing some pain from the specific bug, can add a “me too” to the feedback report. Over time, the most popular suggestions (and most un popular bugs) rise to the top and help the product team make quick and accurate decisions on what work to do next. All of the bugs and suggestions are searchable, and community members (or Microsoft employees) can offer workarounds or alternate suggestions if appropriate. Figure 13-9 shows the Microsoft Connect user interface for Microsoft Visual Studio and the .NET Framework.

Microsoft Connect offers a few other worthwhile features for customers. Software (including prerelease software for early adopters), white papers, and other information are available for download. Surveys—a great way to ensure that the customer voice is heard—are available and help Microsoft gather input to improve our software.
More Info
For more information about Microsoft Connect, see the Microsoft Connect Web site at http://connect.microsoft.com.
Customer connections—regardless of the method—are much more than just a good thing. They are one of the most critical building blocks of quality software.
Numerous other efforts exist to help Microsoft engineers understand more about how customers use our products. One other significant example is scenario voting. Scenario voting presents to users a description of a scenario and asks them to provide a rating or opinion of the scenario, and optionally offer their opinions on satisfaction and relative importance of the scenario. The engineering team can use the data to capture some of the perceptions of the scenarios in a prioritized fashion and to identify areas where users might be having difficulty and areas that are working well. The scenario voting concept is discussed in detail in The Practical Guide to Defect Prevention (Microsoft Press, 2007).
Summary
Testers regularly refer to themselves as the folks that wear the customer hat, but despite this claim, many testers do not have the opportunity to engage as deeply in customer connection activities as is necessary. One aspect of the test role is that it should provide a natural closeness to the customer and lend unique insight into how customers use and feel about our products. It is vital that test takes a proactive role in customer-related activities.
By using the feedback mechanisms discussed in this chapter, testers at Microsoft can identify missing test scenarios, discover holes in their tests, and create scenario tests deeply based on customer usage patterns. Balancing customer feedback approaches with deep technical analysis through functional testing and code coverage analysis is a critical aspect of creating quality software.