Chapter 14. Testing Software Plus Services
Father’s Day 2007, for a gift I was presented with the hardback edition of The Dangerous Book for Boys.[1] I let my son hold the book and he ran his fingers over the muted red fabric that covered the book. He began to trace the big gold letters of the word dangerous and I saw his eyes open wide and a big grin envelop his face. The book seemed to be calling out, “Read me and the secrets will be revealed.”
The first chapter on essential gear for handling and getting into danger was critically important for us as we assembled our ultimate adventurers’ backpacks. The chapters on knots, fossils, and dinosaurs were all big hits. The chapter I wasn’t too sure about was the one on tripwires, but my son thought this topic was just the coolest ever. I relented, and we went through the material but I was very clear that he was not to set up a tripwire anywhere in the house or his father’s tool shed.
Young boys and danger just seem to be a natural fit. They will find each other no matter what. Having a book like The Dangerous Book for Boys is a valuable tool to help any young boy learn to differentiate between the little dangers and the big ones.
Software Plus Services (S+S) and Microsoft seem to be a natural fit as well. Microsoft has tens of millions of lines of code written for application and server products. These products run successfully on millions of computers and devices around the world. It makes sense to use these products and all the computing power of these devices in an integrated S+S system.
Many books on services-oriented architecture (SOA) and software as a service (SaaS) have been published. I hope you have read at least one book from this category of technology. It is vitally important for anyone working with services to learn the fundamentals from one of these resources.
There is, however, a very big gap in the available reference material for services. No book describes the dangers and risks of developing and shipping an S+S solution. What this category needs is a book with a big red cover and golden letters warning us of the dangers and providing survival tips when testing Software Plus Services.
Two Parts: About Services and Test Techniques
Although this chapter is about testing S+S, it just isn’t possible to dive straight into the testing elements without first covering some background. To make it easier for you, the chapter is broken into two very distinct parts.
Part I covers Microsoft’s services history and our services strategy, and then contrasts S+S with traditional packaged products and SaaS. This section also shows just how much Microsoft invests in services in terms of our datacenters and the number of servers we use to run all the Microsoft services.
Part II is all about testing services. In this section, I focus on some of the variables that can affect a test approach, and then dive deep into some of the new techniques used to test services in an S+S environment. At the end of Part II are some additional thoughts on bugs that I have seen make it into production and some points on how to drive quality improvement even after a service has gone live.
Part 1: About Services
In this section, I review some of the major turning points in Microsoft’s Internet and services strategy. Next, we look briefly at the architecture elements of services. This section helps those new to services to understand some of the basic differences between traditional packaged software and what Microsoft is working to deliver with S+S.
The Microsoft Services Strategy
Software Plus Services is the term Microsoft coined to demonstrate our belief that there is great value in distributed software that integrates the centralization and collaboration of online services while using the processing power and offline capabilities of the more than 800 million computers and billions of smart devices consumers, knowledge workers, and gamers already own.
In a very brief period, services have become a major component of the software ecosystem and many believe they will represent the majority of software usage in the near future. Given this, it might seem odd to have a chapter about services testing near the end of the book and under a section about the future of testing. At Microsoft, we are rapidly evolving our approaches to services testing, and at this level of continuing advancement and innovation, it seemed that the topic fit better with future trends than with the more proven practices covered in the previous chapters.
Shifting to Internet Services as the Focus
In 1995, Bill Gates released a memo that called for Microsoft to embrace the Internet as the top priority for the company. Inside Microsoft, this is often referred to as the “Internet memo,” an excerpt of which follows. With clear marching orders, the engineers of Microsoft turned their eyes toward competing full force with Netscape, America Online, and several other companies ahead of us on the Internet bandwagon.
Within months of the Internet memo, the Internet started showing up in all sorts of products, for example, the Microsoft Office Word HTML add-in that helped the user author and save HTML to the Internet development tool Visual Interdev. For some time, the most popular Internet tool in Microsoft was Notepad simply because it let you quickly read and edit raw HTML.
Ten years later, a new memo rose to the forefront. The “Services memo,” which follows, was sent to all employees in October 2005 by Ray Ozzie, our new Chief Software Architect. Microsoft had been in the Internet services business since the launch of MSN a decade earlier, but this new memo talked of a world of seamless integration and harnessing the power of services over the Internet. From this memo, we have refined the strategy to be Software Plus Services, and it represents our strategy around desktop applications and the Microsoft Windows operating system working seamlessly with online services as well as our use of SaaS and Web 2.0 technologies.
In an S+S strategy, the Internet is at the center of all implementations, but the list of supported clients is much longer than a pure online-only SaaS approach. S+S uses computing power on PCs and mobile devices that are already at the user’s fingertips.
Around the time this book is released and for several quarters after that, Microsoft will be launching waves of cloud services. A cloud service is any service on the Internet that another service builds on top of. Recently, we announced the launch of our new cloud infrastructure platform under the new product name Azure Services Platform. (See www.microsoft.com/azure for more information.) Azure (or RedDog, as it is known among bloggers) will be a cloud service for developers to use for basic functions such as computer power through virtual machines and cloud storage. Live Mesh is a component of the Azure live services that helps users synchronize data across multiple computers and devices such as smart phones.
These advanced cloud services are changing the way developers write and run services and will further change how we test services. Companies such as Smug Mug and Twitter report massive cost savings by using the Amazon Simple Storage Service (S3). They have also had to deal with service outages when S3 goes down.[2]
Growing from Large Scale to Mega Scale
In 1994, Microsoft launched the Microsoft Network (MSN). MSN grew rapidly, becoming the second largest dial-up service in the United States. We even had an advertising campaign that marketed MSN as the Internet without training wheels. This was of course a jab at our much larger rival service AOL.
Even as the second largest service of its kind, MSN was big with thousands of production servers. We had outgrown our first datacenter, named Canyon Park, and were rapidly filling our second datacenter, called Tuk1. The MSN teams had a lot of top-notch best practices for developing and shipping a dial-up client, services such as e-mail and Internet connectivity. There was still a lot to learn outside of our areas of expertise. The breadth of just how much there was left to learn was brought home when, in 1997, we acquired both WebTV and Hotmail. In my opinion, these acquisitions accelerated our move from being a large-scale dial-up service to being a mega-scale provider of Internet services.
I had the great fortune of being one of many engineers that flew down to Silicon Valley to learn from WebTV and Hotmail. These companies brought with them many brilliant engineers and introduced us to all sorts of innovative concepts for running large-scale services. From those meetings I took two key concepts.
The first from WebTV was the concept of service groups. Service groups are units of production that function largely independently of each other. A service group is a unit of production scale as well as a unit of deployment for the next upgrade. Service groups also provide buffers from site-wide outages. If a single service group goes down for some reason, it should in theory not affect the other service groups.
The second concept was field replaceable units (FRUs) from Hotmail. They would brag, and justifiably so, about the number of computers they had in production and how cheap they were. These computers quite literally were motherboards with a hard drive and power stuck on a flat tray. Computers ran much cooler and at lower power back then, so the central air-conditioning of the datacenter was sufficient to keep the machines cool without any cases to cover or direct the airflow.
Inside Microsoft, the concept of service groups evolved into the scale group concept that retains the notion of service segmentation but also includes purchasing increased capacity as a single large order. Field replaceable units have become known as commodity hardware to emphasize buying large numbers of inexpensive servers.
Although these concepts are still in use, they are being challenged by a vastly higher rate of growth than we have ever seen before. Microsoft now adds an average of 10,000 computers a month to our datacenters just to meet the growing demands of the users of our services. Even scale units and commodity hardware are insufficient to deal with that level of purchasing and production installation.
A few years ago, we started purchasing servers in what we called rack units or rack SKUs. These were tall racks fully loaded with servers. Roll the rack off the delivery truck into the datacenter, hook up all the cables on the back side, power it up, and off you went. That innovation dramatically improved the efficiency of our procurement and installation pipeline. Unbelievably, rack units are no longer fast enough.
Containers filled with preconfigured, ready-to-run servers are being touted as a quicker, more modular way to expand datacenters on the fly
Microsoft and Sun Microsystems both may claim to have pioneered the ‘datacenter in a box’ concept, but Microsoft appears to be the first company that is rolling out container-based systems in a major way inside one of its datacenters.”[3]
Recently, we built out an entire datacenter based upon the concept of the container. A container SKU is a fully loaded and production-ready cargo container that can be shipped on a truck or a train, as shown in Figure 14-1, hoisted off the flatbed with a crane, and positioned on the floor of the datacenter. A few massive cable bundles come out of various panels; when they are plugged in, suddenly there are hundreds of servers ready for production use. Years later when the servers are starting to fail at a high rate, the container is taken out of production, shipped back to the manufacturer, recycled, and updated with new equipment.

Just getting all the hardware in place to support our Software Plus Services strategy forced Microsoft to develop world-class logistical planning. Product engineers are constantly interacting with the procurement specialists to ensure that the right equipment is in place at the right time. The overhead of managing orders is decreasing and will eventually be fully eliminated.
The numbers in Table 14-1 are based upon recent history and projections for the near future. We are constantly dealing with the growth that comes through acquisitions. At the time of this writing, Microsoft is not going to buy Yahoo, but if we do a major acquisition like that later, expect these numbers to change dramatically.
Number of servers | On average, Microsoft adds 10,000 servers to its infrastructure every month. |
Datacenters | On average, the new datacenters Microsoft is building to support Software Plus Services cost about $500 million (USD) and are the size of five football fields. |
Windows Live ID | WLID (formerly Microsoft Passport) processes more than 1 billion authentications per day. |
Performance | Microsoft services infrastructure receives more than 1 trillion rows of performance data every day through System Center (80,000 performance counters collected and 1 million events collected). |
Number of services | Microsoft has more than 200 named services and will soon have more than 300 named services. Even this is not an accurate count of services because some, such as Office Online, include distinct services such as Clip Art, Templates, and the Thesaurus feature. |
Power Is the Bottleneck to Growth
The average datacenter costs about $500 million to construct. What we have found over the years is that Moore’s law still applies to computers: Approximately every 18 months the processing power doubles. The amount of effort it takes to run and cool a single server has also continued to climb.
The power needs of the newer production servers start to draw power unevenly. Major power upgrade projects need to be implemented until the infrastructure reaches its maximum capacity. At that stage, the only option is to redesign the infrastructure and plan a window of time to literally rip out and rebuild the majority of the power infrastructure.
Power is so critical to the operation of our services that we work closely with Intel and various original equipment manufacturers (OEMs) to design servers that are better optimized between power consumption and performance. For example, an OEM, which is optimizing for a lower cost server, might pick a standard power supply that uses more power than is actually needed. This makes the cost to build the server lower, but the long-term cost of running the server in one of our datacenters is higher. We strive to ensure that we use more low-power components in the servers and that the system is well tuned so that we do not waste power.
Services vs. Packaged Product
Packaged product is essentially any software product that can be purchased on CD or DVD. Inside Microsoft, we tend to refer to these products as shrink-wrap software. For Microsoft, shrink-wrap also includes product versions you can have preinstalled on a computer or downloadable versions that you run on your computer.
Note
Shrink-wrap, also shrinkwrap or shrink film, is commonly used as an overwrap on many types of packaging: CDs, DVDs, software. It is polymer plastic, and when heat is applied to this material it shrinks tightly over whatever it is covering.
In recent years, the notion that all products are either services or shrink-wrap has blurred. Some Xbox games are bought in a store, but users can play against each other on Xbox Live and download extra levels. Microsoft Office Outlook is a very popular e-mail client for the Windows Live Mail (WLM) service. Microsoft Expression is a product that can be purchased in a store or over the Internet and is a tool that helps Web site owners rapidly develop rich content-driven Web sites, but it was also built in anticipation of users being connected to the Internet so that they can download additional content and add-ins. Even though all of these products have service components they are usually purchased through a retailer or PC manufacturer, so we consider them to be part of the shrink-wrap group.
Note
In 2005, several of Microsoft’s major online services such as Hotmail and Passport were renamed to include the Windows Live brand. Hotmail is now Windows Live Mail (WLM), and Passport is now Windows Live ID (WLID). Users with a Hotmail account do keep the @hotmail.com address despite the change in the name we call the service.
There are many different names for a Web service. Some common terms are Web service, Web site, Web property, and online service. Generally, inside Microsoft we call our services by the team names such as Xbox Live, Search, Windows Live ID (WLID), Spaces, Sky Drive, and Office Live Small Business (OLSB). In some cases, such as for OLSB or Xbox Live, it would be better to call them a collection of services. OLSB offers public Web sites, private Web sites, Web site management, short message bridge to cell phones, business e-mail, and other services such as contact manager and ad manager as add-ons. Each subservice can be consumed by another service; for example, OLSB is sold with Dynamics Live or CRM Online. Xbox Live has its own on-demand video download services as well as tournament services.
In the February 11, 2004, notes of the W3 working group for Web Services Architecture Requirements, web service was defined as follows: “A Web service is a software system identified by a URI [RFC 2396], whose public interfaces and bindings are defined and described using XML. Its definition can be discovered by other software systems. These systems may then interact with the Web service in a manner prescribed by its definition, using XML based messages conveyed by Internet protocols.”
This is a fine definition, but some Web sites that many consider to be Web services have little to no XML. For the latest notes and changes to definitions, visit http://www.w3.org/TR/wsa-reqs/.
S+S Example
Consider the Windows Live Mail service as an example. WLM is by far the largest e-mail service in the world with hundreds of millions of active users. Part of the appeal of WLM is its reliability but also its support for multiple client experiences. WLM works with many different Web browsers, the Microsoft Office Outlook client, the Windows Live Email client, Mobile smart phones, and desktop applets that alert users when new mail arrives in their inbox.
The down-level browser experience is more like a SaaS experience. SaaS is largely about using a service while connected to the Internet. It does not have an offline capability. In SaaS, a large portion of the processing takes place on the servers in the cloud with the client usually providing just rendering of the user experience.
Note
Down-level (downlevel) browser is a term used in Microsoft as well as on Web development sites. One strict definition of down-level browser is a browser that supports only HTML 3.2 or earlier versions. Often the term is used more generically for older browser versions that are missing key features such as cascading style sheets or JavaScript and that do not present the best user experience on a Web site.
Web 2.0 tends to rely upon newer browsers, Flash, or Microsoft SilverLight for a rich browser experience where the processing is largely shifted from the servers in the cloud to the desktop computer. A Web 2.0 client might also have offline capabilities.
S+S moves the processing to the place that makes the most sense for the user and the user experience. For rich clients such as Outlook, the majority of the processing happens on the user’s computer. Similarly, with smart phone e-mail clients, the phone handles the majority of the processing. S+S also emphasizes the ability to work offline as well as the capability to have clients that bridge internal and cloud services as we see with the Outlook Connector that can read corporate email and a personal account in one integrated experience. In the near future, servers will run in a hybrid mode, seamlessly integrating corporate servers with cloud servers and extranet services.
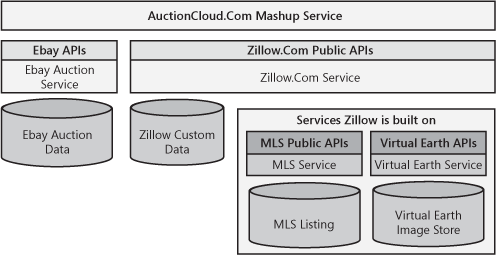
In the WLM example, down-level browsers are examples of SaaS, and Outlook, Outlook Mobile, and the WLM rich e-mail client are examples of S+S. The last element of this example shows how services are no longer stand-alone. For example, in the case of WLM, authentication (when a user enters a valid user name and password) is provided by the Windows Live ID service. This concept is discussed later in the section titled "Moving from Stand-Alone to Layered Services.”
With S+S, compatibility goes far beyond just various browser versions and may include dozens of different clients, as shown in Figure 14-2. Additionally, high availability, scalability, strong security, and trusted policies and procedures for maintaining privacy are more critical than they are even in enterprise scenarios. From a test perspective, this means that quality is deeply tied to features, architecture, and most uniquely with services and the procedures for running and maintaining them. At Microsoft, test plays a big role in driving these issues deep into the product and ensuring proper implementation. Test even evaluates and in many cases directly tests the underlying policies for running a service.

Moving from Stand-Alone to Layered Services
In the very early days of the Internet, many online sites were mostly self-contained. One exception might be credit card processing services that from the very outset had multiple retail and online endpoints. Beyond that, most other services were developed and run as independent services. In many respects, every online property was like a complete single-family home: It had floors, walls, roof, electrical wiring, and plumbing. Each service had to build every component to include mechanisms for signup, authentication, customization/ personalization, storage, deployment, and reporting.
With layered services, building a new service is now much easier than, say, building a complete dwelling, but it is still challenging. By comparison, launching a new service in today’s world is probably comparable to remodeling a bathroom. Platform services from Microsoft and competitors will continue to expand and provide more of the infrastructure for new services. A service can even mix and match across infrastructure services from multiple companies for best of breed solutions. As platform services evolve, developing and launching a new service should become as simple as painting an empty bedroom.
Currently, most consumers perceive online sites such as Amazon.com and eBay.com to be stand-alone services, but these sites do contain modules and layers. In the case of eBay, the PayPal service was an acquisition that was then deeply integrated with the eBay auction service while still allowing other services to use it. In the case of Amazon, on rare occasions some services such as customer reviews or the section showing what other customers have purchased don’t populate, but the product you click still comes up for purchase. This happens because each of these features is a separate module running on separate servers. If they do not respond in time, the page loads anyway. Through layering, these services can ensure that the main user experience is functioning even if some subcomponents might not be working properly. It also allows for each layer to innovate on its own schedule without creating dependencies on other teams and their features. Figure 14-3 shows a simplified view of how services can be layered.

In many respects, the strategy for testing a stand-alone service is easy: Test every part of the service and its subcomponents, test every integration point between all those parts, and test end-to-end scenarios that run through the system. It might sound silly, but when you own it all, you can control what changes and when it changes. Managing risk caused by change is therefore more easily controlled.
It took many years to migrate Window Live Mail (formerly Hotmail) from its homegrown authentication service to one shared across all Microsoft services, but it did happen. All (well, actually almost all) services, including WLM, now use the WLID service for authentication.
Layering and integration are adding significant complexity to building and running services. As we move further and further down the S+S path, the number of clients and how they interact with multiple services increase the compatibility testing matrix. Add to this dozens of mashups developed by third parties that interface with public APIs of multiple services to create a new user experience, and the integration map becomes massive.
Note
A mashup is a Web application that can combine data or user interface (UI) from more than one source into a single integrated service or application. For example, Zillow.com is a service that combines data from the Multiple Listing Service (MLS) for real estate sales, its own data generated by users, and the Microsoft Live Earth service for mapping the data.
Layering is the approach Microsoft takes for developing all its services. Many new start-up services are using infrastructure services from Microsoft and other companies. In Part II of this chapter, I discuss techniques for testing Software Plus Services with special emphasis on services testing in a layered multiservices ecosystem.
Part 2 Testing Software Plus Services
Part I of this chapter covers a great deal of information about services including Microsoft’s history with services, how big a bet services are for us, what S+S is, and how it differs from other paradigms we have used previously.
In this part, I provide a general overview of some test techniques for services, and then describe a handful of very specific but different approaches to testing services and clients with services.
Like many of the examples in the earlier chapters, the examples in this part are from Microsoft and tend to be about big software projects or, in this case, big services. Even though the examples are drawn from Microsoft, the techniques can and should be applied to projects of all sizes.
Waves of Innovation
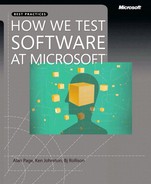
In researching this chapter, I found several articles that talked about waves of innovation in PC computing history. Here is a list of innovation waves through which Microsoft has lived and competed:
Desktop computing and networked resources
Client/server
Enterprise computing
Software as a Service (SaaS) or Web 1.0 development
Software Plus Services (S+S) or Web 2.0 development
We are clearly just beginning this newest S+S wave of innovation. With each of these waves, software testing has had to evolve to meet new challenges. Most of these challenges have been around the growth in the number of users and user scenarios along with the number of different clients and supported environments, as shown in Figure 14-4. With each wave, complexity has increased and the overall test matrix has grown. The challenge for testing is that the matrix never shrinks. With each wave, most old tests carry forward and many new tests are added.
Microsoft started with the desktop wave with MS-DOS and the Basic programming language. We built Windows on top of DOS and moved into the networked PC realm. With each wave, we have evolved our testing. We have developed many new processes to help us better deal with the exploding test matrix of both SaaS and S+S testing.
Designing the Right S+S and Services Test Approach
It would be fun to write the Dangerous Book for Software Plus Services. I see it coming bound in black leather with silver lettering and would have a lock on it but no key. Readers would have to figure out how to pick the lock if they want to read the secrets within. The reason for the security is that if I wrote it, I would have to share all the mistakes I have made while developing, testing, and shipping services.
They key to success in testing services is to be fully aware of the dangers and craft your test approach to mitigate those dangers. This section discusses several factors that affect the design of a good services test approach.
Client Support
For many years, testers at Microsoft have had to update their list of browsers to be used in testing for every release. These matrices usually include the most recent version of every major browser and previous versions of those browsers that still have sizable market share.
In an S+S environment, you don’t just have a browser matrix for testing but also a long list of client applications. For example, for Windows Live Mail we have all the browsers for the Web interface but we also have versions of Outlook, Outlook Express, the new Windows Live Mail client, and various mobile devices. Additionally, we have all the other matrixed complexities around operating system version, language, and regional settings that come with any shrink-wrap test project.
The key to keeping the test permutations for clients under control is not quite the same as a straightforward equivalence class exercise, but it is close. Review market share for supported browsers and clients, compare that to business goals by markets, and add in some operating system market penetration. A product team should then choose which combinations to officially cut from their supported list, and then prioritize among the remaining list. The highest priority combinations are candidates for much deeper and frequent testing whereas the remainder can be covered with a tightly controlled set of basic compatibility tests.
Built on a Server
The great opportunity for Microsoft in our S+S strategy is to use our rich desktop clients and our enterprise servers in the services world. In some cases, a service is built from the ground up using a much stripped down version of the Windows Server operating system and in some cases a simplified Web server. Many of our enterprise server products such as Microsoft Office SharePoint Server and Microsoft SQL Server provide the core technology for a service.
When a service is built on a server product, there has already been a lot of testing on that product, so we don’t need to retest core functionality. However, two areas in particular do need substantial focus.
The first (and most obvious) is the integration of the new code written on top of the server and the interaction between the service and the server. The majority of the early bugs will be around basic functionality and in the public APIs of the server product. As the code stabilizes, we often start to find issues around performance and diagnosability between the new Web service components and the underlying enterprise server product. One example is when a lock occurs on an object that wasn’t designed to deal with multiple simultaneous reads or writes. Scenarios like this are often considered by design for an enterprise offering, and the cryptic error messages presented when something like this happens can often be difficult to use in diagnosing the root cause.
The second area is testing the server product itself for manageability and scalability in a large-scale datacenter environment. In many cases, we deploy and configure the enterprise server product so that it functions at Internet scale. Often additional work is needed to make the remote maintenance of the server fully automated so that no person needs to enter the datacenter and touch the actual computer. Improvements in these areas can lower operational expenses and help a service become profitable. In these scenarios, test focuses on not just finding bugs but finding improvements to drive into the server product for future releases.
Platform Services vs. Top-Level Services
In Part I, Figure 14-4 shows how Microsoft’s services are becoming more and more layered. We know this is also true of many of our major competitors. This approach of building services on top of each other is not unlike that used in building the layers of an operating system or even the Open Systems Interconnection Basic Reference Model (OSI model) for networking. Lower down in the stack is where you will find critical platform services such as WLID. The branded services such as Office Live that directly generate revenue are much higher in the stack. Behind the Virtual Earth service (maps.live.com) is a series of infrastructure services that take all the satellite and low-level flyover photos and turn them into tiles.
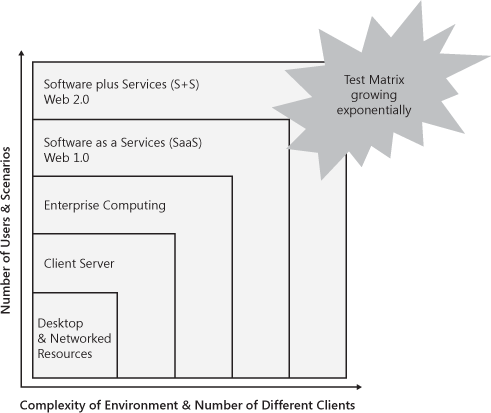
Figure 14-5 shows a conceptual example of the AutionCloud.com mashup that integrates eBay with Zillow. Zillow is itself a mashup of several other services. As the stack becomes deeper and ownership is spread across multiple organizations and companies, debugging problems in a service can become ever more complex. .
Deep down in the stack we eventually get to platform (sometimes called foundation) services. PayPal and credit card processing are common platform services for e-commerce sites. Authentication services such as WLID are also platform services. Testing of a platform service requires an internal focus. It can be a lot like having a public API: You know many developers will write to the API and use nearly every feature in the API, you just don’t know exactly how they will use it. The test effort for a platform service focuses on the entry points to the service. After verifying an API’s internals, a good test approach is to have the API tested in some number of real-world integration scenarios but not all of them because that would be impractical if not outright impossible.
In the case of platform services, the focus is also on internal consistency testing over integration testing. In higher level services, integration testing can become the primary focus.
In the case of a service higher up in the stack, the test effort for that service would spend a great deal of time focused on testing specific integration scenarios with all platform services but not the platform service itself. The degree to which a higher level service must test against a platform service depends upon the level of coupling between the two services.
Loosely Coupled vs. Tightly Coupled Services
This section could easily have been titled “Loose Dependencies or Tight Dependencies” except that coupling for services combines the elements of good object-oriented design with organizational coupling. Doug Kay addresses this topic in his book Loosely Coupled: The Missing Pieces of Web Services(Rds Associates, 2003). In this book, he covers many of the project management dependency elements of coupling across services.
The reason coupling is both a project management and a design element for services is directly related to the rate of shipping. Layered services are constantly taking on new dependencies and changing existing dependencies with every release.
Note
In computer science, coupling or dependency is the degree to which each one program relies upon another. Loosely coupled systems are best when either the source or the destination program is subject to frequent change.
Ideally, services should be loosely coupled. Loose coupling is a term used often in software design to describe an interface, component, or system that makes minimal assumptions about the dependent systems. The lighter weight the dependencies between services are, the more each can independently innovate and ship. In this sense, coupling affects a software project as a dependency management challenge. The tighter services are coupled, the more project management overhead needs to be applied to ensure that the resulting user experience is high quality and valued. The following sidebars are two examples, both of which come from Windows Live ID.
Of these two scenarios, loosely coupled clearly provides more flexibility and self-determination for both services. Even in Microsoft, tightly coupled, co-development scenarios are hard to manage. Doing a project like this with multiple companies over the Internet is even more challenging.
Many of our sites integrate with external companies. One example is credit card processing. We take credit cards that are processed through services on the Internet, we also take PayPal for payment, and we might integrate with many retailers’ extranet Web services. The loosely coupled projects, the ones that have well-defined interfaces, shipped on time. The very tightly coupled projects often bogged down and seemed as if they would never ship.
Every one of these non-Microsoft organizations is continuing to evolve their service in parallel with our own development efforts. Tightly coupled services have a hard time testing without a current instance of the platform service. A loosely coupled service can often stub out calls to other services or use emulators. (See the section titled “Integration Testing vs. Test Flags and Emulation” later in this chapter.) This allows testing to continue without an instance of the other service. Integration testing is still done, but the testing of the core functionality of the service is not blocked.
Stateless to Stateful
Stateless services are those with very simple, fast transactions that do not need any data stored. The less state a service has to maintain, the more failures it can experience with any component while continuing to provide a good user experience. An example of this in software might be Outlook sending an e-mail message. If the message fails to go out on the first try, Outlook tries again later. The user rarely notices.
When a service takes a long time to complete a transaction and needs to store unique user or business-critical data, it is considered to be more stateful and thus less resilient to failure. Compare stateful to working on a Microsoft Word document for hours, and then experiencing a crash just as you are trying to save the file. It might be a single crash, but the impact on the user is dramatic.
Stateless Services
A basic Internet search is a great example of a relatively stateless service. Each search query completes and renders results usually with subsecond responses. For any large sized search engine, the index that powers the service is updated every hour of every day and is replicated across multiple datacenters. Even though the index might be stateful, losing a single instance of the index is not going to cause irreparable harm to a user. At most, a few search queries will fail to return results until the bad index is pulled out of rotation.
Stateful Services
CRM Online and Salesforce.com are examples of services that are very stateful. These services help small to midsized businesses automate their sales process and customer support over the Internet and allow them to interact directly with their customers. They usually store business-critical data such as a company’s contact list, copies of quotes, and copies of final contracts. A user of the service can open a quote template and spend an hour filling it in before saving and sharing it with a customer. A marketing campaign might run for months. In these types of services, user activities and transactions cover a greater period of time. The data in the system lives on for a long time. Resiliency down to the smallest component as well as disaster recovery take on much more critical roles in determining quality.
Time to Market or Features and Quality
For any software product or IT project, quality and features must be balanced against time to market. The challenge in the commercial services space is that the first mover (the first company in a category of service) can become the de facto standard in a very short period of time. Services for e-commerce, auctions, posting videos, and social networking are dominated by a handful of early successes. The list is short and we can all name them: Amazon. com, YouTube, eBay, Facebook, and MySpace have all benefited from early releases and rapid follow-up. Unseating an incumbent service can be much harder than developing and launching the next big breakfast cereal.
Friendster launched in March 2002 and is considered the first major social networking site. MySpace and Facebook came along several years later, but when they launched, they changed the game. Self-promotion in social networking became acceptable. These services were able to leap frog the first-mover advantage of Friendster and move dramatically ahead.
Testing strategy needs to consider the state of the market and be crisp and very clear about the quality bar for launch. Sometimes faster time to market is the right call, but I must say that in my experience it can take years to get operability, manageability, and overall high quality back into a low-quality service after it has launched. If possible, I push for as many features in these areas as I can get while still helping to find ways to get the service launched and into the market quickly.
Release Frequency and Naming
Hand in hand with time to market for a major release is what happens after that release. Often a service will launch with beta attached to its name. One prominent example was the GMail service that spent three years in beta. This allowed the service to weather the discovery of many major bugs without losing much customer loyalty.
Note
A service with beta in the title is clearly indicating to users that there are bugs in the service, but that there is enough functionality to start allowing users access.
Another technique teams use is to plan releases to follow quickly on the heels of a major release. The monthly or quarterly release process means that any bug found but not fixed in the current release will not wait too long before it is fixed. As a tester, it can be OK to allow a bug in an edge case to ship into production as long as you know a fix is coming. If the bug is known and so bad that it should be fixed within hours of a release to Web (what we typically call a hotfix), I recommend holding the release until the fix is made in the main source sent to production.
Testing Techniques for S+S
After careful consideration of all the design, naming, and business factors that influence your test approach, it is time to pull together the right set of techniques to drive the testing process. This section digs deeper into the different techniques that services require and gives some solutions to the dangers raised in the Dangerous Book for Software Plus Services.
Fully Automated Deployments
For just about every product Microsoft develops, we have a daily build. (See Chapter 11.) The moment the build drops (finishes compiling and is propped to a share on a server), automated scripts take over, install the software on test computers, and then run thousands of tests. This is true for games, servers, mobile devices, and desktop applications. This is not always true for our services, though.
Many Microsoft services test teams have started to measure time from build complete to first deployment complete. This is covered in more detail in the section titled "Performance Test Metrics for Services" later in this chapter.
If you’ve ever had a private build from a developer with release notes saying, “Copy this file here, add this to the configuration file, and register this .dll,” you know this takes extra time and is very error prone. A complete setup routine is the key to unlocking the ability of test to install a product quickly and run tests. Deployment is the same way for services and needs to include fully automated deployments from a one-box to a multiserver test configuration and to full production. (See the section titled "The One Box" later in this chapter.) The code for deployment to these various environments must be the same and the variations driven by the input XML.
The sad reality for services is that many product engineering teams see deployment as something that needs to happen just once, for the final build deployed to the production servers. When teams make this mistake they delay writing any code for deployment until late in the product cycle. This code is not data driven, it won’t be complete, and it won’t get tested. Deployment needs to be staffed and tested like a first-class feature.
Operations engineers tend to love these next three tips. As testers, we should try to file the bugs first.
Tip
If operations has to do anything more than double-click an icon and wait for the green light to come back saying the deployment completed successfully, there are still bugs in the deployment code. They might be design bugs, but they are still bugs.
Tip
If the deployment guide to operations has any instructions other than, “Go here and double-click this file,” there are bugs in the deployment guide.
Tip
If there needs to be more than two engineers in the room to ensure that the deployment is successful, there are design flaws in the deployment code and the deployment guide.
Fully automated, data-driven deployments are the foundation that unblocks all other testing, and they must be the top priority.
Note
With the release of the Windows Server 2008 operating system, the performance of virtualization has been significantly improved. Virtualization, or virtual machines, is quite literally running another completely separate instance of the Windows operating system in the operating system that loads when a computer is turned on. We are starting to see significant increases in the use of virtual machines as the way to deploy and run many Microsoft services. In the next few years, this will likely become the most common method for rapid and fully automated deployments.
Test Environments
Whether the testing is focused on services, clients, or the integration of clients and services, getting the test environment just right is a critical element. A test environment that is too different from the configuration that will be run in final production can miss many bugs. A test environment that is so exactly like production that it is production can cost too much to build; if built, it will funnel all testing to a single environment.
Most services test teams in Microsoft run many different types of test environments, and each helps facilitate effective testing for different classes of defects. The key to defining and using different test environments effectively is understanding the service architecture and integration dependencies. By defining and mapping test processes in the early stages of a project, a test team can maximize their test hardware and mitigate risk with proper testing in the optimal environment.
The One Box
Sometimes the one-box test platform is called a single box, a single OS, or the one OS test environment. Mostly, it is just known as the one box. When working to integrate with another team’s service, the new team often asks whether the platform team has a one box that they could use in their testing.
To my knowledge, at Microsoft, the term one box started with the MSN Billing 2.0 team back in 2002. When the team deployed the 2.0 billing system it was to a new set of computers and the data in the version 1.0 system was to be migrated to the new computers. It was a big project with an absolute cannot-slip schedule or MSN would have missed the holiday shopping season. Deployment was one of the last features coded. Many of the deployment steps were never automated, so the team produced a massive deployment guide with step-by-step instructions. This document was called “the paper deployment wizard.”
I will say this much about the wonderful idea of the paper deployment wizard: The words paper and wizard should be eternally banned from use together.
Days and hundreds of hand-scrawled notes on the printed copy of the deployment guide later, the deployment finished. There was no major ah-ha moment for one person or even a keen insight that just a few individuals had. In this case, it was blatantly obvious to every single person on the project that deployment had to be a first-class feature that was tested every single day along with all the other feature tests.
The Billing 2.0 team dedicated resources to developing an XML-based tool that developers, testers, and operations engineers could use to run deployment quickly and easily in multiple environments. With this data-driven tool, they were able to define deployments that would install and configure sizable amounts of service functionality on a single computer. This configuration became known as the billing one box, and the term has grown from there.
With the increasing popularity of using virtual machines (VMs) on Windows-based systems, I constantly have to point out that the one box test environment is not so much about a single computer as it is about a single operating system test environment. Developers have often said to me that they have a one box in their office running a 10-VM topology. That is not a one box; that is a test cluster on a single computer.
For Microsoft testers, a one box is a single operating system instance of a major amount of service functionality that can be used to execute tests against. We have a one box instance of WLID and a one box of our internal subscription billing system. Each of these services runs on hundreds of servers in production, but we can also make it all run on a single computer, even a laptop.
The one box is critical to allow developers to run unit and pre-check-in tests. It is vital for running BVTs and massive automation suites in parallel. The one box allows for increased agility simply because it is quick and easy to build out, tear down, and build again. An environment like this is essential for rapid turnaround scenarios such as the regression of a simple string change bug.
Next to fully automated deployments, the one box is the most vital test requirement of any service.
The Test Cluster
Fully automated deployments that are data driven are the first requirement for testing. By taking advantage of the data-driven aspect, we can have production deployments scaled down to a one box. The next step is to have those deployments automated for scaled-down versions of production known as test clusters. A test cluster is usually a scaled-down version of production with an instance of each server by role, as shown in Figure 14-6.
The term machine role refers to the purpose the computer fulfills in a service. A simple service such as search could have machine roles such as crawlers that go out and crawl the Internet for content to index, indexers that build key word indexes off the content, and query servers that take the search request from users and pull results from the index servers.
In a test cluster, we are not looking to find bugs in the core logic of the service but instead focus on finding bugs in cross-server transaction. Quite often, a service such as Microsoft Internet Information Server (IIS) will be able to query a local Microsoft SQL Server because they are both using the same account with administrative-level permissions. When services are split across computers, we can find performance, permissions, and other configuration bugs that would not show up in any other environments. The key is to use the one box for everything you can, and then use test clusters for those specific tests a one box would hide.
The Perf and Scale Cluster
Simple environments such as the one box can be used to conduct performance profiling tests and even page load time tests (covered later in this chapter). The perf and scale cluster is used for conducting a different type of system-level test. In the services world, when components are spread out across computers, various components become bogged down before others do. Performance testing for services is often about finding the right balance of hardware to produce an efficient and performant system.
Another challenge with services is that they can become bottlenecked as they are scaled up or out. The term scale up is commonly used to refer to an increased amount of data in the system. An e-mail inbox with 10 e-mail messages will behave very differently from an inbox with thousands of messages in it. Many services will either begin to perform slowly or will just stop working altogether because the amount of data grew beyond what was expected or tested for.
Scale out refers to a service being able to increase capacity by adding additional computers. The scale unit approach discussed earlier in this chapter helps create logical purchasing and production units for a service so that it can continue to scale out. The goal of scale out is really about identifying how best to configure the number of servers of each type, the configuration of the hardware, and the configuration of the operating system to maximize the output of the whole system at the lowest cost. This testing is useful in producing early capacity models.
Both performance testing and scale testing are hardware-intensive activities. Other tests such as load tests analyzing mean time between failures (MTBF) can benefit from being run on production-grade hardware configurations. (See Chapter 11 for more information about MTBF testing.) Because these types of tests have many similarities and all benefit from execution on a large production-like test environment, most teams run them on a single set of shared hardware.
The Integrated Services Test Environment
In a world of layered services, there are always bugs to find during integration testing. The timing and approach to this testing depend upon the degree of coupling between two services. The more loosely coupled two services are, the less need there is to do real-world integration testing.
TellMe, which joined Microsoft in 2006, also used the concept of the integrated test environment so that their integration partners could develop and test against the TellMe service. They called it the green zone, and it was very successful in the early days of the service when things were changing rapidly and many features were in co-development.
Although INT is a great tool for testing multiple-service integration early in a project, it does come with two key risks.
The first problem with INT testing is that it is not and never will be exactly like production. Many testers say they need to get their code into INT so that they can test it in a production-like environment. That’s just the point—it is production-like, but it is not production, so bugs will be missed.
The second problem with INT testing comes when the shared test cluster (covered earlier in this chapter) is brought into the INT environment. In this case, a shared test cluster is pointed toward INT and all the testers run their tests there. The challenge arises when INT goes down. By definition, INT is not the final build of any service, so it will be more unstable and will experience greater downtime than production. If a team puts too much emphasis on testing against INT, they will find themselves being constantly blocked and falling behind schedule.
If the project is one of multiple tightly coupled and highly integrated services or even one with deep integration with client applications, an INT test environment is needed. The key to success is to make sure the INT environment has a well-established, reasonable quality bar and that all test teams have an option to run tests even when INT has a major outage.
Testing in INT is a powerful testing option. The key to successfully using INT for testing is to ensure you can complete a substantial amount of your services testing without an INT environment.
The Deployment Test Cluster
I have already discussed the importance of fully automated deployments as a key feature to unblock testing. The one box helps developers and testers work independently and is usually part of pre-check-in tests for any service. Those tests, however, do not ensure that the deployment code will work on a multimachine test environment. That is where the deployment test cluster comes in.
A deployment test cluster is similar to production in terms of the number of computers found in a scale unit. Because deployment testing is not about tuning for hardware, the tests can be run on a set of very inexpensive computers (commodity hardware) or as a set of virtual machines. I recommend the virtual machines for maximum flexibility.
Deployment tests focus on two areas:
Ensure that the deployment code and any new features are working as expected for a production deployment. In this case, the software is either connected to the INT test environment or to the live production site of a service. In some cases, emulation or test flags (covered next in this chapter) are used but are not preferred. These tests ensure that not only the deployment of the service code is automated, but the connectivity to platform services is also automated.
The deployment test environment is ideal for working on service hardening. With a default installation of Windows Server (or any enterprise server), often many services are installed that won’t be needed in production. A deployment environment can be used to turn off and uninstall unneeded components systematically. This is often considered a type of security testing, but it is still best conducted in a deployment test cluster.
If the deployment test cluster is built with commodity hardware or through virtual machines, it should not be a very expensive test environment. The value of having a place to run deployments over and over again while experimenting with configurations is very beneficial in testing any service.
Test Environments Summary
Different types of tests are best run in optimized environments. The goal of splitting up all these tests and test environments, as shown in Table 14-2, is to find the right set of bugs in the simplest test environment as quickly as possible. Most testing will occur on the one box or in a test cluster, but all the environments serve a critical purpose in testing and releasing a new service or a major upgrade to an existing service.
Test environment | Primary test focus |
One box | Pre-check-in test |
Basic functionality tests | |
Test automation authoring | |
Large automated test suite parallel execution | |
Quick deployment validation | |
Page load time | |
Test cluster | Full functional test passes |
Full automation test suites | |
Validates service components interoperating across the network | |
Failover testing | |
Perf and scale cluster | Core performance testing across the network |
Scale-out and scale-up limitations | |
Early capacity planning verification | |
INT environment | Multiservices end-to-end integration testing |
Deployment test cluster | Large cluster of computers or VMs dedicated to running and improving deployment code and validation tests |
Integration Testing vs. Test Flags and emulation
As mentioned earlier, services no longer stand alone; they are usually built on platform services and need those services in place to be fully functional. With all these dependencies, the integration points of services must be tested in a manner that allows each service or layer of a service to maintain its own ability to innovate independently. Integration testing and test flags and emulation are techniques to help with this challenge. The selection of the right technique is driven by the degree to which the services are coupled, as shown in Figure 14-7.

Test Flags and Emulation Provide Agility
By using test flags and emulation, you can test a service without any platform services. To really make the one box or test cluster work for rapid testing and regression of internal bugs, a service needs to have the ability to remove the dependency on these platform services. Test flags and emulation do this in different ways.
Test Flags
Test flags internally stub out calls to a platform service. A global setting in a configuration file or the Windows registry turns the test flags on or off. When the test flag is set to true, any calls to a platform service follow a new code path designed to allow the test to complete.
The test flag code path usually returns a positive response with simple static well-formed data. Some test code is written to return errors and variable data, but this is less common. Test flags are a great way for a tester to quickly take a new build and regress simple bugs such as changes to an error message string or UI navigation, essentially bugs that have nothing to do with integration. Test flags can also be used during stress tests.
Emulation
Emulation is the preferred method for testing a service with the ability to find integration bugs and still maintain agility. Since the platform services are being emulated, bugs with malformed xml can often be caught in this environment before moving to full integration testing.
A typical emulation solution will have an emulation service running on a machine other than the service under tests. For a One-Box test scenario in which the service does not have test flags the emulation service may run locally. The emulation service should have a pluggable architecture to allow the addition of other services as needed. Each plug-in can be coded to receive a well formed request and generate a response. The response can be static or driven from test data. The approach to using test data allows for greater variations in the response and can allow for more boundary and edge case testing.

Logging of test cases and results is a common feature of test automation frameworks. A good emulation service will log incoming and outbound traffic as well. With this approach, a test that passes can check to see if the correct data was sent to and from the service. I once had a bug where a SQL Stored procedure would make two calls to a remote service but would write only one row of data in the database. Without logging from the emulator, we would not have caught this bug.
Some of the better emulation solutions allow the test environment to be set up to call into the emulator but have flags to allow for the request to pass through. In this approach, the emulator still logs all traffic but the request can go to a real instance of the service.
Emulation is ideal for load testing. The use of logs and simplified logic in the emulators allows them to scale much higher than trying to test against a test instance of a platform service. Emulators can also simulate varying latency no matter what the true load is.
Testing Against Production
To operations engineers and many product teams, the thought of allowing another service to test its new code against your live site seems ridiculous. Who would want all those mean testers doing horrible things to the code and trying to break your service? The thought of letting testers bang away at production sends chills down the spine of most operations managers.
Over the years, I have developed a few arguments to help everyone realize that testing against production is a good thing and to explain that it is happening whether you like it or not.
The first example I use is to ask anyone to go out and try to create a WLID account starting with the term test or test account. You will have to try a lot of combinations of letters and numbers after these words to find an available name. Something tells me that the individuals who created these accounts are doing some sort of testing and that there is very little WLID can do to stop them.
All services run some level of transaction monitoring as a way to alert the SOC when something goes wrong. After every upgrade, the operations engineers often run a battery of tests called smoke tests to ensure that all major functionality is still working. Well, these are tests just like the ones run against a one box and other test environments. This means that operations is testing in production already.
Hackers are constantly looking for vulnerabilities in production services. If a service must be robust enough to withstand a hacker’s attempt to break in, it should be able to survive a few automated tests.
Mashups is the last example I use. Many mashups are developed by small teams of developers and use public APIs. Some even go so far as to screen scrape to build their application.
The point is that they must develop their mashup over the Internet against production. In this case, they are not only testing their solution against production, they are developing against production.
Note
Screen scraping is a technique for taking a fully rendered UI—for a mashup this is a Web page—ignoring the binary information such as pictures, and pulling out and parsing the data from it. This is not an optimal method because a fully rendered UI rarely has data presented with delimiters for easy parsing.
Once a team is convinced that they can test against production, you do need to establish some guidelines. Simple rules such as “no load tests against production” and “no direct access to backend services” are the most important. Architecturally, there is another challenge: the need to isolate test traffic from real users. With so many services being ad funded, advertisers won’t want to pay for impressions or click-throughs generated by test automation.
Production Dogfood, Now with More Big Iron
Dogfood, first covered in Chapter 11, is still a major component in how we test S+S. Services dogfood is about setting up a full-fledged instance of the production service built out with the same hardware as the rest of production. Users of dogfood clusters, sometimes called beta clusters, are usually employees, family members of employees, partners, and occasionally technology reviewers. Users of dogfood realize that they are on an environment where things will occasionally break. The benefit to users is access to the newer code before it goes into broad use.
Dogfood clusters are upgraded more frequently than production. Users on a dogfood cluster get the benefit of using the newer code before anyone else. They also are expected to give quality feedback to the development team throughout the process.
Other uses of dogfood clusters include running full suites of automated tests to help catch regressions and usability tests. Public demonstrations of the next big release are often run from the dogfood cluster.
Production Data, so Tempting but Risky Too
To test Microsoft Office, we have a library of thousands and thousands of documents our customers have given us to use. These are real-world documents with all sorts of macros and Microsoft Visual Basic for Applications (VBA) code and crazy custom styles. We use this library to test for backward compatibility and the number of calls from a client to a service (round tripping). Round trips add to performance degradation.
In services that are very stateful, there is always a large real-world data set. A service needs to clearly state in the privacy statement whether this data will ever be used for purposes outside of the production environment. This is especially true if the data contains any personally identifiable information (PII).
Using production data in testing is a great asset to test. We find that the shape of the production data changes over time as the use of certain data elements extends and other elements are forgotten and left as legacy.
Whether the production data contains any PII or not, it must be sanitized before testing. I have seen teams forget to scrub live site end points from their production data and accidently send a flood of test traffic over the Internet against the production site. Therefore, the first rule in using production data is to sanitize it.
Note
Data masking, usually referred to as data sanitization in Microsoft, is a process of obscuring specific data within database tables to ensure sensitive production data is not accidently leaked. Scrubbing algorithms are used to generate random substitute but fully functional data in place of the original.
The second key to using production data is to analyze it. Too often teams take the data, sanitize it, and use it for testing By analyzing the data, we can look for boundary conditions. If you want to know the longest city name from a dump of personalization data, analyze it and pull that out. It could be a valuable piece of information in producing tests that can run without production data.
Performance Test Metrics for Services
Throughout this book, we have discussed many different metrics used to drive quality into Microsoft products. All of the metrics covered so far apply to S+S testing. Fortunately, this chapter presents new metrics to measure and track for S+S testing, as presented in Table 14-3.
Most of these metrics come from design best practices. The great thing about a best practice is that there is quite often a test needed to verify that it was applied optimally.
Metric title | Definition |
Page Load Time 1 (PLT1) | Measures the amount of time it takes for a browser to load a new page from the first request to the final bit of data. A new page is any Web page the browser has never been to before and for which it has no content cached. |
Page Load Time 2 (PLT2) | Measures the amount of time it takes for a page to load on every visit after the first. This should always be faster than PLT1 because the browser should have some content cached. |
Page weight | The size of a Web page in bytes. A page consisting of more bytes of data will typically load more slowly than a lighter weight page will. |
Compressibility | Measures the compression potential of files and images. |
Expiration date set | Test validates that relatively static content has an expiration date greater than today. |
Round trip analysis | Evaluates number of round trips for any request and identifies ways to reduce them. |
Certainly, many other metrics are unique to services and some are unique to specific types of services. For example, in the search space one of the most critical measurements is relevance. This is a measure of how likely the content of a Web page will meet the user’s needs based upon the search criteria.
In this section, I pared the list of potential metrics down to a small subset focused on performance. These metrics are common to any online service. I also picked metrics that reference good-quality freely available test tools to use in running the tests:
Visual Round Trip Analyzer (VRTA) will be available on the Microsoft Developer Network (http://msdn.microsoft.com) by the time this book is published.
Fiddler is already available at http://www.fiddler2.com and there are a number of articles about it posted on MSDN.
Page Load Time 1 and Page Load Time 2
Page Load Time 1 (PLT1) and Page Load Time 2 (PLT2) are the key measures for user satisfaction. Research has shown that Web pages that take longer than just a few seconds to load rate lower than a similar page that loads much quicker. Some search engines even use PLT measurements in weighting of search results. A slower page will fall farther down in the list of returned pages even if the content is as good a match as another faster page.
In Microsoft, we focus heavily on measuring our own services’ PLTs as well as those of our competition. This analysis is done for PLT1 and PLT2 but also by country, as shown in Figure 14-9. PLT for a country is often affected by the bandwidth to the country and the distance the data must travel to reach the user. Network engineers are fond of saying that they are limited by the speed of light.

In some respects, it’s like watching one of those cable news channels when the field reporter is halfway around the world and the anchor is asking a question. The field reporter stands there nodding as the question is asked. When the anchor is done asking, we all see the reporter continue to nod for another second before starting to answer. In the same way, data sent from a server to a browser is limited by the speed of light.
Network impact on PLT is just one element. The biggest improvements to PLT can be made through various optimization techniques. The rest of the metrics covered in this section are ones that we use to improve the quality of the code and content for optimized page load times.
Page Weight
Page weight is simply the number of bytes that make up a single Web page. Because Web pages often are dynamic and composed of many elements such as script files, images, and even ActiveX controls, most page weight tests are conducted in lab scenarios where the variable elements are fixed.
For pages with a high page weight, bugs are filed and developers work to reduce the total number of bytes. Goals for maximum page weight vary by product and frequency of access.
Compressibility
Compressibility analyzes the degree to which any file, whether XML, HTML, image, cascading style sheets (CSS), or JavaScript (JS), can be compressed. A lot of JavaScript is posted with white space and comments. These won’t affect how the script runs, but they affect file size and thus page load times. VRTA3 is an ideal tool to use to analyze compressibility.
Many elements of a Web pages such as JavaScript or cascading style sheets (CSS) can be compressed by four or more times their original size. This saves on the amount of data that needs to be sent between a Web server and the browser. Decompressing on the client computer is negligible. Removing white space such as spaces and comments can yield another 20 percent reduction in the size of a Web page. VRTA3 analyzes files for all these elements and identifies top candidates for compression and how much will be saved.
Table 14-4 shows the data from a compression report. A compressibility measure of 1.0 indicates that the file is already optimally compressed. A measure of 4.1 indicates that the file could be compressed to be 4.1 times smaller than it currently is.
Expiration Date
A common mistake in Web page design is not setting the maximum expiration date on relatively static content. This is vital for reducing PLT2 (the second time a user visits a site). If the file has no cache setting, the browser will request an updated version of the file from the server. Even if the file has not changed and is not redownloaded to the browser, time is wasted making the request to the server.
Fiddler is a tool developed by Eric Lawrence of Microsoft and is available on the Internet at http://www.fiddler2.com. It is used largely by security testers in Microsoft but also has a number of performance features, as shown in Figure 14-10.
In the detailed results tab of a performance test, Fiddler shows all the files that were loaded with a Web page and the cache setting for them. It is an easy way to find files that could be cached. With the tool, you can also see what percentage of time the page takes to load various bits of content.

Round Trip Analysis
The biggest impact to page load time is the network. As the distance from the source to the client increases, the network becomes an increasingly influential component of page load time. Reducing page weight reduces the amount of data, but it is really the number of round trips that most affects PLT.
VRTA3 and Fiddler can help with this analysis, and VRTA3 does have some nice graphical representations that help.
The Microsoft Office Live team sets a threshold for the maximum number of round trips (un-cached) that each Web page can have. When the developer makes a check-in to the source control system, a suite of tests for performance run and any page exceeding the round trip threshold is flagged.
Several Other Critical Thoughts on S+S
In this section, I want to share a bit more on testing in an S+S world. Although these points didn’t really fit well under test techniques, each contains information that any tester on a service should champion.
Continuous Quality Improvement Program
In Chapter 3, we discussed the concept of Milestone Q (a.k.a. MQ or M0). For larger projects, this milestone is typically about clearing the decks and getting ready for the next major release. Teams invest in infrastructure improvements to help the process of developing and shipping to be smoother and faster. Developers often investigate new technologies and develop new prototypes. In the services world, where teams might go years shipping monthly or quarterly, we don’t often take time for an MQ. In the services world, we focus on continuous improvement.
All of our production services are very data driven and most use a very Six Sigma–like process we call quality of service (QoS) to drive continuous improvement. This QoS should not be confused with the computer networking concept that gives certain applications priority network access over others. Our version of QoS is about finding the unique insights that will help us to improve customer satisfaction.
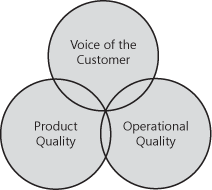
A successful QoS program must have data from three major categories. It can include other data, but in many cases that can distract from the very clear goal of improving customer satisfaction. The three major categories of data are voice of the customer, product quality, and operational quality, as shown in Figure 14-11.
Voice of the customer can be gathered from multiple sources. Direct surveys of customer satisfaction are the most common. Many services teams have shifted from using direct surveys of customer satisfaction to the Net Promoter score. Blog and Twitter mining is another way to see what customers are saying about your product or service.
The Net Promoter score is a management tool that can be used to gauge the loyalty of a firm’s customer relationships. It serves as an alternative to traditional customer satisfaction research.
For services with direct support, call center data is a vital component of voice of the customer. Whether through actual phone calls or online chat help, user requests are categorized. By mining this data, a service team can identify the top customer escalations and prioritize those to improve customer satisfaction but also drive down the support costs.
Product quality focuses on bugs and performance. In many cases, bugs might already be known, but how important they are to fix relative to other bugs is often hard to determine. A major area of product quality is the continual measurement and improvement of page load time relative to competitors. What is good performance today is not necessarily a customer satisfaction driver in the future.
Operational quality is the same set of data operations that you would use to look for internal efficiencies, but in a QoS approach it is used to identify potential dissatisfaction (DSat) drivers. I often like to kid with the operations engineers, saying that there is little they can do to drive up customer satisfaction but a lot they can do to drive it down. This fact doesn’t put operations in a very fun position, which is why it can be a challenging role. Here are a few key operational metrics and how they can be used to improve QoS:
Root cause analysis (RCA) on any production outage can identify either a process problem or an underlying bug or architecture flaw.
A high time to detection for a production issue can show holes in monitoring.
A high time to resolution can indicate inadequate logging or diagnostic tools.
Percentage of tickets resolved through Tier 1 or a self-healing system can show efficiency of handling simple, high-volume production issues. Resolving at Tier 1 or in an automated self-healing system also brings down time to resolution.
Percentage of false alarms can show errors in monitoring or alert thresholds.
The richest area for finding product improvements is tickets by bucket. This is very similar to the call center coding but is the operational view instead of the customer perspective. Any area that has a high count is rich for product improvement or self-healing automation.
When all three data sources are brought together, the team can better prioritize the right fixes to maximize improvements to customer satisfaction. Here is an example of how this could work in a very layered service: The call center team has a high number of complaints from users that could not process PayPal payments on the evening of June 23. When enough calls about a common problem have come into the call center an alert is sent to the live site operations team. Upon investigation they discover that PayPal has updated a certificate on their service that requires any other service trying to connect to them to also update to the new version. Certificates are essentially private keys services use to identify trusted partners. Upon review of this incident the call center, operations team, and product engineering team identify a gap in the service monitoring and agree to implement a PayPal monitoring solution and an alert system for when certificates need to be updated. The solution to add an alert will warn the operations team when the certificate is due to expire and thus prevent a future outage. On the off chance that this does happen again, the enhanced monitoring will reduce the time to detection and time to resolution.
The key to the successful use of this approach is to bring all the data and all the stakeholders together to identify root cause and optimal improvements.
Common Bugs I’ve Seen Missed
Inside Microsoft, I have a video blog series called “War Stories—Bugs in Production.” The series is dedicated to wallowing in the bugs that got past everyone and into production. These are not just little bugs that would have been nice to have fixed. These horrible nasty bugs have caused more than one outage.
Some testers are reluctant to share the story of the one that got away. It’s as if they feel responsible for the bug. I like to point out that they didn’t make the bug; either a developer wrote the bug or a PM designed the bug. As testers, they found hundreds or thousands of other bugs, and eventually a bug gets past everyone. I like to believe one of the best tools a tester has for learning is to hear about the bugs others have missed.
Legacy clients can bring your service to its knees. After a service has been around a while, it might have a dozen or more older clients still in active use. There are still versions of the MSN client that shipped in the mid-1990s in use to this day. One bug I’ve seen a few times occurs when the service is upgraded and it causes a new behavior in a legacy client. The new behavior is often related to some retry logic that has never really been hit before. This could be caused by a new data structure for a query response being recognized by the client as malformed and tossed out, or it could simply be a slow response from the server that triggers a new request. The problem occurs when the client does not have a retry logic throttle so that it keeps increasing the number of requests until the production site is brought down as if by a denial of service (DoS) attack.
The “disallow server cascading” failure is another one I like. In this scenario, a service that is built on top of a platform service can become influenced by the reliability of those underlying components. Some higher level services develop the disallow or block this server list feature: If a server in a platform component is not responding in a timely enough fashion, it is put on the disallow list. This allows the higher level service the opportunity to reissue the query to another server in the platform cloud. The problem occurs when the platform service is under high load and is simply not responsive within the time expected so that the query is reissued to another server. The overload now spreads as servers are added to the disallow list and other servers get ever increasing loads. When the service is down to just a few servers that are not on the disallow list, it grinds to a halt and all higher lever services fail.
The last example I have is the tsunami or tidal wave. I first started talking about the tsunami effect back in 1995 after we had an outage in the MSN authentication service. For a few hours, the authentication service behind our dial-up connection was down. It wasn’t down long, but the timing happened to be just near the end of the workday on the East Coast. Users were unable to log on, but they still wrote e-mail messages to friends while in the offline mode. In the background, the client kept trying to connect. When the service came back online all those users connected and a torrent of e-mail was sent out over the Internet. A lot of it went to AOL. Within a few hours, our e-mail servers were knocked offline by a flood of e-mail coming back from AOL.
The tsunami effect still exists on the open Internet. We had a recent occurrence when the intercontinental network connections from North America to Japan went down for just a few hours. When the network came back up, the very popular MSN Messenger service was flooded by authentication requests that were routed to the WLID service. This sudden surge in authentication requests slowed WLID for several hours.
Bugs in production are great to study and learn from. Truly, most of the worst ones are design flaws rather than simple coding mistakes. Either way, wallowing in a production bug is a great way for team members to learn.
Summary
Services are a big bet for Microsoft. We’ve been building products and services for the Internet since the early 1990s. Both Bill Gates’s memo “The Internet Tidal Wave” and Ray Ozzie’s memo "The Internet services disruption" have reinforced the importance of the Internet and services to our long-term success. Microsoft invests billions of dollars a year in capital to support our services growth, and while doing this we work closely with industry to find ways to improve power consumption and resource utilization.
Traditional software products for desktop computers and servers have a lot in common with services. This commonality allows us to bring all the test techniques we used to ship those shrink-wrap products to bear on services testing.
There are still many differences between shrink-wrap and services, however. These differences have required Microsoft SDETs to develop many new test techniques. Fully automated deployments and the one box are key to unblocking testing. Test clusters using test flags, emulation, or services integration help find bugs in service-to-service transactions. By moving closer to production with testing, we can start to test new services against live production instances of platform services and even pull sanitized production data into test labs.
All the metrics used to measure traditional software apply to services and S+S, but services need to pay special attention to page load times. Customers do not like to wait for a Web page to load. There are many simple improvements, such as reducing page weight, setting cache on files, and reducing round trips, that should be constantly measured during testing to improve PLT.
The key to services is not to think shipping is done when the service goes live. In many respects, that’s when the final test pass begins. A test environment will never be exactly like production, so some bugs will be missed. Keeping an eye on production also means implementing a robust continuous improvement process that should integrate data from the voice of the customer, product quality, and operational quality. High production quality also means learning from our mistakes and wallowing in the bugs that got past us and into production.
[1] Conn Iggulden and Hal Iggulden, The Dangerous Book for Boys (New York: Harper Collins, 2006).
[2] Jon Brodkin, “More Outages Hit Amazon’s S3 Storage Service,” Network World, July 21, 2008, http://www.networkworld.com/news/2008/072108-amazon-outages.html.
[3] Eric Lai, “Microsoft Builds First Major Container-Based Datacenter,” Computerworld, April 8, 2008, http://www.infoworld.com/article/08/04/08/Microsoft-builds-first-major-container-based-datacenter_1.html.