
|
|
It may be said, fairly enough, that science progresses by the exposure of error and that in so far as an endeavor is scientific it is as ready to look for error within its own contentions as in those opposing it. In particular, it has to be stressed that observation, which plays so special a role in science, is not regarded as error-free.
W. M. O’Neil
1957
In their book Physics, the Human Adventure, Holton and Brush (2000) state, “By far the largest part of the total research and development effort in science and engineering today is concerned, indirectly or directly, with human needs, relationships, health, and comforts” (p. 49). When we view science in this light, we see that human factors has a central place in contemporary science and engineering efforts. You can verify this by entering “role of human factors” into a Web search engine, which yields many entries covering aviation safety, healthcare, quality improvement, production networks, and scuba diving incidents, among others.
Human factors is an applied science. It relies on measurement of behavioral and physical variables in settings ranging from the laboratory to working human–machine systems. The human factors researcher must know the methods of science in general and the specific research methods that are available for conducting human factors research. The applied human factors specialist likewise must understand these methods, and their strengths and limitations, to be an effective consumer of available information and to be able to make wise decisions at all phases of the system development process.
Because it is an applied science, human factors involves a mix of basic and applied research. Basic and applied research can be classified using a 2 × 2 array, as shown in Figure 2.1, which was popularized by Stokes (1997). The rows identify a Quest for Fundamental Understanding (yes or no) and the columns Considerations of Use (yes or no; Stokes, 1997). The primary goal of basic research is to increase foundational knowledge on some topic, for example, attention, with no specific application of that knowledge in mind. In contrast, the primary goal of applied research is to solve practical real-world problems. The findings from basic research increase our scientific understanding, but perhaps with no obvious link to application, whereas the findings from applied research provide solutions to practical problems, but perhaps with little increase in scientific understanding. The emphasis on specific problems in applied research restricts its contributions to those problems and to existing technology. However, because new technologies continually arise to make older technologies obsolete, new problems continually crop up. This means that we need basic research that generates knowledge transcending particular applications so we can address new problems effectively as they occur.

FIGURE 2.1Two dimensions of scientific research
Consistent with this point, the influence of basic and applied research on system development happens at very different times (Adams, 1972). If we look at the important research events leading to a system innovation, the immediately preceding events come primarily from applied research, whereas the longer-term contributions arise from basic research. In other words, basic research provides a foundation of conceptual and methodological tools that can subsequently be used to resolve specific applied problems.
Consider, for example, human attention (see Chapter 9). Contemporary research on attention is usually dated to experiments by Mackworth (1948; see Murray, 1974), who worked with airborne operators during World War II. These operators were required to monitor radar screens for hours at a time while searching for enemy submarines. Tasks like this are called vigilance tasks. Basic research on attention initiated by the issue of vigilance and related applied problems led to the development of theories that conceptualized attention as one or more limited-capacity resources (see Chapter 9), which resulted in the development of methods to measure mental workload that are widely used today in human factors (Young, Brookhuis, Wickens, & Hancock, 2015).
Applied research identifies issues of human performance that need to be addressed in a particular setting and provides a criterion for meaningful research. Again, using attention as an example, the scientific study of attention has benefited considerably from investigations of applied problems such as those involved in display design. This interplay between basic and applied research is the foundation of many sciences, including human factors. As Alan Baddeley, a noted memory researcher, said, “Sometimes choosing what appears to be a practical problem actually can have considerable theoretical impact” (quoted in Reynolds & Tansey, 2003, p. 48), and vice versa.
In addition to pure basic and applied research, Stokes’ (1997) taxonomy includes a third type of research, called use-inspired basic research (Stokes, 1997). This research is driven by both considerations of use and a quest for fundamental understanding. This type of research is particularly productive because it involves conducting basic research in the pursuit of applied problems (Gallaway, 2007).
Use-inspired basic research is valuable in human factors, but it is difficult to conduct. Because so many different researchers collaborate in a system design, problems of communication can result from different ways of talking about and solving problems, as well as conflict from different goals. However, when successful, as in the case of the work of Thomas Landauer and colleagues on Latent Semantic Analysis (see Chapter 10), the theoretical and applied contributions can be profound (Evangelopoulos, 2013), demonstrating that “fundamental research and work on solutions to practical human problems can live together in interesting and useful ways” (Streeter, Laham, Dumais, & Rothkopf, 2005, p. 2). The point to remember is that pure basic, use-inspired basic, and pure applied research are complementary, and all contribute to the discipline of human factors (Proctor & Vu, 2011).
An understanding of human factors research requires an understanding of scientific methodology, research methods, and measurement. The purpose of this chapter is to outline the primary features of scientific methodology and to present the general research and statistical methods used in the investigation of human performance. We assume that if you have not already taken formal courses in research methods and statistics, then you will be taking them shortly. The outline we present in this chapter reviews the essential tools you need to formulate and critically evaluate human factors studies. It also provides different perspectives on how to think about problems unique to human factors. Techniques specific to particular areas of human factors, discussed in later chapters, build from the concepts introduced in this chapter.
DISTINGUISHING FEATURES OF SCIENCE
The definition of human factors provided in Chapter 1 emphasized that it is a scientific discipline. Consequently, to understand the field, you need to appreciate what it means to take a scientific approach. But what is science? Any definition of science will always fall short, because science is not a thing. Rather, it is a process—a way of learning about the world. This process involves making informal observations, forming alternative hypotheses about the nature of things, and testing these hypotheses empirically.
Of course, science is not the only way to learn about the world. For example, as a student of human factors, you might undertake the task of designing a keyboard entry device for a new computer system. In designing the keyboard, you could appeal to a number of sources for information to determine the most effective design. You could consult an established authority, perhaps the instructor of your course. Or, you could examine various keyboards already available to determine the traditional wisdom. You might even design the keyboard on the basis of your personal experience and ideas about an optimal design. Each of these approaches can provide valuable information. If you were to take a scientific approach, however, these approaches would serve as the starting points of your search, rather than as ends in and of themselves.
Why are sources of information like authority, tradition, or personal experience insufficient for designing a keyboard entry device? Imagine that a fellow classmate has been given the same assignment. Although you both may consult the same sources of information to complete the project, you may not interpret each of these sources in the same way. Therefore, it is quite likely that you would arrive at different keyboard designs.
You then have to decide which keyboard is best. This is where the methods of science take over. Science provides systematic ways to resolve this question. In fact, using a scientific approach, not only could you test to determine which keyboard is best and whether either is better than existing keyboards, but you could also discover those specific attributes that make one design better than another and why they do. You could both resolve this specific design issue and make a contribution to understanding human factors in keyboard design.
Science is based on empiricism. Empiricism means pursuing knowledge by observation. This observation can range from uncontrolled, direct observations within natural settings, to tightly controlled experiments in artificial settings. For example, if we are interested in the performance of operators in the control room of a nuclear power plant, we can record and analyze their activities during work, conduct specific exercises on a simulator, test the operators’ ability to identify alternative displays, and so on. The key point behind the principle of empiricism is that statements are evaluated on the basis of observable events. Thus, science provides objective criteria for evaluating the truth value of alternative statements.
Science is distinguished from other ways of acquiring knowledge because it is self-correcting. Empiricism provides the mechanism for self-correction: We continually test our scientific statements with observations. When reliable observations deviate systematically from our predictions and explanations, we revise the scientific statements. Thus, the observations provide feedback that allows correction of error, as O’Neil (1957) emphasizes in the quote with which this chapter begins. Science therefore operates as a closed-loop system of the type described in Chapter 3.
The self-correcting characteristic of science ensures that new knowledge will be dependable and will help advance our understanding of the world. Consequently, scientists accept any statement tentatively, with the degree of acceptance of a particular scientific statement being a direct function of the amount of evidence in support of it. They constantly test the validity of scientific statements, and such tests are open to public observation and scrutiny. These self-correcting aspects of science are embodied in what is called the scientific method. What scientists do for the most part, then, is to systematically apply the scientific method.
The scientific method is a logical approach to obtaining answers to questions. This approach is often equated with the steps by which hypotheses are generated and tested, beginning from general observations in the world and ending with a detailed, documented statement of the factors that give rise to observed phenomena. Figure 2.2 shows the steps involved in hypothesis testing.

FIGURE 2.2Steps in hypothesis testing.
The scientific enterprise begins with curiosity about the cause of some observed phenomenon. For example, you might wonder why people who use cell phones when they drive tend to get into more accidents. To answer this question, you need to phrase the question in a way that allows it to become a problem that can be investigated. Often this involves deciding which behavioral measures will reflect the problem. For example, the time it takes a driver to brake in response to an obstacle in the road might be a behavioral measure that reflects the amount of attention devoted to driving. High levels of attention might lead to fast braking times, and low levels of attention might lead to slower braking times. You might suspect that cell phone use reduces the amount of attention devoted to driving, increasing the time it takes for drivers to respond to changing road conditions. This is a hypothesis, a tentative causal statement about the relations among the factors involved in the occurrence of the phenomenon.
The hypothesis serves as the statement that is to be assessed by research. Once you have formulated a hypothesis, you can begin to make other observations to test the hypothesis, compare it with alternative hypotheses, and increase your understanding of the phenomenon. For example, if attentional factors are responsible for accidents during cell phone use, then maybe other kinds of distractions also lead to accidents. You could perform experiments comparing response times during cell phone use with response times during conversations with passengers. You will continually refine and modify your hypothesis, or even reject it, based on the results of your experiments, until you have a complete understanding of the phenomenon.
Note that the hypothesis is tested by conducting experiments designed to confirm or disconfirm its predictions. We do not test the hypothesis directly; rather, we test the relations between measurable and observable variables predicted by the hypothesis. The viability of the hypothesis is determined by how appropriately it captures the relations among the factors of interest compared with alternative hypotheses. For example, you might compare the hypothesis that lack of attention during cell phone use causes accidents with a hypothesis that states that one-handed driving during cell phone use causes accidents. You could simultaneously test both the attentional and the one-handed driving hypothesis in experiments to determine which hypothesis makes better predictions. As always, you will then apply the information about which hypothesis is better back to the original problem.
Finally, the last step of the scientific method is telling other researchers what you have learned. The hypotheses you tested and the data you collected, together with your interpretation of the results, must be written up and distributed to the scientific community. You do this with conference presentations, journal articles, technical reports, and books. It is at this point that your new information becomes part of the scientific knowledge base. Without this last step, the most important characteristic of the scientific method would be missing: the characteristic of self-correction. It is possible that you made a mistake somewhere, maybe in the design of your experiments or how you analyzed your data, so that your conclusions are not valid. Making your work available to the entire scientific community lets other researchers examine it closely, attempt to replicate it, and come up with their own contributions to the problem. If you made a mistake somewhere, they will find it and correct it.
Our depiction of the hypothesis testing process is by necessity oversimplified. A hypothesis is not tested in isolation. Many other factors, some known and some unknown, also act to influence the results of an experiment (see Proctor & Capaldi, 2006). For example, a study may be conducted in more than one room, and slight differences in the way that light falls on the materials or in the placement of equipment around the testing area could affect the scientist’s measurements. Or, the measuring instrument may not be appropriate for testing the hypothesis, it may not be sensitive enough, or it may be improperly calibrated. Therefore, failure to confirm a hypothesis may be due to one or more unknown factors, rather than to the inadequacy of the hypothesis itself. Also, the predictions drawn from the hypothesis may not be valid. It is possible that by emphasizing some originally neglected aspect of the hypothesis, a somewhat different correct prediction may follow. So, even when an experiment fails to support a hypothesis, rejecting that hypothesis immediately is not always the best thing to do. A lot of good science has resulted when researchers have resolutely held on to a supposedly disconfirmed hypothesis.
Because of the emphasis on data collection, it is easy to assume that science is basically a fact-gathering activity. However, this is far from the case. The goals of science are explanation, prediction, and control. The vehicle for achieving these goals is theory. According to Kerlinger and Lee (2000, p. 11),
A theory is a set of interrelated constructs (concepts), definitions, and propositions that present a systematic view of phenomena by specifying relations among variables, with the purpose of explaining and predicting the phenomena.
A scientific theory about a particular problem is closely related to the empirical evidence collected on that problem. The theory that we accept at any point in time will be the one that provides the best explanation of existing findings (Haig, 2009; Koslowski, 2012). Thus, whereas the layperson tends to conceive of a theory as an armchair speculation, a scientific theory provides instead a detailed, specific organization of existing knowledge.
Good theories explain findings that previously resisted explanation (Brush, 1989). However, not only do good theories provide an explanation of established data, but they must also produce new predictions that can be tested empirically. These new predictions advance science further. Finally, the theory states precisely which factors are important for a particular problem and what the relationships are between those factors. Consequently, it allows control over the phenomenon by giving an understanding of the conditions under which it occurs.
Theory is beneficial not only to the basic researcher who seeks to understand the underlying nature of things, but also to the applied human factors researcher and practitioner. Theory offers at least four benefits to the practitioner (Kantowitz, 1989, p. 1060). It
1.Enables sensible interpolation to a specific real-world problem when there are no data;
2.Provides quantitative predictions of the type desired by engineers and designers;
3.Allows the practitioner to recognize relations between problems that seem unrelated on the surface; and
4.Can be used cheaply and efficiently to aid system design.
Thus, an understanding of human performance in terms of theoretical concepts is essential for the effective application of existing knowledge to human factors problems.
Most important, science is an approach to thinking about problems and acquiring knowledge. This point is captured clearly by the late, well-known astronomer and popularizer of science, Carl Edward Sagan (b1934–d1996), who said:
Science is much more than a body of knowledge. It is a way of thinking. This is central to its success. Science invites us to let the facts in even when they don’t conform to our preconceptions. It counsels us to carry alternative hypotheses in our heads and see which ones best match the facts. It urges on us a fine balance between no-holds-barred openness to new ideas, however heretical, and the most rigorous skeptical scrutiny of everything—new ideas and established wisdom. We need wide appreciation of this kind of thinking. It works. (Sagan, 1990, p. 265; italics ours)
The problem that leads a researcher to conduct a study has two consequences. First, it defines a domain of interest. In human factors, the domain of interest is usually human performance within a system context. Within this domain, we operationally define the objects or events under study in terms of the physical characteristics that we intend to measure. For example, in the preceding section, we operationally defined an increase in attention as a reduction in braking time during driving. Second, it defines the conditions under which we can make useful measurements. If we are interested in the effects of cell phone use on driving performance, we will need to observe people using cell phones in realistic driving conditions or simulated driving scenarios, not people listening to radios while mowing the lawn.
Because a person’s performance and the conditions under which we observe it can vary, we define the conditions and performance measures collectively as variables. That is, a variable is any event that can change, whether we change it ourselves or whether we observe a change caused by something else. We refine the initial question into a researchable form; we establish the primary variables of interest and begin to structure the types of research designs that we will use.
There are several ways to classify variables. Most research in human factors involves the measurement of behavioral variables. Behavioral variables are any overt, observable behaviors. They can range from simple key presses to the complex responses required to pilot a jet aircraft. Behavior never occurs in isolation, but always in the context of a collection of stimulus events. Stimuli that can have an effect on the behavior of an organism are referred to as stimulus variables. Stimulus variables can range from a simple buzzer indicating a desired response, to the complex auditory and visual messages received by an air-traffic controller. Most research in human factors is concerned with the influence of stimulus variables on behavioral variables.
Another way to classify variables is in terms of whether they are manipulated or measured. An independent variable is one that is manipulated by the researcher. Most often, the manipulation is made for stimulus variables, such as the level of illumination. We manipulate independent variables to determine their effects on other variables, which are referred to as dependent variables. Dependent variables usually are behavioral variables. These are sometimes called criterion variables (Sanders & McCormick, 1993) and can be grouped into measures that reflect performance (such as speed and force of responding), physiological indexes (such as heart rate and EEG recordings), or subjective responses (such as preferences and estimates of effort). The distinction between independent and dependent variables forms a cornerstone of the true experiment, because it allows us to establish causal relations.
In nonexperimental or descriptive research, we can make no distinction between independent and dependent variables. We can make only tentative statements about causal relations. For example, uncontrolled observation of consumer behavior in a grocery store is nonexperimental. We do not identify or manipulate independent variables, and we might not measure a dependent variable either. In other kinds of descriptive research (in particular, differential research, which attempts to understand how people differ from each other), we can label independent and dependent variables. However, in differential research, the independent variable is a subject variable, that is, a property of the subjects, such as height, weight, gender, age, and personality classification. We cannot manipulate subject variables. For example, we can’t take a group of children and raise half of them with healthy diets and half with unhealthy diets; that would be unethical. We can, however, find children with healthy and unhealthy diets and measure differences between them. Because we can’t manipulate or control subject variables, we can’t assign cause and effect relationships to the different variables. We will talk more about descriptive research later in this chapter.
RELIABILITY, VALIDITY, AND CONTROL
Two of the most important concepts in human factors and ergonomics research are those of reliability and validity (Kanis, 2014). Reliability refers to the consistency of measurements. Measurements are said to be reliable if we get similar values when we measure the same thing more than once. Experimental results are reliable if we can replicate them under similar conditions. For example, if you give a test to the same group of people at two different times, the test is said to have high “test-retest” reliability if the scores for each person are similar for the two administrations of the test. Another way to think of reliability is that any measure, call it Xobserved, has two parts. One part is “true” (Xtrue) and the other part is random error. The two parts are added together to give the final measure: Xobserved = Xtrue + error. The larger the true part is relative to the error part, the higher the reliability.
Validity refers to the degree to which an experiment, a procedure, or a measurement does what it is supposed to do. However, the idea of validity is complex, and we can talk about validity in many ways (see, for example, Jacko, Yi, Sainfort, & McClelland, 2012). A variable is said to have high face validity if it seems on the surface to measure what it is supposed to be measuring. For example, measuring the number of mistakes that a pilot makes during simulated flight of a new aircraft to evaluate the quality of that aircraft’s cockpit design has high face validity. A variable is said to have construct validity if it is a true measure of the construct it represents. For example, the time to perform a task decreases systematically with practice, indicating that response time is a valid measure of learning. One task of a researcher is to optimize validity.
Three types of validity are particularly important for human factors research: ecological, internal, and external validity. A research setting is said to have high ecological validity when it closely resembles the situations and tasks of concern in everyday life and low ecological validity when it does not. As an example, you might be studying the effects of attention on driving performance. You could design an experiment in which road-like conditions are presented on a computer screen and the driver performs by pressing keys on the computer keyboard. This experiment would have low ecological validity. Or, you could design an experiment in a simulator that had every appearance of a real car, and the driver could perform real driving tasks. This experiment would have higher ecological validity. Applied human factors research typically strives for relatively high ecological validity, whereas basic research on human performance often does not.
A study is said to have high internal validity if the relations observed in it can be attributed with a high degree of confidence to the variables of interest and low internal validity if they cannot. Typically, laboratory experiments yield the highest level of internal validity because of the level of control we can exert on the variables of interest. Ecological validity is often sacrificed for internal validity. It is easier to obtain internal validity in a low ecologically valid setting than in a high ecologically valid setting. This is because settings with high ecological validity often have more uncontrolled situational variables, such as the number of elements in the visual field, the actions available to the performer, and so forth.
A study is said to have high external validity if its results, or the principles derived from the results, can be generalized to a variety of other settings, and low external validity if they cannot. It is important to understand that high ecological validity does not ensure high external validity; nor does high internal validity necessarily mean that the findings cannot also be high in external validity (Fincannon, Keebler, & Jentsch, 2014). That is, even research conducted in ecologically valid settings may yield results that are only obtained in the same setting, and research conducted in the lab can yield principles that can be generalized broadly.
Remember that empirical observations are the central facet of scientific research. In human factors, these typically are observations of behavior. This observed behavior can be influenced by a multitude of variables, not all of which are known to the researcher. Moreover, some of the variables may be of interest to the researcher, whereas others are extraneous. If the extraneous variables have a sufficiently great effect, they can cloud the effects of the variables of interest. For example, investigating the performance of workers under new arrangements of assembly line stations may be confounded by wage reductions instituted at the time the study began. If productivity decreases after we rearrange the line, is this because of the changes we made or is it because the workers are angry about their cut in pay? In short, extraneous variables threaten the validity of the research, because the observed effects may not be due to what we think. Consequently, an essential aspect of research is the reduction of the influence of these variables.
Control procedures are the systematic methods that a researcher uses to reduce the influence of extraneous variables that threaten the validity of the research (Proctor, Capaldi, & Vu, 2003). It is important to realize that extraneous variables may exert their influence on both the subjects and the researcher. For instance, the way that the experimenter records and classifies behavioral events can be affected by her bias, or how she wants the experiment to turn out. If the research is to be internally valid, the measurement of the dependent variable must be an accurate reflection of the influence of the independent variable.
Because of the wide range of issues investigated in the study of human factors, there is no single research method preferred for all problems. There are many research techniques in the behavioral sciences, each suited for a different type of investigation. These techniques allow you to ask a lot of different questions, but they differ in the degree to which you can be confident in the answers. The degree of confidence depends on the relative control that you have over the various factors involved in the situation you are investigating. Thus, procedures range from the observation and reporting of phenomena in natural settings to tightly controlled laboratory experiments.
No single method will be most appropriate for answering all types of questions, and for many purposes, a converging set of findings from several methods will provide the strongest evidence for a hypothesis. Research that relies on a variety of methods is called multimethod or mixed methods research (Hesse-Biber & Johnson, 2015). The multimethod approach is particularly relevant for targeting specific human factors issues because these issues have their genesis in the use of systems and products in real-world contexts, and the knowledge gained from more controlled methods must be linked back to evaluations of usability and usefulness for the end users.
In this section, we outline some of the more commonly used methods in human factors research. In each case, we describe the strengths and weaknesses of each method, including when and where it can be used, the nature of questions that can be asked and the answers that will be provided, and the type of statistical rigor that can be applied.
We can use a scientific approach to asking questions about the world even for situations in which true experiments are not possible. Such situations typically arise when you are not able to exercise any control over the events under investigation. Some experts in human factors (e.g., Kanis, 2002; Meister, 1985) place considerable emphasis on these descriptive methods, because the ultimate concern of human factors is the operational system, which by its nature is complex and not subject to precisely controlled investigation. When aspects of these systems are studied in controlled laboratory situations, the research often loses its relevance to the original system. This is because the constraints imposed by tight experimental control will make the task environment differ in potentially significant ways from the real-world setting. As we noted earlier, the extent to which a research setting emulates the real-world setting is called ecological validity. In this section, we summarize descriptive methods that preserve ecological validity.
One source of data for human factors researchers is archival data, that is, preexisting data that have been collected for some other purpose (Bisantz & Drury, 2005; Stewart, 2012). Such data may come from injury or incident reports (often required by law) and records produced by people in the performance of their jobs. The massive connectivity of devices like smartphones and cloud-based voice services has resulted in new sources of information about what people are doing in everyday life activities. These sources include social media interactions such as blog entries and product reviews, health records, online search entries, logs of phone usage, and so on. This massive set of archival data that is available is often referred to as “big data,” and a lot of attention is being devoted to developing special methods for making such data widely available and for analyzing the data sets, while protecting the privacy of users (Fan, Han, & Liu, 2014).
Archival data may be useful for developing hypotheses to test experimentally and to obtain important information about an operational system. In addition, they can be used to look for evidence that a phenomenon established primarily in laboratory research generalizes to the real world. Consider, for example, the “dilution effect.” In laboratory studies, when people are asked to make a decision about something, say, a medical diagnosis, pieces of information or cues (like a patient’s symptoms) are provided by the experimenter. A cue is “diagnostic” when it provides valuable information about the correct choice. The dilution effect occurs when some cues are not diagnostic. People tend to pay less attention to diagnostic cues when nondiagnostic cues are present.
One experiment used archival data to look for dilution effects in financial auditing (Waller & Zimbelman, 2003). Auditors have to decide whether mistakes in financial reporting are simply mistakes or evidence of fraud. Some patterns of reporting are diagnostic of fraud, but there are a great many cues to consider in any financial document. If the dilution effect holds for auditors making real audits, they should pay less attention to the diagnostic cues as the number of nondiagnostic cues increases. Data from 215 real audits conducted by an auditing firm confirmed that the auditors experienced dilution. This is real-world evidence of an effect previously found only in the laboratory.
Because the researcher has no control over the collection of archival data, those data must be used with extreme caution. For example, for injury reports, only some injuries may be reported, leading to an underestimation of the injury rate in a particular setting. Similarly, operating records may not contain many important details. Bisantz and Drury (2005) aptly summarize the situation as follows: “Archival data represent a valuable resource for human factors research and analysis, but are full of hidden traps for the unwary” (p. 65).
Naturalistic Observation and Ethnographic Methods
The greatest ecological validity arises when a researcher observes behaviors in naturalistic, or field, settings. When conducting naturalistic observation, the researcher is a passive observer of behavior. His intent is to be nonreactive and nonintrusive, so that the individuals under observation are free to behave with virtually no constraints. In human factors, one role of observational research is to characterize the way that people perform their work in real-world, functioning systems (Bisantz & Drury, 2005). For example, a human factors analysis of task performance could begin with observation of the task within the work environment itself. Sometimes the researcher will obtain a complete narrative record (i.e., a faithful reproduction of the behavior as it originally occurred). Often this will be in the form of a videotaped or audiotaped record that he can examine later for behaviors of interest.
Observation can be casual or formal. Casual observation is used most often at the earliest stages of research, to gather initial impressions about what is important and make decisions about how best to study it. Casual observation also provides an opportunity for researchers to see how users typically interact with a system. For example, through casual observation the researcher may note that an employee skips a checklist of procedures unless a supervisor is present. In later stages of research, most naturalistic measures are made through formal observation. Formal observations rely on a system of procedures developed by the researcher. When a certain set of behaviors is of interest, the researcher typically will record only those events that correspond to those behaviors. A checklist can be used to record the presence or absence of these specific behaviors. Measures of the frequency or duration of the behaviors then can be derived. Also, behaviors can be rated in terms of their amount, duration, or quality.
Observational measurement methods also vary in several other ways (Meister, 1985):
1.The observations can be recorded at the time the observation is made or later.
2.The content and amount of detail in the observations can vary.
3.The length of time during which observations are made can be short or long.
4.Observations can vary in terms of the amount of inference, or degree of interpretation, that is required to classify events into the measurement categories.
In conducting observational research, the investigator must develop a taxonomy of the behaviors that she will observe, decide on a strategy for observation, establish the reliability and validity of the taxonomy and strategy, and organize the resulting data in a way that makes sense (Sackett, Ruppenthal, & Gluck, 1978). In deciding on a behavioral taxonomy, the investigator determines whether the measurements are to be molecular or molar. Molecular measurements are defined in terms of specific actions, whereas molar measurements are more abstract and are defined according to function or outcome. For example, the number of times a particular lever is used on a control panel would be a molecular measurement, and the number of products completed on an assembly line would be a molar measurement.
One significant methodological advance in recent years has been the development of sophisticated computerized systems, such as The Observer® (Noldus Information Technology, Wageningen, Netherlands), for the collection and management of observational data, as well as for purposes of analysis. These systems can record many aspects of behavior, including the activities in which a person is engaged, their postures, movements, and positions while engaged in these activities, and so on. With the advent of laptop computers, tablets, and smartphones, this form of data collection has become particularly valuable for observations conducted in field settings. However, even using software like The Observer, analysis of observational data can be very laborious (Stanton et al., 2013).
One of the most important considerations in observational research is observer reliability. If an observer is unreliable, unreliable data will be produced. Reliable observations require well‑constructed measurement scales and well-trained observers. Typically, we establish reliability in observational research by using more than one observer. We can then calculate some measure of the agreement between the observers, such as the percentage agreement between two observers,
High observer reliability provides assurance that the measurements are accurate, but not necessarily that they are valid. We can use videotape to check the reliability of observers, as well as to provide a permanent record of the behavior for future reference.
Observational procedures are useful when there is not much data available on a topic. This kind of research often serves as a basis for hypotheses that can be tested later with experimental methods. It is also probably the most efficient way of doing research if we are interested in behavior in real-world settings. For example, observational procedures are very important for evaluating how users interact with a product in their natural surroundings (Beyer & Holtzblatt, 1998) or engage in distracting activities when operating a vehicle (Sullman, 2012). The general weakness of observational methods is that they do not provide a firm basis for drawing inferences about the cause of the observed behavior, because we can exert no systematic control over important variables.
An ethnographic study is a type of observational method that comes from the discipline of anthropology (Murchison, 2010). With respect to human factors, the method is used to understand the users’ culture and their work environments, and to identify the artifacts they use to accomplish goals. Unlike most observational techniques, ethnography relies on participant observation; that is, the observer actively participates with the users in the environment of interest. The ethnographic researcher spends time with the people being studied, with the intent of understanding them and their activities in the context of interest. Ethnographic research aims to represent the participant’s perspective and understanding of the phenomenon of interest; the context in which the phenomenon occurs is seen by the ethnographer as being as important as the phenomenon itself.
Possible drawbacks of ethnographic studies include their heavy reliance on subjective interpretations of the ethnographer and the fact that the participants’ behaviors could be influenced by the ethnographer. That is, the subjectivity that a researcher attempts to control in more traditional observational research is embraced in the ethnographic approach, rendering the results suspect from a scientific perspective. Also, ethnographic studies typically take a long time to conduct, because the researcher is trying to understand the group so well that she “becomes” a member of the group.
Within human factors, ethnographic methods may be used in product development, where the ultimate goal is to bring the group of potential users to life so that engineers have a sense of who the users of a product or system are, develop empathy for them, and ultimately develop products to fit their needs (Fulton-Suri, 1999). For example, Paay (2008) advocates the use of ethnographic methods in the design of interfaces for mobile information systems, suggesting that ethnographic data can be used as the basis for design sketches and subsequent mock-ups of proposed interfaces. Based on a study conducted using ethnographic methods to study teams performing software engineering projects, Karn and Cowling (2006) conclude, “Initial findings indicate that ethnographic methods are a valuable weapon to have in one’s arsenal when carrying out research into human factors” (p. 495).
Sometimes the best way to begin addressing a problem is by asking the people at work what they think. This information is invaluable, because the operators of a particular system will be familiar with it in a way that an outsider could not be. The questioning can be done informally, but often we will need to construct more formal surveys or administer questionnaires (Charlton, 2002). Questionnaires or surveys are particularly useful when you want to elicit information from a large group of users and the issues of concern are relatively simple. By using a carefully designed set of questions, you can obtain a succinct summary of the issues, and determine probable relations among variables. The benefits of questionnaires include being able to obtain information from different user populations and getting information that is relatively easy to code. However, the types of questions asked affect the validity of the questionnaire, and the return rate is typically low.
A questionnaire must be well constructed, but even the simplest questionnaire can be difficult to construct. As with any other measurements, the data that you obtained will only be as good as your measurement device. There are several steps involved in preparing a questionnaire (Harris, 2014; Shaughnessy, Zechmeister, & Zechmeister, 2014). First, decide on the information that you want the questionnaire to provide and prepare a plan for developing it. Then, decide whether to use a new questionnaire or one that is already available. If the latter, make sure that the questions are clear and unambiguous and that they are ordered such that earlier questions will not bias answers to later ones. After initial questionnaire development, revise and pretest the questionnaire with a small sample to fine-tune the final questionnaire.
Something else you must consider is the form of the responses, which can be open-ended or closed-ended. Open-ended questions allow the respondent to answer freely, which provides a lot of unstructured data that can be difficult to analyze. Multiple-choice questions are a common form of closed-ended questions that provide a limited number of distinct options and are easy to analyze. Another common response format is the rating scale. This allows the respondent to indicate a strength of preference or agreement with the statement being rated. For example, if you ask someone to rate the amount of workload imposed by a particular task, the possible responses could be very low, low, moderate, high, and very high.
We can use questionnaires in conjunction with other research methods to obtain demographic data such as age, gender, and ethnicity, and other background information. The results of surveys and questionnaires can be summarized by descriptive statistics of the type presented later in the chapter. As with all nonexperimental methods, we should be hesitant about inferring causal relations from questionnaire data. However, they can provide good starting points from which experimental investigations can proceed.
We can conduct structured and unstructured interviews with operators and users at any phase of the research process and for a variety of purposes (Sinclair, 2005). Structured interviews usually present a set of predetermined questions in a fixed order to all interviewees. The questions used in a structured interview should follow the same development procedure as used for questionnaires to avoid problems with misleading, poorly worded, and ambiguous questions. Unstructured interviews typically have few prepared questions, and the interviewer asks questions flexibly, with the responses of the interviewee used in part to direct the interview. Most interview techniques are “semi-structured”; that is, they have an intermediate degree of structure.
Focus groups usually consist of 5–10 users who are brought together in a session to discuss different issues about the features of a system, product, or service (Krueger & Casey, 2015). The group is directed by a moderator, who is in charge of keeping the group on track and getting all users involved in the discussion. Focus groups are good for getting information on different aspects of the system and allowing users to react to ideas presented by other users. Focus groups have the same disadvantages as questionnaires and interviews, the biggest being that what users say may not truly reflect what they do. For a number of reasons, users may not be able to articulate all the steps in a task they perform or knowledge they possess. Also, a single talkative individual can dominate or influence the discussion. Focus groups are good for determining high-level goals, such as generating a list of functions or features for a product. They do not work well for discovering specific usability problems in a product.
Diaries and Studies of Log Files
The purpose of a diary is to record and evaluate actions of a user over a period of time (Rieman, 1996). The user records events related to the task or product under study in a diary, as well as thoughts and insights regarding those events. The researcher can also provide a camera so that the user can take pictures that complement the diary. A video diary can be obtained if the user wears a wireless video camera to record work activities. Although user diaries can provide detailed information about the problem under study, it is important that the diary-keeping not be invasive or difficult to implement, or users will not keep detailed records. One additional, negative factor is the tendency of users to delay entering task information in the diary until a “convenient time.” This reduces the amount of information recorded and may result in a loss of some of the insights that users have as they perform the task.
An alternative to diaries is a log file. With a log file, users’ actions are recorded as they interact with a system, and these actions are analyzed to determine trends and predict behavior. Log files can be obtained relatively easily for any activities involving computer use, for example, users’ retrieval of files on their personal computers (Fitchett & Cockburn, 2015). A large amount of data can be collected from a variety of users, and the data collection process does not interfere with how each user would normally interact with the system. The drawback of log files is that irrelevant or incorrect data may be logged and important behaviors may not be logged. Furthermore, the data do not reflect any of the potentially relevant cognitive processes in which the users were engaged when performing the logged actions.
CORRELATIONAL AND DIFFERENTIAL RESEARCH
We have been discussing the techniques of naturalistic observation, in which the researcher makes no attempt to control the environment. Correlational research gives slightly more control than naturalistic observation. In correlational designs, we must decide ahead of time which behavioral variables we will measure. Typically, we choose these variables on the basis of some hypothesis about how they relate to each other. After we make the measurements, we use statistical procedures to evaluate how the variables change together, or covary. In the simplest case, we measure two variables to determine the degree of relationship between them. We can determine the extent of this relationship by calculating a correlation coefficient, as described in the statistical methods section. Correlational research can be conducted using any of the descriptive methods discussed in the present section.
The value of correlational procedures is that they enable prediction of future events based on the strength of the relationship between observed variables. That is, if we establish that a reliable relationship exists between two variables, we can predict with some accuracy the value of one when we know the value of the other. Suppose, for example, that the number of accidents attributable to operator error increases as the total number of hours on duty increases. We can use this correlation to predict the likelihood of an operator making an error given the amount of time spent on duty. Then, we could use this information to determine the optimal shift length.
We cannot say that one variable (like time on shift) causes another variable (error rate) to increase or decrease just because we observe that the factors covary. This restriction is due in part to the fact that uncontrolled, intervening variables may influence the correlation. Thus, while correlational procedures provide predictive power, they contribute relatively little to an understanding of the causal variables involved in the phenomena. For instance, although errors increase with time on duty, some other variable, such as boredom or fatigue, may be involved.
Research on differences between people is called differential research. Szalma (2009) indicates that it is important to consider individual differences in usability and human factors studies. Differential research examines the relations among variables for groups of people who share a common characteristic, such as high versus low intelligence or a difference in personality traits. Often, the distinction between groups serves as the basis for the choice of independent variables. For example, the performance of a group of young adults may be compared with that of a group of elderly people. The distinction between these two groups (age) is the subject variable. As we discussed above, subject variables are not true experimental variables because, by their very nature, they preclude the random assignment of people to groups and we can’t manipulate them. This means that there may be many unknown and uncontrolled variables covarying along with the designated subject variable.
How well a differential study provides insight into a phenomenon depends on the strength of the relation between the subject variable and the phenomenon of interest. Differential research has the additional benefit of allowing the use of more sophisticated statistical methods than are possible with the other research methods. But, as with the other nonexperimental designs described thus far, causal inferences are risky. Therefore, even if a phenomenon does covary with the subject variable, you cannot make a causal statement.
True experiments have three defining features:
1.They test a hypothesis that makes a causal statement about the relation among variables.
2.We compare a dependent measure at no fewer than two levels of an independent variable.
3.By randomly assigning people to experimental conditions, we make sure that the effects of many potentially confounding factors are distributed equally across the conditions.
Which particular independent and dependent variables we examine will depend on the hypotheses under consideration. With a random assignment, each person has an equal probability of being assigned to any condition. Random assignment ensures that there can be no systematic influence from extraneous factors, such as education or socioeconomic status, on the dependent variables. Consequently, we can attribute differences among treatment conditions solely to the manipulation of the independent variable. As such, we can make a causal statement about the relation between the independent and dependent variables.
An alternative to random assignment is to perform stratified sampling, whereby individuals are assigned to groups in such a way that the proportions of different subject variables, such as age and gender, are the same as the proportions of those variables in the population of interest. We can’t make causal statements about the relations between the dependent variables and these subject variables, but we increase the validity of the experiment by making sure our groups look as much like the population as possible.
Because of the restricted nature of laboratory experiments, well-designed experiments have high internal validity. As we noted earlier, this strict control can result in low ecological validity, because the controlled experimental situation is far removed from the real-world environment. Not too surprisingly, whereas experiments examining basic human capabilities, such as vision, tend to use artificial environments, experiments examining applied human factors issues often use simulated environments (e.g., performance in a driving simulator) or field settings (e.g., performance of actual driving).
In between-subject designs, two or more groups of people are tested, and each group receives only one of the treatment conditions of the independent variable. Subjects in such experiments are usually assigned to each condition randomly. Because subjects are randomly assigned, the groups are equivalent (within chance limits) on the basis of preexisting variables. Thus, any reliable performance difference should be a function of the independent variable.
In cases where we know that a subject variable is correlated with the dependent measure, we can use a matching design. There are several alternative matching procedures, but the general idea behind all of them is to equate all experimental groups in terms of the subject variable. For example, suppose you want to compare two methods for loading crates onto a truck and determine which method is best. The company by which you are employed has 20% female dock workers and 80% male. You will assign half the workers to one method and the other half to the other method. Because physical strength is strongly correlated with sex, if you use a strictly random assignment of workers to groups, one group might contain a higher percentage of females than the other and thus be less strong on the average. Consequently, any differences in performance between the two groups might not be due to the loading methods. A better way is to match the groups in terms of the percentages of males and females in each group, so that the physical strength in each group is approximately equal.
Matching designs allow the systematic distribution of subject variables across treatment conditions. Whereas random assignment ensures that there is no systematic difference in the makeup of the groups prior to the experiment, the matching procedure gives you the added confidence that you have spread a known extraneous factor (strength, in the example above) equally across the treatment conditions.
Random assignment, stratified sampling, and matching are ways by which we try to make groups equivalent. Another way to equate different groups is to use the same subjects in each one. That is, each person is tested in all conditions, and serves as his or her own control. This increases the sensitivity of the design, making it more likely that small differences in the treatment conditions will be detected. It also substantially reduces the number of people who must be tested.
Within-subject designs have two major drawbacks. First, carryover effects may occur, in which previously received treatment conditions influence a subject’s performance on subsequent conditions. Second, practice or fatigue effects may occur, regardless of the particular treatment orders. We can use various counterbalancing procedures to minimize these problems. Such procedures equate and/or distribute the order of treatments in various ways to minimize their impact. For example, if subjects are tested under both conditions A and B, we can counterbalance order by testing half with condition A followed by condition B, and half in the reverse order. Again, we would use random assignment, this time involving the assignment of people to the two orders. Although within-subject designs are useful for many situations, we can’t use them when a person’s participation in one condition precludes participation in another.
In most cases, we will manipulate more than one independent variable in an experiment. We can use any combination of between-, matched-, and within-subject designs with these manipulations. Such complex experiments enable the researcher to determine whether the variables have interactive effects on the dependent measure. That is, does the manipulation of one variable exert the same effect regardless of the presence of the other variable? If so, the effects of the variables are independent; if not, the variables are said to interact. We will discuss examples of such interactions later in the chapter. Examination of interactions among variables is important, because many variables operate simultaneously in the real world. Moreover, patterns of interaction and noninteraction can be used to infer the structure of the processes that underlie the performance of a task.
Whenever possible, we must use experimental designs to answer scientific questions. That is, if we desire a precise understanding of the causal nature of phenomena, experimental designs are necessary. However, this does not deny the importance of descriptive methods for the human factors specialist. Such methods provide important information about real-world systems that cannot be obtained from controlled experiments. They are useful not only in contributing to the human factors knowledge base, but also during the system design process, where they can be used to obtain quick information about user characteristics and usability that is helpful to designers (see Box 2.1). Also, in situations for which the specialist needs only to predict behavior without understanding of the causal mechanisms, descriptive procedures are useful. In short, because of the distinct strengths and weaknesses of the experimental and descriptive methods, a blend of both is necessary in human factors research. This point will be illustrated by an example in the last section of the chapter.
As the preceding paragraph suggests, it is important to keep in mind that the goals for basic and applied research are very different. Consequently, the studies you conduct from each perspective will be quite distinct. For basic research, your primary concern is internal validity, and you will often use artificial environments that allow you to control variables that are confounded in real-world environments. You will use the results of the research to test predictions derived from theories about underlying processing mechanisms, and your concern should be that the resulting theory will generalize to situations to which it is intended to apply. For applied research, however, your emphasis is on ecological validity, and your research setting should resemble the real-world environment of interest. Your results will let you make predictions about the real-world behavior of interest and generalize your findings to the real-world environment. Both basic and applied research are essential to the field of human factors and ergonomics.
BOX 2.1USABILITY EVALUATION AND USER EXPERIENCE
Human–computer interaction (HCI) and human factors specialists working in industry want to ensure that the products and systems developed by their companies are “user friendly.” The primary goal of this type of research is not to contribute to the scientific knowledge base but to see that the product or system is usable. Usability research is often conducted to meet short deadlines, and often, early in the design process, controlled experiments cannot be conducted. Because controlled experiments are impossible to perform, there are several other methods that human factors specialists can use to assess usability (see Vu, Zhu, & Proctor, 2011), and these can be classified as either inspection-based or user-based.
Usability inspection methods are techniques used by software developers and human factors professionals to assess a system’s usability without testing users (Cockton, Woolrych, Hornbæk, & Frøkjær, 2012). Among the most well-known of these methods are heuristic evaluation and cognitive walkthrough. For a heuristic evaluation, one or more usability experts determine whether the software, website, or product under consideration conforms to established guidelines such as “minimize user memory load.” Because different evaluators tend to find different problems, usually 5–7 evaluators are needed to find most of the usability problems. For a cognitive walkthrough, the usability expert interacts with the system by performing tasks that a user would typically perform and evaluates the system from the users’ perspective. For each of the steps required to achieve a certain goal, such as pasting a picture into text and adjusting its size and location appropriately, the evaluator tries to answer questions about whether the required action will be intuitive to the user. Both the heuristic evaluation and cognitive walkthrough depend on the availability of experts to make the evaluations and on the use of appropriate heuristics or tasks in the evaluation process.
User-based evaluations are usually called usability tests (Dumas & Fox, 2012). Designers perform these tests in a usability lab that is intended to mimic the environment in which the system will be used. The designers must be sure to select users for a usability study who are representative of the target user group. The designers record the users’ behavior as they perform certain tasks. Often an observation room adjoins the test room, separated from it by a one-way mirror, through which the designer can observe the user performing the tasks. Some measures that the designer might record include standard behavioral measures such as the time to perform a task and the number of tasks completed successfully.
The designers will also make a continuous video/audio recording of the session in case they need to do further analysis of the user performance. Furthermore, verbal reports obtained from users during the test and follow-up interviews or questionnaires given to users after the test can provide additional information regarding user preferences of the product. The design of the usability test is typically quite simple, and designers will test only a small number of subjects (5 or more), since the goal is to obtain quick, useful information for design purposes and not to add to the scientific database.
Other methods used in usability evaluation include ethnographic methods and diary studies of the type described in the text, as well as interviews, focus groups, and questionnaires (Volk, Pappas, & Wang, 2011). These methods are used to understand how users interact with the product and to obtain their preferences regarding product characteristics. The methods generally provide a large amount of qualitative data that may be valuable to the design team. However, a lot of time and effort is required to collect and analyze data using these methods, and extensive interpretation of the users’ data is necessary.
User experience is a broader concept, which includes usability but also is affected by other aspects of the product or system. According to Nielsen and Norman (2016), “The first requirement for an exemplary user experience is to meet the exact needs of the customer, without fuss or bother. Next comes simplicity and elegance that produce products that are a joy to own, a joy to use.” Note the emphasis here on creating a pleasurable experience, which means that the user’s emotional reaction is considered to be one of the most important dimensions (Jokinen, 2015). Apple, Inc. have the reputation of emphasizing the overall user experience in their product designs, taking a system perspective on value to the customer (Pynnönen, Ritala, & Hallika, 2011). The aim is to fulfill the wants and needs of the customer, and consumers can assume that Apple’s products and services have been designed with this aim in mind. The usability of a device’s interface (e.g., that of an iPhone) is treated along with the usability of the service–user interface (e.g., for iTunes) as a system, so that the entire experience of interacting with the service through the device will be positive for users. Trust established with users regarding the pleasurable user experience results in many who stand in line to buy a new product when it is introduced.
User experience is difficult to measure, but studies typically use subjective ratings as their primary data. For example, Cyr, Head, and Larios (2010) compared the user experience of an electronics e-commerce site displayed using three distinct website color schemes (blue, gray, and yellow). Subjects from Canada, Germany, and Japan rated their disagreement/agreement (on a 1–5 scale) with statements about the pleasantness of the color scheme, trust in the website, and overall satisfaction with the site. The yellow scheme was rated as less appealing than the other two color schemes, and these ratings also correlated highly with the ratings of overall satisfaction with the website. The assumption is that users who are less satisfied with their experience of a website or product are less likely to use or purchase that product in the future.
The results obtained from both descriptive and experimental research typically consist of many numerical measurements for the variables of interest. These results must be organized and analyzed if they are to make sense to the researcher and to others who wish to make use of the information. We use statistical methods to perform these functions. There are two types of statistical procedures: descriptive and inferential. For each kind of statistics, we have to distinguish between samples and populations. A sample is a set of measurements made on a subset of people from a larger population. Rarely do we have the resources to measure an entire population, so we depend on samples to tell us what the population characteristics are.
As implied by the name, descriptive statistics describe or summarize the results of research. One concept that is fundamental to descriptive statistics is that of the frequency distribution. When we obtain many measurements of a variable, we can organize and plot the frequencies of the observed values. For example, if we have a group of people estimate the mental workload imposed by a task on a scale of 1–7, we can record the number of people who responded with each value. This record of the frequency with which each score occurred is a frequency distribution. A frequency distribution often is plotted in the form of a frequency polygon, as is shown in Figure 2.3. A relative frequency distribution, also shown in the figure, displays the same plot on the scale of the proportion (or percentage) of times that each score was observed. We can describe a score in terms of its percentile rank in the distribution. A percentile is a point on a measurement scale below which a specified percentage of scores falls. The percentile rank is the percentage of scores that falls below that percentile. We use percentile ranks for, among other things, creating tables of anthropometric data and applying these data in the design of equipment for human use.

FIGURE 2.3Frequency and relative frequency polygons.
CENTRAL TENDENCY AND VARIABILITY
Although a distribution helps to organize the data from research, other summary values may convey the crucial information more succinctly. Typically, measures of central tendency and variability are the primary descriptive statistics reported in research articles. Measures of central tendency indicate the middle or representative score for the distribution. Most studies present their results in the form of measures of central tendency, such as means or medians. The arithmetic mean is obtained by adding up all of the score values and dividing by the total number of scores. If X represents the variable of interest, then the mean X is given by
where X i refers to the ith of n scores. The mean is an estimate of the population mean μ. The median is the score which 50% of the distribution falls below and 50% above, or, in other words, the score with the percentile rank of 50%. The mean and median values are equivalent for a symmetric distribution, but not otherwise. If there are extreme low or high scores, the median may be a better estimate of central tendency, because it is sensitive only to the ordinal properties of the scores and not their magnitudes.
One other measure of central tendency is the mode, the most frequently occurring score. In most cases, the mode will not be very useful. However, for qualitative (non-numeric) variables, it is the only meaningful measure of central tendency. The mode is also used to classify the shapes of distributions. For example, a distribution is said to be unimodal if it has only one mode and bimodal if it has two.
Measures of variability provide indications of the dispersion of the individual scores about the measure of central tendency. In other words, most scores may be close to the most typical score, or they may be widely dispersed. Measures of variability increase as the amount of dispersion increases. The most widely used measures of variability are the variance and the standard deviation. The formula for the variance of a sample of scores is
where: |
|
|
represents the sample variance, |
X |
represents the mean, and |
n |
represents the number of scores or observations in the sample. |
This statistic is an estimate of the population variance σ2. Another name for the variance is mean squared deviation, which emphasizes that the variance reflects the average of the squared deviations of each individual score from the mean.
The sample standard deviation is obtained by taking the square root of the sample variance:
The advantage of the standard deviation for descriptive purposes is that it exists in the same scale as the original measurements and thus gives a measure of how different the scores are from the mean. Note that both the variance and the standard deviation are always positive numbers.
In many situations, the population from which a sample was taken will approximate a normal (Gaussian) curve (unimodal, bell-shaped and symmetric; see Figure 2.4). If measurements come from a normal distribution, we can describe them by their population mean µ and standard deviation σ. Because there are an infinite number of normal distributions (since there are an infinite number of values for µ and σ), we frequently transform such distributions into the standard normal distribution, which has mean 0 and standard deviation 1. Measurements from the standard normal distribution give the value of the variable X in terms of the number of standard deviation units it is from the mean. Such measurements are called z-scores, and we compute the z-scores of a sample as
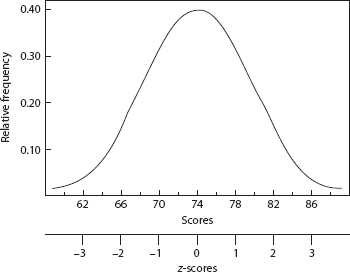
FIGURE 2.4A normal distribution with X = 74 and S = 4, and corresponding z-scores.
The score z i is the z-score corresponding to the ith observation in the original scale of the variable. z-scores are useful because it is more informative to know that z i = 1.0, meaning one standard deviation above the mean, than to know that X i = 80, where we don’t know what the mean and standard deviation are.
We can transform any sample of measurements into z-scores, even if the sample was taken from a population that is not normally distributed. However, for the resulting sample of z-scores to represent a sample from a standard normal population, the measurements X must be normally distributed. Because any normally distributed variable X can be transformed into z-scores, the relative frequencies and percentile ranks of normally distributed variables are presented in z tables (see Appendix I).
As an example, in 1985, the thumb-tip reach, or distance from thumb to shoulder, for U.S. women has a mean of 74.30 cm and a standard deviation of 4.01 cm. For a woman with a thumb-tip reach of 70.00 cm, the z-score would be
or 1.07 standard deviation units below the mean. Using the table in Appendix I, we can determine that this individual has a percentile rank of 14%. In other words, 14% of women have a shorter thumb-tip reach than this person.
In correlational research, a common descriptive statistic is the Pearson product-moment correlation r:
where X and Y are the two variables and
is the covariance between X and Y. The covariance between two variables is a measure of the degree to which changes in one variable correspond to changes in another. The correlation coefficient is an indicator of the degree of linear relationship between two variables.
The coefficient r is always between −1.0 and +1.0. When X and Y are uncorrelated, r will equal 0. When r is 0, there is no linear relationship between X and Y. When they are perfectly correlated, r will equal +1.0 or −1.0, and the values of one variable can be related to the values of the other variable by a straight line. A positive correlation means that, as values of X increase, so do values of Y; a negative correlation means that, as values of X increase, those of Y decrease. Figure 2.5 provides illustrations of data for several values of r. Note that X and Y may be related to each other and still be uncorrelated. Because r only measures linear relationships, if X and Y are nonlinearly related, say, Y = X2, the correlation may be zero. Another useful statistic is r2, which gives the proportion of total variance that can be traced to the covariance of the two variables. It is often said that r2 reflects the amount of variance “explained” by the linear relationship.

FIGURE 2.5Scatterplots for different correlations between X and Y variables.
We can illustrate the use of the correlation coefficient, as well as means and standard deviations, with an example. Lovasik, Matthews, and Kergoat (1989) investigated the effect of foreground and background color on performance of a visual detection task, in which people were asked to search a computer display for a target symbol during a 4-h period. The observers’ response times to find the target in each display were measured as a function of the amount of time they had already spent on the task and the foreground and background colors of the display. Table 2.1 presents the search times under all time-on-task and color conditions for each observer. These search times are the percentage of the observers’ search times after half an hour on the task.

In Table 2.1, we compute the mean percent search times for each of the three color conditions. Note that a mean of 100% means there was no improvement from the initial search time, and that the smaller the mean is, the greater the improvement. Observers showed virtually no improvement in the red/green condition, and the most improvement in the blue/black condition. We compute the variance of the target search time in Table 2.2, as well as the correlation between search time and time-on-task. The red/green condition has the smallest variance. The correlations between time-on-task and search time are negative for all display conditions, indicating that as time-on-task increased, search time decreased.

Inferential statistics rely on the concepts of probability theory. We speak of events as having some probability of occurring when we are uncertain of the outcome. Probabilities are measurements that assign a number from 0.0 to 1.0 to an event, according to how likely that event is to occur. Probability represents the proportion of times that the event occurs relative to all other possible events. Thus, a probability distribution is a relative frequency distribution over the entire set of possible events. If an event has a probability of 0.0, then it has no chance of occurring. If an event has a probability of 1.0, then we know with absolute certainty that it will occur. If an event has probability 0.5, then approximately half of the outcomes will consist of that event. For example, the event heads that could be observed on the toss of a fair coin has probability 0.5. Thus, if we flip the coin many times, we would expect to observe heads approximately half of the time.
The combined outcome of two separate events is called a joint event. For example, if we rolled two dice and observed two dots on the first die, event 2, and four dots on the second die, event 4, the outcome (2, 4) is a joint event. Just as we can observe a relative frequency distribution over all possible outcomes of a single event, we can observe a joint relative frequency over all possible outcomes of a joint event. In other words, we can calculate the proportion of times that each possible joint event occurs.
The two events that make up the joint event may or may not depend on each other. If knowing the outcome of the first event provides no information about what might happen for the second event, then the two events are independent. This implies that, for independent events A and B, the probability of the joint event A and B, written A∩ B, is
That is, the joint probability can be written as the product of the marginal probabilities of the individual events. It is possible, however, that the outcome of the first event influences the outcome of the second, in which case the two events are dependent. For dependent events, the probability that event B occurs given that event A occurred is
Probabilities are important, because a researcher tests a sample selected from a larger population. However, the researcher is not interested in reaching conclusions about the specific sample, but about the population from which it was drawn. Yet, because the entire population was not measured, there is a probability of some measurement error. For example, if you are interested in determining the mean height of adult males for a particular population, you might measure the height for a sample of 200 males. Each height that you observe has some probability of occurring in the population, which has an average around 5 ft 10 in. You could compute the sample mean and use it as an estimate of this population mean. However, it is only an estimate. It is possible, although not likely, that all 200 men in the sample would be taller than 6 ft. Thus, the sample mean would be greater than 6 ft, even though the population mean is closer to 5 ft 10 in. This is an instance of sampling error. Generally, increases in the sample size will lead to more precise estimates of the population characteristic of interest.
Probability theory will be important in later chapters. The concepts of probability theory are central to reliability analysis (Chapter 3), signal-detection theory (Chapter 4), and decision theory (Chapter 11). They also are pivotal to simulations of human and system performance.
Statistical Hypothesis Testing
Typically, in conducting experiments or other types of research, the researcher wants to test hypotheses. In the simplest type of experiment, two groups of subjects may be tested. One group receives the experimental treatment and the other, referred to as the control group, does not. The concern is whether the difference between the two groups results in a change in a dependent variable. Usually, we will compute the sample means for this variable for each group. We can compare these means to determine whether they differ. However, because these sample means are only estimates of the population means and are subject to sampling error, just examining these values will not tell us whether the treatment had an effect. In other words, we need a way to decide how much of a difference between the sample means we need to see before we conclude that the difference reflects a “real” difference in the population means.
Inferential statistics provide a way to answer this question. In our two-group experiment, we begin by formulating a null hypothesis. The null hypothesis is that the treatment had no effect or, in other words, that the population means for the two conditions do not differ. The inferential test determines the probability that the observed mean difference could have been due solely to chance, given some estimate of error variance and assuming that the null hypothesis is true. It is important to note that the researcher does not know whether or not the null hypothesis is true. Based on the probabilistic evidence provided by the statistical test, the researcher must decide whether to accept or reject the null hypothesis. The combination of two possible states of the world (null hypothesis true or false) with two possible decisions (null hypothesis true or false) yields a 2 by 2 matrix of outcomes, two of which are correct (see Table 2.3).
TABLE 2.3
Statistical Decision Making
|
Decision |
|
Null Hypothesis |
True |
False |
True |
Correct Acceptance (1−α) |
Type I Error (α) |
False |
Type II Error (β) |
Correct Rejection (1−β) |
As the table shows, two distinct types of errors can occur when trying to infer characteristics of the population from the sample. The first of these is called a type I error. This type of error occurs when the sample mean difference is sufficiently large that the null hypothesis is rejected, but in fact, the population mean difference is zero. The second, called a type II error, occurs when the population means are different, but the observed sample means are sufficiently similar that the null hypothesis is accepted. The researcher, given some knowledge about the distribution of the population means, must select an acceptable probability for a type I error by deciding the point at which the null hypothesis will be rejected. This probability is called the α-level.
Traditionally, the rule has been to conclude that the experimental manipulation had a reliable or significant effect if the difference between the sample means is so large that the probability of obtaining a difference that large or larger is less than 0.05, if the null hypothesis were true. The null hypothesis is not rejected if this probability is greater than 0.05. If a 0.01 α-level were used instead, the probability of a type I error would be less, but the probability of a type II error would increase. In other words, the criterion level adopted by the researcher affects the relative likelihood of each error occurring (Lieberman & Cunningham, 2009).
Whenever differences between conditions are reported for experiments described in this book, it can be assumed that the difference was significant at the 0.05 level. Remember that a significant difference is meaningful only in a well-designed study. That is, a significant inferential test suggests that something other than chance apparently was operating to distinguish the two groups, not what that something was. Also, failing to reject the null hypothesis does not necessarily mean that the independent variable had no effect. The failure to show a reliable difference could reflect only large measurement error or, in other words, low experimental power.
One widely used inferential test that is important to issues discussed later in the text is the analysis of variance (ANOVA). One strength of the ANOVA is that it can be applied to experiments with complex designs. The ANOVA allows us to evaluate the interactions between different independent variables. In the two-variable case, an ANOVA will tell not only whether each variable had an overall effect on the dependent variable (i.e., a main effect), but also whether the two independent variables together had an interactive effect. Figure 2.6 shows some example patterns of interaction and noninteraction. Nonparallel lines indicate interactive effects, whereas parallel lines indicate independent effects. When an experiment includes more than two independent variables, we can evaluate complex interaction patterns among all of the variables in the same way.

FIGURE 2.6Example patterns of interaction and noninteraction.
As an example, alcohol and barbiturates are known to have interactive effects on behavior. If A and B represent the level of alcohol and barbiturates consumed, respectively, let A0 indicate no alcohol and B0 no barbiturates, and A1 and B1 some fixed dosage of each. Figure 2.7 shows an interaction of these variables on driving performance, where the dependent variable is the variance of the distance from the center of the lane in feet squared. As you can see, performance under the combined effect of both drugs is considerably worse than with either drug alone.

FIGURE 2.7Interactive effects of alcohol (a) and barbiturates (b) on driving performance.
A STUDY EVALUATING HUMAN FACTORS DESIGN
To make some of the issues regarding research and statistical issues concrete, we will discuss in detail a specific study that, although conducted several decades ago, still provides an excellent example of how various types of research methods can be brought to bear on solving a specific human factors problem. Marras and Kroemer (1980) conducted a laboratory and field study on design factors crucial to the efficient operation of boating distress signals. To begin, Marras and Kroemer surveyed the distress signals that were available on the market and categorized them according to the steps that were required to identify, unpack, and operate them. After they categorized the signals, they conducted a preliminary study in which naive and experienced boaters were videotaped while operating the signals. They used the performance of these individuals with the various signals to identify the design variables of interest, such as form, labeling, size, and so on.
The next stage in the study was a series of laboratory tests in which they used each identified design variable as an independent variable in an experiment. For example, one test investigated how different shapes affected the identification of the distress-signal device. They painted three differently shaped flares (one that fully complied with proposed human factors regulations, one that partially complied, and one that did not comply) red and left them unlabeled. The person’s task was to pick up the flare from among five other devices, and the researchers measured the time it took them to do so. They found that people selected the flare that complied with the human factors guidelines faster than the flare that did not.
The final stage of the study took place in a natural environment. They took their participants by boat to an island where they boarded a rubber raft that was rigged to deflate. They told the boaters that the purpose of the study was to rate the visibility of a display shown from shore. They placed one of two types of hand-held flares on board the raft (see Figure 2.8). They pushed the raft onto the lake, and within 2 min it began to deflate, prompting the boater to use the distress signal. Then they pulled the participant back to shore, and repeated the procedure with the second device. Table 2.4 shows the total times required to unpack and operate the two types of flares for 20 people.
TABLE 2.4
Results of On-Water Experiments: Performance Times in Minutes
Subject |
Flare A |
Flare B |
1 |
0.21 |
1.46a |
2 |
0.29a |
0.87 |
3 |
0.10 |
0.64a |
4 |
0.23a |
0.92 |
5 |
0.24 |
0.81a |
6 |
0.43a |
0.36 |
7 |
0.42 |
1.42a |
8 |
0.16 |
2.32a |
9 |
0.11 |
0.80a |
10 |
0.10a |
2.23 |
11 |
0.25a |
0.72 |
12 |
0.22 |
0.98a |
13 |
0.57a |
1.39 |
14 |
0.44 |
2.53a |
15 |
0.35a |
0.73 |
16 |
0.67a |
1.84 |
17 |
0.20 |
1.87a |
18 |
0.27a |
2.45 |
19 |
0.26 |
2.14a |
20 |
0.26a |
1.04 |
Mean |
0.289 |
1.376 |
Standard Deviation |
0.152 |
0.687 |
aFirst trial. | ||

FIGURE 2.8The two types of hand-held flares tested.
For flare A, which had a handle that clearly distinguished the grip end of the flare, the mean performance time was 0.289 min. For flare B, which did not have a clearly distinguished grip, the mean performance time was 1.376 min. An analysis of variance showed that the difference was significant. In other words, the grip reliably reduced total performance time.
One nice characteristic of this study is that it shows the systematic progression from descriptive survey and observational methods, to controlled laboratory experiments, and back to a field experiment conducted in an ecologically valid setting. Thus, the research coupled the ecological strengths of the observational and field methods with the internal strengths of the experimental method. In this way, the study provides an ideal example of how different research methods can be combined to address a specific human factors problem.
You should be able to determine from the description of the field experiment that it used a within‑subjects design, because each person was tested in both flare conditions. Therefore, the order in which the flares were used is an extraneous variable that could potentially confound the results. For example, if flare A had been tested first and flare B second for all people, then the disadvantage for flare B could have been due to fatigue, or some other order effect, such as the absence of fear in the second test. To control for such order effects, Marras and Kroemer (1980) counterbalanced the order in which the two devices were tested. Half of the people were tested with flare A first, and half were tested with flare B first.
Even though order was counterbalanced, you still might question the appropriateness of the within-subject design. One reason for conducting the field experiment was for boaters to perform in a real emergency. After the test with the first flare, it is very likely that the boaters became aware of the true purpose of the experiment. No evidence is apparent in the data that performance was affected greatly by any such awareness, so it may not be a problem. This potential drawback of the within-subject design was offset by the benefits that fewer people had to be tested and extraneous variables, such as boating experience, were equated for the two conditions. This example of the relative merits of within- and between-subject designs indicates that there are no hard and fast rules for making research design decisions.
The changes in smoke signal and flare design that Marras and Kroemer (1980) recommended on the basis of their study were subsequently instituted. In 1987, Kroemer remarked,
But nowadays, if you go into the store and buy those marine emergency signals, they are of different colors, they are of different designs, and they work fine. Nobody ever said anything but I have always considered this one of the very satisfying results. We may have saved some people this way. This really made me happy. We never got any formal reply but we know it was being used—that’s the best. (quoted in Rogers, 1987, p. 3)
The present chapter has provided an outline of the basics needed to understand research in human factors. Human factors is an applied science. Thus, scientific reasoning guides the activities of the researcher and the designer. Because science relies on empirical observation, the methods by which we make these observations are of fundamental importance. Furthermore, we must understand the statistics used to summarize and evaluate these observations.
The scientific approach requires the continuous development and refinement of theory based on our observations. The observations provide the basic facts, and the theories help to explain why they are so. Good theories not only explain but also make predictions about new situations and allow us to optimize performance in those situations.
The research methods used to obtain data vary according to how tightly controlled the setting is and to how much the setting approximates the environment of interest. Laboratory experiments typically are highly controlled but have low ecological validity, whereas descriptive methods tend to be relatively uncontrolled but have high ecological validity. Thus, the choice between the various experimental and descriptive methods depends on the goals of the study, and often some combination of methods provides the best understanding of a human factors issue.
Data are summarized and evaluated by means of descriptive and inferential statistics. Proper conclusions require the use of appropriate statistical analyses. Probability and statistics underlie many of the more sophisticated analyses of human performance that will be encountered later in the text, as well as those of human reliability, which will be covered in the next chapter.
Bechtel, W. (1988). Philosophy of Science: An Overview for Cognitive Science. Hillsdale, NJ: Lawrence Erlbaum Associates.
Chalmers, A. F. (2014). What Is This Thing Called Science? (4th ed.). Indianapolis, IN: Hackett.
Creswell, J. W. (2013). Introduction to Qualitative Research Methods (4th ed.). Thousand Oaks, CA: Sage.
Haig, B. D. (2014). Investigating the Psychological World: Scientific Method in the Behavioral Sciences. Cambridge, MA: MIT Press.
Meister, D. (1985). Behavioral Analysis and Measurement Methods. New York: Wiley.
Pagano, R. R. (2010). Understanding Statistics in the Behavioral Sciences (9th ed.). Belmont, CA: Cengage Learning.
Proctor, R. W., & Capaldi, E. J. (2006). Why Science Matters: Understanding the Methods of Psychological Research. Malden, MA: Blackwell.
Rubin, J., & Chisnell, D. (2008). Handbook of Usability Testing: How to Plan, Design, and Conduct Effective Tests. Hoboken, NJ: Wiley.
Stanovich, K. E. (2013). How to Think Straight about Psychology (10th ed.). Boston, MA: Pearson.