


Report authoring
IBM Cognos Business Intelligence (BI) is an integrated business intelligence suite that provides a wide range of functionality to help you understand your organization's data. Everyone in your organization can use Cognos BI to create (or author) and view business reports, analyze data, and monitor events and metrics so they can make effective business decisions.
You use the web-based authoring interfaces of Cognos BI to create and update your reporting and analysis applications. This chapter describes considerations for authoring high-performing applications that satisfy analytical requirements of users.
The chapter contains the following sections:
5.1 Authoring interfaces
Cognos BI integrates many business intelligence activities in one web-based solution. Table 5-1 outlines how the primary Cognos BI user interfaces can help you do your job. The two most popular authoring interfaces for new applications, Cognos Workspace Advanced and Report Studio, are described in more detail later in this section.
Table 5-1 Authoring interfaces in Cognos BI
|
Interface
|
Activity
|
|
Cognos Workspace
|
Create and share interactive dashboards
|
|
Cognos Workspace Advanced
|
Author simple reports and explore your data
|
|
Report Studio
|
Author professional reports intended for a wide audience
|
|
Event Studio
|
Manage events and alerting
|
|
Query Studio
|
Query your data on an ad hoc basis
|
|
Analysis Studio
|
Explore your dimensional data
|
|
Note: For advanced techniques of Cognos BI report authoring, see the Reporting section of the Business Analytics developerWorks page:
|
5.1.1 Cognos Workspace Advanced
Cognos Workspace Advanced is used for advanced data exploration and authoring simple reports.
When you are in Cognos Workspace and want to perform deeper analysis and report authoring, you can seamlessly graduate to Cognos Workspace Advanced, where you can do more advanced data exploration, such as adding more measures, conditional formatting, and advanced calculations. You can also launch Cognos Workspace Advanced directly from the Cognos Connection portal.
With Cognos Workspace Advanced, you can create reports with relational or dimensional data sources, and then show that data in lists, crosstabs, and charts.
See the information center for Cognos Workspace Advanced version 10.2.1:
5.1.2 Cognos Report Studio
With Cognos Report Studio, report authors can create, edit, and distribute a wide range of professional reports. Report Studio is ideal for certain kinds of reports:
•Reports intended for wide audiences
•Reports that will require maintenance as requirements and data change
•Reports whose appearance must be controlled in fine detail
With Report Studio, you can create any reports that your organization requires, such as invoices, statements, and weekly sales and inventory reports. You can also author sophisticated, multiple-page, multiple-query reports against multiple data sources.
Report Studio provides powerful functionality, such as bursting, prompts, maps, and advanced charting, and provides many ways to customize reports. Report Studio is also where you can author Cognos Active Reports, which enable an interactive analytics experience in a self-contained application for browsing and exploring data offline.
See the information center for Report Studio version 10.2.1:
5.2 Processing report executions
When you create a report, you are actually creating an XML report specification. The report specification defines the queries that are used to retrieve data and the layouts and styles that are used to present the data. For simplicity, the report specification is named the same as the report. Figure 1-1 on page 4 presents the workflow of communications when a report is run.
Running reports and performing analysis requires the processing of data that consists of computing calculations, joins, unions, filters, grouping, sorting, and other operations on data. The Cognos BI query service, which operates in a Java process, and the underlying data source are responsible for this data processing.
Further processing is required to render the processed data in the requested format such as HTML, Adobe PDF, Microsoft Excel, and so on. The report service and batch report service, which operate within BIBusTKServerMain processes, are responsible for this rendering activity, which includes rounding and all other data formatting.
When users run reports, users must wait for both data processing and rendering processing to be completed before the output is displayed. This combined processing time can occur in less than one second or it can take considerably longer, depending on the complexity of the operations required and the amount of data involved. Understanding the processing that occurs when reports are run will help you minimize user wait times.
5.2.1 Local and database processing
Cognos BI supports answering a rich variety of analytical questions. Although the underlying database may be able to answer some of these questions, many complex questions require the Cognos server to compensate by performing further data processing locally.
Data processing performed by the Cognos BI server is referred to as local processing. Data processing performed by the database server is referred to as database processing.
Except for when the requested data already resides within the query service’s in-memory cache, database processing is typically faster than local processing for the following reasons:
•Database processing can use indexes and other accelerators defined on the stored data.
•Database processing occurs closer to where the data is stored.
•Database processing reduces the amount of data transferred from the database server to the Cognos BI server.
To the extent possible, the Cognos BI server exploit the query language supported by the database. For databases with a limited query language, Cognos BI still allows users to ask questions of their business data without being restricted by the limitations of their database. This is because Cognos BI supports many types of queries that many databases do not support, which enables a consistent experience with the Cognos software regardless of what technology is storing the data. Users can create reports that require a particular type processing even if the underlying database does not support that processing; if necessary, the Cognos BI server will do that processing. As explained previously, there is typically a performance cost to local processing, usually because unnecessarily large amounts of data are sent from the database to the Cognos BI server. For these reasons, performance is best when as much processing as possible is delegated to the database.
IBM InfoSphere® BigInsights™, an enterprise class derivative of Apache Hadoop, can help illustrate the contrast between local processing and database processing. BigInsights 2.1 includes an Apache Hive 0.9 interface, but for performance reasons, its Big SQL interface is the preferred way of interoperating Cognos BI and BigInsights. When the Cognos BI server connects to BigInsights through the Big SQL interface, it uses industry-standard SQL, which is much richer than Hive query language. This means Cognos can derive more benefit from the massive parallel processing of a BigInsights cluster than from connecting through the Hive interface. For example, windowed aggregates is a type of processing where aggregation is performed on a certain window of data, such as for a particular time period. The concept or windowed aggregates is common in business intelligence scenarios, so, naturally, the Cognos BI server supports it locally. However, to optimize performance, Cognos will submit the windowed aggregate processing to any database that supports it. When windowed aggregates are required and Hive 0.9 is being used, the Cognos server must compute those aggregates itself. But if Big SQL is being used, the Cognos server can rely on the BigInsights cluster to compute the windowed aggregates.
5.3 Database functions
The authoring interfaces that are independent of data source in Cognos BI offer users a consistent experience across all supported data store technologies. Supporting those authoring interfaces is a robust query engine that interprets user gestures and report specifications and translates them into queries that are tailored to the technology being used. The Cognos BI server optimizes the queries it generates for performance, which typically involves submitting as much as possible of the necessary data processing down to the database.
When you connect your Cognos BI server to an analytic data store such as SAP HANA, Oracle Exadata, or one of the IBM PureData™ systems, the Cognos server detects which version of the database software has been loaded onto the system. It then employs the native query functions that are supported by that software, such that the data appliance does as much of the processing as possible and only a minimized result set is returned. So if you are using a 2013 version of IBM PureData for Analytics, the Cognos software knows that it is interoperating with IBM Netezza® version 7 software and will utilize native Netezza 7 functions in its queries.
Most of the authoring interfaces of Cognos BI, including Report Studio and Cognos Workspace Advanced, offer expression editors. An expression is any combination of operators, constants, functions, and other components. You build expressions to create calculation and filter definitions.
When the query service parses an expression that an author entered into a report, it recognizes scalar functions from its library and then determines if it needs to process a particular function locally or if it can re-map that function to an equivalent native database function. When an unrecognized function is encountered, the query service s submits it to the database. If it is a valid function on the database, it is processed successfully, otherwise the error that is returned from the database is written into the Cognos BI server logs.
You typically do not have to import user-defined scalar database functions into the Framework Manager model before you can use them in the expressions you compose. An exception is when the database requires you to qualify the reference and does not provide an ISO-SQL-style search path with which to locate non-qualified functions, for example HOTEL.BAR('HELLO') instead of BAR('HELLO').
5.4 Dimensional and relational reporting styles
There are two distinctive report authoring styles in Cognos BI: dimensional style and relational style.
The relational reporting style is used for the pure relational analytics option, which is explained in 1.4.1, “Pure relational analytics” on page 7. This style is often used for lists because lists are consistent with the structure of tables in a relational database. In relational reporting, you summarize data by using headers and footers in lists, summary functions, and within detail aggregation. You refine data in relational reporting with summary or detail filters.
The dimensional reporting style is employed for the dimensionally modeled relational (DMR) option and online analytical processing (OLAP) data sources. Dimensional data is best represented by crosstabs, maps, and charts. This data is shown in dimensions, hierarchies, levels, and members. In dimensional reporting, you summarize or roll up data by using member summaries and within set aggregation. You refine or focus data by adding only the relevant members to the edge of a crosstab or to the context filter. You can also enable drilling up and drilling down in dimensional reports.
The preference is that a single reporting style, either relational or dimensional, be used when developing a query. Unexpected results can occur if you mix the two styles within a query.
When working with DMR or an OLAP data source, the authors recommend that you not use relational functions, such as substring and concatenation functions, in any report that also contains a measure with the Aggregate Function property set to Calculated or Automatic. If you do so, you might encounter unexpected results. For example, some summaries are calculated using the minimum function instead of the aggregate function derived from the individual query items.
In the expression editor, an exclamation mark (!) that precedes a function indicates that the function is not naturally supported for that data source. In such cases, the Cognos BI server uses a local approximation for the non-supported function. Because an approximation is used, performance can be degraded and the results may not be what you expect.
|
Note: For more information about reporting styles, see the following pages in the product information center:
•Relational reporting:
•Dimensional reporting
|
5.5 Suppression
Sparse data can result in crosstabs showing empty cells. For example, a crosstab that matches employees with products will show multiple empty rows for the revenue measure if the employee does not sell those products. A product that has no sales for a given quarter may result in a very large report with thousands of cells that contain no data. So suppressing rows and columns that contain only null values makes a report more concise and easier to read.
All authoring interfaces of Cognos BI offer suppression buttons on their toolbars. You can suppress rows or columns or rows and columns based on divide by zero, missing, and overflow values.
The time required to evaluate a query to determine which rows and columns contain only null values is mainly determined by the number of cells in the result set. Other factors such as the nesting levels on the axes and the use of complex calculated columns might also affect the time required.
The number of cells in a result set of a dimensional query is determined by the number of cross joins, which are the Cartesian product of member sets. The number of cross joins are calculated as follows:
crossjoin ({a1, a2}, {b1,b2}, {c}) = {(a1,b1,c) (a1,b2,c) (a2,b1,c) (a2,b2,c)}
Figure 5-1 presents an example where the resolved edge has 1 × 1 × 170 × 818 × 818 = 113,751,080 tuples, or cells, to process.
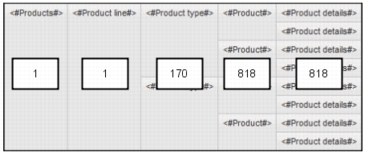
Figure 5-1 A crosstab containing five nested sets
The Cognos BI query service applies optimizations for suppression. For example, if a cell's expression evaluates to null, it does not have to be computed during query evaluation, which reduces the number of cells that need to be processed.
Avoid requesting large, sparse result sets to prevent long wait times while suppression is being applied. This will happen naturally if you work only with one meaningful view of your data at a time. The preferred approach to analysis is to remove any data that is not pertinent to your review before taking any step that expands the amount of data returned.
If you know which members will have the data of interest, explicitly reference or keep only those members in your report, particularly when a large majority of cells will be null otherwise. Likewise, if you are interested in only a slice of the data that involves hierarchies that do not need to be displayed in the report, add appropriate members to the Context filter or Slicer areas of the authoring interface.
To avoid the lengthy processing times required for large, sparse result sets, use a TopCount() function for dimensional reports or a rank() function for relational reports to show only the top values of interest.
Another method for suppressing null cells in reports is the use of filters to ensure that calculations take suppression into account. You can achieve better report performance because the filtering is done by the data source. For example, insert a set expression in your crosstab and use the following expression:
filter (descendants ([Set]) is not null)
If your crosstab includes three or more levels within the same dimension on an edge, use the following expression:
filter (descendants (currentMember([Hierarchy]) is not null).
If your crosstab includes nested sets, you can improve performance by filtering the sets using a cascading approach. For example, first filter the outermost (or highest nested level) set and then proceed inward to filter the remaining sets.
5.6 Dimensional summaries
You summarize data in reports to obtain totals, averages, and so on. All authoring interfaces of Cognos BI offer toolbar buttons to generate summaries.
Users analyzing OLAP data sources such as IBM Cognos Dynamic Cubes, IBM Cognos TM1, Microsoft Analysis Services, or Oracle Essbase typically want to see summaries of their detailed data. However, when applied to large volumes of data, summaries can be expensive to compute, and in extreme cases can slow response time to the point of becoming unusable. This is particularly true when the data is sparse and suppression is applied.
This section describes techniques to avoid performance problems from dimensional summaries.
Remove the summaries
The simplest technique is to remove the summaries if they are not necessary for analytical needs of users, or if shorter user wait times are more important than the availability of summary values.
Use parent members
In most dimensions, every non-leaf member is the rollup (the natural summary) of its children. In most cases, referencing a parent member can perform better than requesting a summary of that parent member’s child members. If you reference the parent member in your reports, the value can come directly from the data source, but if you define a summary the value must be computed at run time. OLAP data sources typically optimize the rollups in each member for better performance, and in some cases store the pre-aggregated rollups of all non-leaf members.
Summaries are calculated at run time to ensure that the summary is correct even when the members that are displayed do not roll up into an accessible parent member. Avoiding such summaries in favor of using the desired parent member avoids the associated runtime performance costs.
You cannot use this technique if you need a summary set of members that is not a complete set of children, for example a TopCount() set. In such scenarios, the summaries must be computed on demand.
Use automatic summaries
When using the Summary toolbar buttons, requesting an automatic summary instead of an explicit summary (such as Total) allows the summaries, when possible, to be delegated to and optimized by the data source system, resulting in better performance. This optimization is especially useful when detail summaries are required, such as in a list report.
When using the expression editor, the function that computes automatic summaries is Aggregate().
You cannot use this technique if you need a summary set of members that is not a complete set of children, for example a TopCount() set. In such scenarios, the summaries must be computed on demand.
5.7 Advanced features in Report Studio’s Query Explorer
Report Studio offers advanced reporting functionality that is not available in the other authoring interfaces of Cognos BI, such as the ability to create and modify queries using Query Explorer. Query Explorer provides an alternative way to modify existing reports or to author new reports. To enter Query Explorer while in Report Studio, place your mouse pointer over the Query Explorer button and then click Queries.
You can use Query Explorer for complex tasks and other actions that are difficult to do when in the regular report layout. Query Explorer can do the following functions, among others:
•Improve performance by changing the order in which items are queried from the database.
•Incorporate SQL statements that come from other reports or reports that you write.
•Create complex queries using union operations and joins.
This section provides details about the most useful Query Explorer features.
5.7.1 Reference queries
Use reference queries to control the order in which items are queried from the underlying data sources. This can help you to improve performance or generate complex computations in an order that is tailored to your needs.
To produce reference queries in Query Explorer, create the link between the child query and the parent query by dragging the parent query to a position on the right side of the child query. Figure 5-2 on page 65 presents two reference queries. In the first query, Query1 is the parent query and Query2 is the child query. In the second query, Query1 is the parent query and Query3 is the child query.

Figure 5-2 Two reference queries
With reference queries, you can ensure that a series of calculations and filters are applied in the order you want, because the parent query is always processed before the child query.
Reference queries also help you control caching and avoid fetching more data from the database, because child queries are processed from the cached data of parent queries (except when caching has been disabled). Using the example presented in Figure 5-2, with default settings, the query from Query1 will be submitted only one time, and Query2 and Query3 will be based on the cached result set from Query1.
When you create a child query in Report Studio, you can reference items only from its parent or from other queries. For example, if you add a filter to a child query, the only items that you can insert into the expression are items that exist in other queries defined in the report.
5.7.2 Union, intersect, and except queries
Create a union query to combine two or more queries into one result set. You can combine queries that use different data sources. For example, you can combine a query that returns data from a dimensional data source with a query that returns data from a relational data source.
An intersect query takes the results of two queries and returns only the rows that appear in both result sets. An except query evaluates the result set of one query and returns the rows that do not appear in a second query's result set.
In some scenarios, the union, intersect, and except operations can be delegated to the underlying data source. More typically, however, these types of set queries must be computed through local processing and therefore carry a cost in terms of performance. So, avoid these operations when requirements can be satisfied without them.
|
Note: For more information about union queries, see the following topic in the product information center:
|
5.7.3 Join relationships
A join relationship joins two queries. To avoid the performance cost of local processing, join relationships are typically created in the IBM Cognos Framework Manager model. But if your requirement cannot be modeled in Framework Manager, you have the option to create the necessary join relationship in IBM Cognos Report Studio.
One reason to define a join relationship in Report Studio is so you can initiate the join on the aggregated values of either or both of the associated queries instead of on the corresponding detail records.
|
Note: For more information about join relationships, see the following topic in the product information center:
|
5.7.4 Master detail relationships
A master detail relationship helps you deliver information that would otherwise require two or more reports. For example, you can combine a list with a chart. The list can contain product lines and the chart can show details for each product line.
Master detail relationships must appear in nested frames to produce the correct results. You can create a master detail relationship in two ways:
•Use a parent frame for the master query and a nested frame for the detail query.
•Associate a report page with the master query and use a data container, such as a list or crosstab, for the detail query.
You can use a master detail relationship to show data from separate data sources in a single report. However, the data sources must be contained in the same package.
For dimensional queries, master detail reports with a crosstab report object are optimized to use a single query whenever possible, rather than using a separate query for each report object instance. To reduce the required number of queries to the data source and therefore reduce execution time, the optimization combines the master query with the detail query in a crosstab. The data that appear in each detail report are now a subset of the result returned by the new combined query, instead of the result of a separate query with a detail filter to select the current value from the master.
For relational queries, the master detail relationship definition is used by default to filter the detail query for every record in the master query, resulting in multiple detail queries being issued to the underlying database. As the master query record set increases, the number of detail queries increases also, slowing overall report performance. As of Cognos BI version 10.2.1, there is a governor in Framework Manager called (DQM) Master-detail optimization. Use this governor to control whether detail query caching occurs for a relational master detail query. To minimize the amount of SQL execution against the database for detail queries, cache the detail query. For example, if you have 1,000 detail queries, then only one SQL execution will occur. By default, detail queries are not cached, so for 1,000 detail queries, 1,000 SQL executions occur.
|
Note: For more information about master detail relationships, see the following product information center page:
|
..................Content has been hidden....................
You can't read the all page of ebook, please click here login for view all page.