
Financial plans and the risks we take
Any financial planner worth his or her salt will tell you that the amount of money that you have to spend in retirement will depend mainly on the amount of money you start with, how much you contribute to your savings, the rate of return on your assets, and the taxes you pay.
But let’s get concrete. As an example, suppose we wanted to find out how much we have to put aside each year to live comfortably in retirement. I will cover the opportunities and issues with pension plans and insurance-related savings products like annuities later, but for now assume you are saving up and have the luxury of ignoring tax.
Building your savings
Suppose you are 30 years old and have savings of £10,000 after finally paying off your student loan. Let’s say you expect to work until you are 67, and plan to be able to put aside £12,000 a year in today’s money (so real numbers) for your retirement. To be comfortable in retirement you think you’ll need £20,000 a year in today’s money (inflation will make the future number bigger but be equivalent to £20,000 of purchasing power today) on top of other pensions (e.g. the state pension) you have and you expect to live to 90.
You have decided that the way forward is to put half your savings into the minimal risk asset and the other half into world equities. To ensure that the ratio between the minimal risk asset and equities does not get too out of kilter you plan to rebalance the portfolio every year to ensure that the split is 50/50 at the start of the year. The plan is then to move everything (i.e. 100% of your portfolio) to minimal risk assets when you are 67 and will start needing the money.
You may expect to make 0.5% on the minimal risk asset and 5% on the equities (0.5% + 4.5% equity risk premium) before minor fees. While the risk of the equity return has more frequent extreme outcomes than suggested by standard statistics – called fat tails – the annual standard deviation (SD) of that equity return is probably in the range of 20%. Taking into account these fat tails we increase our standard deviation assumption to 25% (a huge simplification).
To get an idea of the probabilities of having enough money in retirement here is a relatively simple excel model. The inputs are summarised as follows:

You expect to live to age 90 and wish to withdraw £20,000 in today’s money each year after you turn 67, so you will be withdrawing a total of £460,000 for your 23 years of retirement spending. Taking into account that you will make 0.5% on your investment in the minimal risk asset even in retirement you ‘only’ need approximately £434,000 in assets when you turn 67 to have enough money. This is of course excluding the fact that you probably want to have a buffer of additional money in case you live to be more than 90 (unlike an annuity, the buffer is not ‘lost’ when you die – it goes to your descendants).
So will you have enough? Well that depends on the volatility of the equity markets. The results are striking and highlight some important points.
I set up the model to re-run itself 1,000 times with the equity returns generated by a random function. Basically I told the computer to play this game 1,000 times where the return on average was 5% per year, but that this return should vary with a standard deviation of 25%. (Chapter 6 on risk discussed how this is approximately what risk has been in the past, and explained what that meant.) In roughly 68% of the cases the return on equities will be within a range of −20% to +30% (one standard deviation from the mean; average of 5% return and then add or subtract 25% depending whether it is a negative or positive 1 standard deviation move).
The 1,000 iterations of the model reveal greatly varying results. If equity markets are good between now and your retirement you will have far more money than you planned to spend. However, if equity markets between now and retirement are bad, the savings are far from enough to cover the future outgoings and you potentially have a serious problem. The results from the iterations are as follows:

The numbers above represent the outcomes of the 1,000 iterations and are based on the inputs above. The only thing that makes the outcomes vary so much is the impact of having the equity returns vary in risk by a standard deviation of 25% per year (this is more than the historical average, but increased because large negative returns happen more frequently than suggested by the standard deviation – big simplification).
The point I am trying to make is that the uncertainty of equity returns can lead to very large fluctuations in outcomes over a long time horizon and that you as an investor need to be aware of that and plan for it in your financial planning. Depending on how strong or weak equity markets are between now and retirement you might have less than half the money you need, or almost 10 times as much as you need. Those are pretty wild swings, brought about by decades of taking risk in the equity markets. I’m obviously not saying that you should rigidly stick to the strategy above, but the point remains that long-term financial planning can lead to a wide range of outcomes once you introduce risk into the portfolio.
Expected outcomes
If we are as lucky (or unlucky) as the average person we would expect to have the median amount of money, not the average. This has to do with the average versus compounded returns. Suppose two people over a two-year period had the following return profiles:

These people would have had the same average return. But when you compare the returns at the end of the two-year period the person with the least variation in her returns has the higher cumulative returns:

Simply put, this is the same scenario as in our example above. Because the returns vary greatly from year to year, the aggregate return at retirement will be lower with volatile returns than if we had been able to secure the average return every year.1 While beyond the scope of this book, this realisation that as an investor you will over time fare worse than the compounding of your average returns is a critical and often neglected part of finance. You can’t eat average returns – you eat compounding ones.2
So, in returning to our model where we ran 1,000 iterations, the outcome we should expect if we are exactly in the middle is the median, not the average. If this was 1,000 outcomes, then we should expect the 500th, or median outcome.
Figure 10.1 shows the amount of money in our investment account at the age of 67, and the percentage of iterations that fall within various bands.

Figure 10.1 Amount in investment account at age 67 and percentage of iterations falling within various bands
A couple of things are probably obvious about the graph:
- Most cases cluster around the median return, but there are also a few very positive outcomes where we end up millionaires.
- There are a high number of outcomes where we were unlucky and ended up with savings short of what we needed for retirement.
In my view, this second point is critical and goes to the heart of investment management and the risks we are willing to take with our financial lives.
As outlined above, we need to have accumulated approximately £434,000 by the time we are 67 in order to be able to withdraw £20,000 a year until we are 90. We also know that in the average (median) case we would have assets far in excess of that requirement. But now we also know that in a large number of cases our savings will fall short of that required:
| Cases above £434K: | 81.2% |
| Cases below £434K: | 18.8% |
So in nearly 19% of cases you will not have enough money for your retirement goals.
To most people a probability of approximately 20% that you will fail to meet your goals would cause great concern, particularly as you probably want some sort of additional reserve in case you live past 90. But what can you do about it?
As a rational investor, the worst thing you can do is to abandon your principles and pursue the promises of higher returns from various active managers or investment schemes. While you may get lucky, on average it would only make the situation worse.
In effect we have a few choices:
- We can contribute more annually.
- We can start with a higher amount.
- We can accept a lower annual amount in retirement.
- We can shift the mix between the minimal risk and equity to lower our risk, but at the expense of a lower expected asset base at the age of 67.
The super-cautious saver
If you are unwilling to take any risk that your savings fall short in retirement you could invest only in the minimal risk asset and your savings at age 67 would be £497,000, and far in excess of the £434,000 needed. By allocating some money to equities your expected savings would go up, and while that extra money would surely be nice to have it comes with a risk that there will not be enough. The greater proportion you allocated to equity, the more your median savings will be, but you will also increase the risk of falling short. The security of allocating entirely to the minimal risk asset comes at the expense of having significantly lower expected assets at 67 than if you had allocated some assets to equities – but that is a choice you have.3
If we had done the same exercise and found that our retirement savings fall short when investing only in the minimal risk asset we would have been faced with some tough choices. The way you respond to this shortfall relates to your personal attitudes towards risk:
- You could contribute more to your portfolio on an ongoing basis if you are fortunate enough to be able to do so, or find a way to have a larger initial amount.
- If you are very risk averse you may not be willing to accept any risk with your retirement funds and simply accept a lower annual retirement pot.
- If you increase the equity allocation, the additional expected returns from equities will increase the chance that you have enough money for retirement. But while you increase the chance of achieving the target savings and on average will have more money in retirement, you do so at the expense of potentially incurring a greater shortfall in the cases where future equity markets are bad.
Risk/return
We can use the example above to get a sense of the price we pay for the surety of having enough money at retirement.
In the 50% minimal risk/50% equity case we would expect to have approximately £653,000, while the minimal risk only portfolio would give us £497,000. A difference of over £150,000 to use in our retirement! And the cost of that expected additional amount? Accepting that there is roughly an 18% risk that you will not have enough money to take out £20,000 a year in retirement.
The decision whether those additional expected assets is worth the risk of a shortfall in retirement often depends on personal circumstances. What will be the impact on your life of falling short of assets in retirement? Will this be catastrophic or just a mild annoyance? Hard to tell. Similarly, what will be the impact on your life of having significant excess funds? Will it make you happier? Does it mean that you can afford a better life for your children than you had yourself? Or perhaps you can leave them with a nest-egg that you could not otherwise afford.
Below are the results of running the iterations with various fractions of the assets invested in the minimal risk asset:
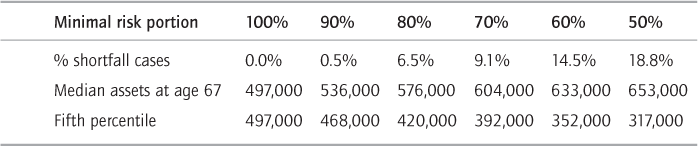
The bottom line of the table illustrates the amount of assets we are left with in the fifth per cent worst outcome, or every twentieth case. It is no surprise that the fifth percentile number gets worse as we increase the equity portion. With the higher expected returns from equities come the higher risk and the 5% worse cases therefore get progressively worse as we increase the equity allocation.
An unfortunate soul caught out by the drop
It’s 2007 and my friend had liquid savings of $500,000. She had decided that to live comfortably in retirement and to pay for the remaining years of her child’s education, she needed $425,000. She was a couple of years from retirement so the potential to add to savings from her current job was limited. Because of what might be perceived as the attractive risk/return profile of the stock market she had half her money in an equity index fund abroad and the other half in government bonds. Given the low expected risk of the market at the time it seemed like a sensible and conservative allocation – also, while she needed $425,000 she could find a good use for any extra!
Now it’s March 2009 and my friend is panicking. Her savings are down to $375,000 as she has lost about half on her equities, while the bonds are roughly flat. But not only has she lost 25% of her assets, her adviser tells her that now equities are super risky and that she could easily lose more.
Should she cut her losses and adjust her life choices to a lower quality of life, stay the course and consider this a large bump in the road? Or perhaps even double down and shift some assets from government bonds into equities, in order to recoup the losses?
A lot of people found themselves in some version of this scenario at the peak of the panic.
Generalising the examples
Like any financial model this is the case of rubbish in, rubbish out. Models are only as good as the assumptions you put into them. The model above is based on some pretty generic assumptions about risk and return, and only incorporates the minimal risk asset and equities. You might disagree with those assumptions and be more aggressive about your return expectations or risk. You may want to run the model assuming 0% real return from your minimal risk asset in line with the current market, or introduce some risk to the return of the minimal risk asset.4 Or you could move away from having a 50/50 allocation to minimal risk assets/equities in the portfolio, depending on your risk tolerances.
Instead of continuing to adapt a financial planning example that may not be entirely relevant to your financial planning needs, I would encourage you to do this kind of financial analysis yourself or to get someone to help you with it. You can do financial modelling in Excel, in Google Drive or use one of the many financial software packages available. In any case, make sure you spend enough time figuring out how everything fits together, and confirm that the model fits your specific needs.
It could be that you want to get an overview of what $100,000 invested in equities would get you in 10 years’ time with the same assumptions on risks and returns (see Figure 10.2). Or it could be that you want to figure out the probability that the money you have put aside for your children’s education will suffice. You might be an insurance company or pension fund that wants to find the probability of having enough funds to meet your future liabilities. The list is endless.
In any case, building a financial model that considers the range of potential outcomes will probably spark your thinking about the impact that the various outcomes will have. Take the model and amend it to roughly suit your situation. Then start playing with the inputs, assumptions and allocations:
- Have you been too conservative/taken too much risk?
- Could you bear bad equity markets in the decades ahead – what if they are riskier?
- How much is your situation likely to change in future? How will that impact on your risk profile?
- Is it possible that your financial goals are incompatible with the risk you are comfortable taking?
- What is the lowest 5% of outcomes? Lowest 2%? Could you handle it? Would you be willing to accept that you could fall short in one out of 20 cases? One out of 50? Never?
- Do you have a ‘drop dead’ level of assets that you simply are not willing to fall below? How does that dictate your allocations?
- As ‘touchy-feely’ as it sounds, try to feel what would happen in various cases. What does your gut tell you? How would it affect how you sleep at night? Your career? Your marriage?

- If we experienced decades of bad equity markets it would probably be because of terrible economic conditions (world equity exposure diversifies away local risk and may do OK even if your domestic economy doesn’t – a good reason to not own your domestic equity market as your equity exposure). Would your company pension, government safety net, annuities, minimal risk asset, etc. maintain value in that scenario?
Investing time in understanding the risks of your portfolio or financial goals is a worthwhile undertaking whether through a model like this or any other means. Even in the scenario when you don’t change your thinking or portfolio as a result, the increased understanding will probably lower the emotional strain of adverse events. You have an idea of what might happen and what the consequences could be for you.
A few important points to remember when using a model like the one above:
- The model is very simple and built with some very basic assumptions, but be cautious about those that add lots of products with high returns and low correlations. This will enable people to come up with much better risk/return outcomes, but as rational investors we do not think it can be done (indeed rubbish in, rubbish out).
- The model does not incorporate corporate bonds and government bonds that could be a worthwhile addition to the simple rational portfolio. This is a simplification. Incorporating those two asset classes would involve estimating correlations between them and equities, which is a science in itself (and a constantly moving number). Besides, adding other government and corporate bonds is not a magic bullet for the portfolio; while those asset classes are good diversifying additions to the portfolio they are not without risk. There is a brief discussion of this in the Appendix if you are interested.
- The model is very sensitive to the inputs, particularly on risk, and does not account for some of the issues with using standard deviation to gauge risk that was discussed earlier (in Chapter 6). Changing the inputs would make a massive difference to the range of outputs. If you do change the inputs, make sure you understand why – don’t make ‘nicer’ assumptions just because you like the results better. The expected real return on equities will not be 10% a year just because you put it in a spreadsheet.
- Keep in mind that all the returns are real returns. So the model is in today’s money. Clearly the actual numbers decades from now will look very different because of inflation.
Keeping it real
If we have got to the point where we have built a financial model that reflects our situation and implemented our investment plan by purchasing the right products (see Chapter 12 on products and implementation) we are doing really well. Unfortunately that is not the end of it.
We have to keep an eye on our portfolio and financial model and adapt it to changing circumstances and, if nothing else, then the passage of time. Imagine a scenario where the market has moved up 50% in a year. As we look at our financial planning we would be remiss if we didn’t somehow take our new and improved financial situation into account in our forward planning. It could be that with our higher asset base we are able to reach long-term financial goals with a far lower risk.
When we periodically look at our portfolio in the context of our overall financial health it may also be that our personal circumstances have changed, which in turn could affect our financial plans – we were promoted, fired, received an inheritance, got divorced, the uninsured car was stolen, our tax circumstances changed, etc. It all matters. How often we do this kind of review is a personal decision, but at minimum you should aim for yearly or whenever there has been great turbulence in the financial markets or your personal life. Since you should rebalance the portfolio periodically anyway that would be a good time to review its composition. I’ll come back to rebalancing later.
Reacting to disaster
In the aftermath of the 2008–09 financial crisis many investors were understandably left aghast. Many had lost far more money in their portfolios than they thought possible, and often did so as their house and other assets also plummeted in value. The gut reaction for many investors was to sell their equity exposure at or near the bottom of the markets, only to miss out on the great rally that followed. ‘A familiar story of retail investors abandoning their plans’, some financial planners lamented.
I don’t think things are that simple. During crashes like 2008 there is a natural tendency for everyone to have a view on the markets. The markets will dominate the headlines and be a topic of conversation at work, the gym, meals out, in homes and everywhere else. How can you not have a view?
The point is that we still don’t have a view. While many people with the benefit of hindsight say they saw the rebound, ‘just’ because there is great market turbulence does not mean that an investor is better able to predict market movements. We don’t consider ourselves smarter than the market, and the market put the S&P 500 at an index value of under 700 in March 2009. The fact that eight years later we see that same index trading around its all-time highs does not mean that we could predict in March 2009 that this would be the case.
When you look back at the 2008–09 crises or any crises preceding it, many people have a sense that there is a bottom somewhere, and great profits to be made for investors who find the bottom. And clearly that has often been the case. If you had stayed the course or invested more at exactly the right point in March 2009 (or July 1932) you would have made a lot of money. But you obviously did not know that then. For all you knew at the time, March 2009 was just a precursor to a really bad decline in the market, and you were scared to death. There is no guarantee that markets bounce back after a decline. Just ask investors who bought Russian equities in 1917 …
But that does not mean that there is nothing you can do. First of all, after bad declines in the market it is likely that the future riskiness of the market has gone up a lot in the general turmoil. While that does not give market direction at least you can prepare yourself for the increased risk. Those willing to bear the extra risk will probably see commensurate higher expected returns, but they have to be willing to accept that a lot of money could also be lost.
We know that losses like those in 2008–09 do happen with some frequency and it is at times like these that you hope to benefit from having had a conservative allocation policy, instead of selling your holdings in desperation.
In any case there are no easy fixes and we are faced with a few unpleasant alternatives:
- We can find a way to put more money aside in savings.
- We can accept a lower amount in retirement or the same amount for a shorter time period.
- We can reallocate between the minimal risk asset and equities if the large decreases have affected the risk we are willing to take with our portfolio.
Though it sounds like annoying hindsight, investment allocations are about ensuring that you don’t find yourself in the position of making panic sales to start with. Have enough of a buffer so that you avoid selling equities at what might be the bottom of the markets. Over the long run, equity markets are likely to far exceed government bond returns, but they will also be far more volatile and periodically lose you a lot. Make sure your allocations allow for that.
Liquidity and the rational portfolio
Perhaps one of the most underappreciated advantages of the rational portfolio is its excellent liquidity. The rational portfolio will outperform most actively managed portfolios in the long run, while being tax efficient and tailored to our individual risk profile. But it is also hugely advantageous from a liquidity perspective.
Liquidity is one of those things you mainly hear about in a negative context because things went wrong and there wasn’t enough of it. The rational portfolio is also affected by liquidity issues in the market; times of decreasing liquidity are typically synonymous with declining markets. And the rational portfolio with some risky equity exposure will probably lose money in declining markets, like most other portfolios with risky assets. But compared to most portfolios the world equity portfolio is among the most liquid of investments you can find. Let’s remind ourselves that among the companies in the index trackers are the largest traded companies in the largest economies of the world. As a result the portfolio consists of companies like Apple, Exxon, Vodafone, PetroChina, General Electric, Nestlé, Google, IBM, Royal Dutch Shell, Petrobras, etc. While you also have some indirect exposure to smaller companies in the broadest equity indices, the proportion of those stocks in the portfolio is far below what it would be in a portfolio of exclusively small- or medium-sized companies, and most other things. Similarly, the highest-rated government bond markets are typically incredibly liquid, so unless you have more money invested than Bill Gates you are very unlikely to experience liquidity issues from the minimal risk asset portion of the portfolio either.
The importance of having liquidity in your portfolio depends on your circumstances. One friend commented to me that liquidity is his number one requirement when considering new investments, while some endowments and foundations have predicted their capital needs decades into the future and are more relaxed about being able to sell their investments for cash within days or hours. Most investors are perhaps between the two extremes regarding liquidity requirements. Some investments that are meant to be held for the very long term, perhaps for retirement, but there is also a desire to have available liquidity for unexpected needs. There is a more detailed discussion about liquidity risk and how it rears its ugly head at the worst times in the Appendix (there is also a discussion of how you need to make sure you get paid for taking liquidity risk).
A few ways to think about portfolio allocations
Here are some suggestions:
- Drop dead allocation If you need £100 for heart surgery, don’t buy equities with your last £105. Have enough money in the minimal risk asset so that you certainly have enough in the short term, and only then start adding equities.
- Pick a return point and see if you can handle the risk You may expect 0.5% per year from the minimal risk asset and a premium to that of 4–5% from a broad equity index, both after inflation. You can pick the return point you are after, and then figure out the risk required to achieve your goals (see Figure 10.3).
A word of caution: if you borrow money to achieve higher returns than those from equities keep in mind that those loans tend to get recalled exactly at the worst time and lock in your losses. - Pick a risk point and see what returns you can expect How much risk you can handle is subject to your personality and individual circumstances. You can work out your worst 1%, 2%, 5%, 10%, etc. scenarios to see what various portfolios look like, and get an idea of the risk you are willing to take. Put this in the context of the consequences of failing to reach your financial goal and guide your allocations that way.
- Think about the flexibility of your financial goals As you consider your portfolio allocations it is worth keeping in mind what is implied by the end portfolio value you are trying to achieve. Does your goal suggest the minimum of financial survival or meeting a firm liability with its nasty potential consequences of failure? Or does your target really suggest more of a ‘nice to have’ lifestyle pot of assets? These considerations should play into the risk you take with the portfolio.
- Think about avoiding temptation Set your portfolio up so you have some flexibility in case the markets move unexpectedly. Reallocations are costly and retail investors are notorious for selling their equity holdings at the worst time. Generally avoid trading in and out of things excessively – it’s costly and will significantly reduce long-term returns.
- Use market experience Think about how you react to losing money as the markets inevitably drop on occasion. If you can’t sleep at night for worry about the future or sell after the decline then your equity allocation is probably too high. On the other hand, if you think ‘that’s nothing’ and want to add more equities then you were probably too risk averse in your allocations. Sometimes it can be hard to know exactly how you will feel until the moment happens, and it can be hard to predict how other parts of your life would be affected by a drop in the markets.
- Impact of non-financial assets and liabilities As you think about the risk in your investment portfolio, consider how other assets and liabilities are affected by the same factors. Make sure that not too many bad things can happen to you at once, both from a value and liquidity perspective. Should the world equity markets experience a calamity, it is possible that the value of your house, job (an equity broker will be affected more than a civil servant, etc.), and other assets all decline at the same time. Those things are not as liquid as the rational portfolio. Be sure to avoid a distress sale of your only liquid asset (the rational portfolio) in bad markets by minimising illiquid assets that all drop in value at the same time. Meanwhile, your liabilities are often more fixed (like mortgage, cost of living, school fees, etc.).
It is often a great idea to put your portfolio objectives and risk tolerances into words in a simple ‘portfolio mission statement’. Unless you are so inclined, the statement does not have to be accompanied by a picture of a soaring eagle, but be something for you to look at occasionally, and particularly as your circumstances change. It helps to think of why you are saving up or allocating between equity and bonds and the maturity profile of those bonds. It could also be helpful for you to put into words how you would react and feel about bad things happening in your portfolio. If nothing else, this forces you to think about how you would react to various scenarios and potentially restructure your portfolio as a consequence of something not sitting right with you.

Stages of life
Your age will be a big factor in how you allocate your portfolio.
Early savers
It is generally the case that younger savers allocate a greater portion of their portfolio to riskier assets. They are in the early stages of saving and the cumulative benefits of even a small expected outperformance from a slightly riskier asset can add up to a large amount over the coming decades. Also, should markets be bad early on, savers have decades before they need the money and more time either for the investments to make up the shortfall, or for them to adapt their lifestyles or savings rate. My advice to you: take risk with your savings and put lots in the equity markets, be ready to lose a lot of it, but also keep enough in the bank so that you can afford a crisis. It’s a good time to learn about the markets and how you deal with the risks. You should also familiarise yourself with all the tax benefits that might arise from pensions or other savings (such as ISAs in the UK). Getting into the habit of saving up and maintaining the discipline to stick with it is something that will serve you very well, particularly as you begin to see the cumulative gains from being a saver.
Mid-life savers
Once you enter the late 30s and 40s you pass into the ranks of the mid-life savers. You might be at your prime in terms of earnings power and starting to get a good sense of how things will turn out careerwise. For many mid-life savers, tax considerations will play a major role in the execution of their portfolio, and many will want to allocate a greater fraction to the minimal risk asset, perhaps in longer-term bonds, than they did a decade or so earlier. While these savers have accumulated some savings, the potential added return from allocating to equities is still important in reaching their financial goals in retirement. And should the equity markets be bad in future there are still some working years to address the losses from those investments, either by saving up more and reducing current spending, expecting to work longer or reducing expected retirement spending. At this point in your life savings cycle you might start to get a sense of what your expenses in retirement will look like, and perhaps how many income-earning years you have left before retiring.
In terms of practically shifting your investments from equities into lower-risk assets as you age I would encourage you to do this as you either put money into your savings or take money out anyhow, as that reduces trading costs and potentially taxes.
Retirees
At the other end of the spectrum is someone already in retirement. Particularly those without a great amount of savings to see them through their remaining years typically have a far lower risk tolerance as there are fewer options to make up a shortfall if markets turn against them. At the risk of over-simplifying, if you don’t share the upside of having more savings (with limited years left to enjoy them), but would experience the painful downside, then don’t take risk and stay with minimal risk bonds. Of course estate planning and passing on assets to the next generation will play a major role here in terms of the exact structuring of your portfolio. Also think about what non-investment income you can expect in the form of company pensions, social security, etc. and compare that to your expected outgoings. The difference between the two will need to come from investment income, or liquidating part of your portfolio. While many rules of thumb don’t apply universally, if you stick to only spending 4% of your portfolio a year, you will probably be fine (you can increase that percentage as you grow older).
For those in retirement I would encourage you to get ready for the day when you can no longer handle your savings yourself, or even plan for eventually passing them on. Keep things simple; have only a couple of accounts and not too many investments, and make clear to whoever is going to take over the management of your assets how you want them managed and why.
For those retirees with savings in excess of what they need, the risk profile of the portfolio may be different. These retirees are no longer only investing for their own needs, but also for the longer-term needs of their descendants or whoever the assets will be going to. Since the time horizon for those descendants can be much longer term, the portfolio could well include some equities and a generally riskier profile than if it was just for the retirees.
It really does depend on your circumstances
Like most things in investing, allocations are highly subject to individual circumstances and risk tolerance. Figure 10.4 shows how an investor’s allocations may change over his or her life, ignoring the complication of risky government and corporate bonds in the rational portfolio.

Figure 10.4 Stages of life: moving from equities as you age
Risk surveys
As discussed above, getting a handle on your risk tolerances is not only critical in investment management, but also a very individual thing. In my view, far too often investors rely on their gut feelings in deciding on the risk levels in their portfolios, or are guilty of what some call ‘recency’ where we overemphasise recent events in planning for the future.
Risk surveys are increasingly common in the financial industry and are sometimes mandatory for companies taking on new clients. You find them at most banks, insurance companies, asset management firms or your local regulator. As suggested, they are meant to give you an idea about your risk tolerances, often via stress tests, but in my view risk surveys often leave a lot to be desired.
Risk surveys that I have completed are too simplistic to give a really detailed view of your risk profile, often because they don’t ask enough questions about your specific situation. Sometimes I find that the surveys are a prelude to someone trying to sell me a specific ‘tailor-made’ product (read: expensive), instead of objectively trying to help me understand my risk tolerance. In addition, risk surveys often fail to properly incorporate all my other assets and liabilities, including seemingly odd ones like education, inheritance, future tuition for children, or other critical things like what stage of life I’m at regarding career or retirement. The surveys therefore often fail to get a full picture of my financial life and in my view suffer in quality as a result.
With the caveats listed above, I would still encourage you to undergo a few risk surveys and to be on the lookout for new and improved surveys. Particularly if you are someone who is not used to thinking about your risk profile in the financial markets it probably makes sense to try a few surveys either through your financial institution, your domestic regulator or one of the many you can find on the internet. Who knows, they may tell you something you hadn’t thought about, or perhaps you will have added comfort from confirming what your gut feeling tells you – see Figure 10.5.
The understanding and integrated tailoring of risk profiles will be a future growth area in financial services. While a risk survey is only as good as the information you put into it, if there was a seamless way to integrate all major aspects of our life to provide a fuller risk picture then those results could be very helpful to individual investors. One day I imagine that risk surveys will be informed by an incredibly detailed profile of you based on your portfolio, annuities, insurance, credit card bill, LinkedIn/Facebook profile, where you holiday, your tax filings, how you drive your car, online games, if you tend to book flights last minute, the state of your marriage, and how you play golf, etc. While all that sounds distastefully intrusive I wouldn’t be surprised if some IT companies already know most of it.

A few rules of thumb
In researching this book I came across several publications on the topic of investment and savings which had rules of thumb that were pushed as gospel truths. While I think rules of thumb fail to incorporate individual circumstance and attitudes here are a few to consider:
- Your age in bonds (60-year-old = 60% in bonds).
- Don’t withdraw more than 4% of your portfolio a year in retirement.
- If you react badly to losing money in your portfolio, reduce the equity exposure by 10%. Keep doing that until you are OK with portfolio falls.
- Equity exposure = amount of years until retirement in percentage terms. So with 10 years to retirement your equity exposure should be 10%.
- Equity exposure = 120 − your age.
- Put aside 10% of income for retirement.
- The value of your house should be less than three times your annual income. (It was staggering to see how often and by how much this rule was broken particularly pre-crash.)
- Base your retirement needs on 100% of pre-retirement expenses plus 10%.
- Have at least 7–10 times your annual income in life insurance.
- Have at least 6–8 months of living expenses in cash in the bank.
Clearly these are exactly that, rules of thumb. Obviously these rules don’t apply to everyone, or indeed most people (and some are even slightly contradictory). Instead, in this chapter I’ve tried to give you a sense of how to think about your individual risk and how even sensibly laid plans can be impacted by an unpredictable market.
Do you need a financial adviser?
I’m cautious about this book sounding as if we could do away with the entire finance industry and do everything by ourselves. There is no doubt that in my perfect world the aggregate fees paid to the finance industry should only be a small fraction of the fees paid today. There are far too many people getting paid far too much for adding too little value. But this does not mean that we should not use financial advice at all. There are a few places where we need it: tax advice, advice on pensions, help with finding the best products when thinking about our specific circumstances regarding our rational portfolios. With very few exceptions, the financial advisers I have met have been honest, hard-working people with their clients’ interests at heart, and I fully understand the advantage of having someone like that in your corner. It’s nice to have someone to talk to when you are unsure of something or things have not gone to plan, in addition to the specific expertise mentioned above.
Getting a financial adviser may help you answer some of the questions posed above. Finding the right adviser is certainly not easy and obviously involves costs. Many advisers charge a fee of 1% of assets every year, which at least alleviates the concern that they are somehow making more out of you than the fixed fee and try to profit by selling you products you don’t need. Of course, if we are generally discussing investing methods that in aggregate should cost around 0.2–0.3% a year, the adviser fee seems disproportionally large, but depending on the size of your portfolio may not imply a high hourly rate. Also, if you are not after the kind of standardised advice you might find online there is probably a limit to how cheap you want to go. Bad advice will cost you a lot more than the fees. As a client of an adviser, what you are asking for with a rational portfolio is a lot simpler than many clients who want a tailor-made portfolio built from scratch. You are not asking the adviser to find you the best portfolio to put together. You now know all that: you are a rational investor.
____________________
1 On YouTube you can find a brief and instructive video called ‘Geometric vs. Arithmetic Average Returns’.
2 There are a surprisingly large number of books and articles that seem to neglect this issue. A typical example will be an illustration that talks about $1,000 invested making an average of 5% a year so that after 30 years you will have made $4,320, ignoring the fact that high volatility in the yearly returns could significantly reduce the final value.
3 If you wanted minimal risk you should buy inflation-adjusted government bonds with maturities similar to when you will start needing the money. In this case, that would involve some of the longest-dated bonds available, which typically carry a higher yield than the 0.5% used in this example.
4 As you increase the risk of the minimal risk asset the importance of introducing correlation with your equity investment increases. This is a complication I have left out.