Stock Price Dynamics
In this chapter, we learn how to construct and model stock price dynamics and then analyze the characteristics of options pricing models like Black-Scholes, whose behavior is derived from these models. Let's begin with a familiar discrete time model of single periodic growth in the asset's price St, using continuous compounding:
![]()
We established previously that μ is the growth rate in prices, or the return to the asset (see footnote 2 in Chapter 15). We will continue to adopt the convention that μ is the annualized return. This is a deterministic growth model having no stochastic element. Setting t =1 and taking logarithms on both sides solves for the single period return, ![]() . More generally, we express this relationship as follows:
. More generally, we express this relationship as follows:
![]()
This form allows us to model price dynamics over subintervals of the year equal to Δt. Now let's consider the possibility that in addition to the deterministic component, price changes also have a stochastic component in the form of a random shock ε over the interval Δt, that is:
![]()
The shock ε acts like a volatility parameter and that is why it is accompanied by the square root of Δt, which makes its variance σ2Δt. With no loss of generality, assume zero growth (μ = 0) for now and concentrate on the stochastic innovation to prices. Taking logarithms,
![]()
If, for example, Δt = 1, then log prices change by a random shock equal to ε. If we assume that ε is a draw from a standard normal distribution, N(0,1), then Δz is a discrete time Wiener process. This says that price changes are purely random. We have, by definition, the properties:
![]()
![]()
In the limit, as Δt → 0, Δt becomes the continuous time derivative ![]() , and likewise Δz →
, and likewise Δz → ![]() , which is a continuous time Wiener process.
, which is a continuous time Wiener process.
In discrete time, setting Δt = 1 results in a random walk process. What is a random walk? For ![]() , setting Δt = 1 results in Δz = ε, which is a white noise process. Now, by definition,
, setting Δt = 1 results in Δz = ε, which is a white noise process. Now, by definition, ![]() Therefore,
Therefore, ![]() . This is a random walk in discrete time. What it means is that changes in z are independent, normally distributed, mean zero, random variables with unit variance. Therefore, log changes in stock prices—and therefore, stock returns—are unpredictable in this model of stock price dynamics. If μ is nonzero, then returns have an expectation, or mean component, but movements around this mean are unpredictable.
. This is a random walk in discrete time. What it means is that changes in z are independent, normally distributed, mean zero, random variables with unit variance. Therefore, log changes in stock prices—and therefore, stock returns—are unpredictable in this model of stock price dynamics. If μ is nonzero, then returns have an expectation, or mean component, but movements around this mean are unpredictable.
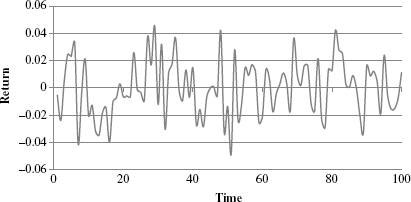
Figure 17.1 shows one such discrete representation for a hypothetical daily price change in which values for ε are drawn from a standard normal distribution. This particular example is also a white noise process since μ = 0 and σ = 1. See the chapter examples spreadsheet for details.
Figure 17.1 Wiener Process
We can generalize the Wiener process to include the mean return μ, which we refer to as a drift component (it's now a random walk with drift). If, for example, ΔS is a discrete time Wiener process with drift, we would model this as follows (where α and β are parameters to the process):
![]()
Taking logs and letting Δt → 0 means that ![]() dS/S and therefore:
dS/S and therefore:
![]()
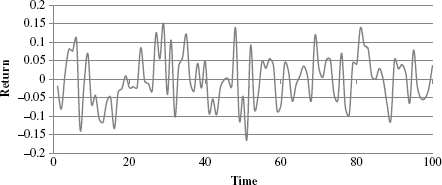
Specifically, setting α = μ and β = σ results in a model of stock price dynamics. Figure 17.2 is a discrete time model of this process for a daily stock price with drift μ = 0.12 per year, and that starts at S0 = $15 with annual volatility (σ) equal to 20 percent. Note that β is a parameter in this process, denoting volatility and not the CAPM β, which is a covariance with the market return divided by the variance of the market return. Note that we set Δt = 1/250 in this example to simulate daily movements. The simulations behind these examples are provided in the chapter spreadsheet under the Wiener and Generalized tabs.
Figure 17.2 Stock Price Dynamic
By definition, we can extend this concept to model continuous returns expressed as dS/S. It is intuitively appealing to model relative changes in price; thus we could examine the generalized Wiener process:
![]()
Equivalently,
![]()
This is geometric Brownian motion. To digress a bit, consider the nonstochastic part of the process ![]() . Integrating this over time
. Integrating this over time ![]() yields:
yields:
![]()
We establish, therefore, this chapter's first model, ![]() , which describes the deterministic growth in the stock price over time. The addition of the stochastic component
, which describes the deterministic growth in the stock price over time. The addition of the stochastic component ![]() describes how shocks, in the form of ε, contribute to the growth process through time.
describes how shocks, in the form of ε, contribute to the growth process through time.
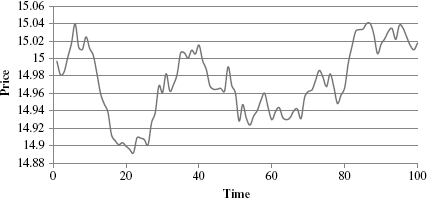
Figure 17.3 illustrates the case for 100 daily Brownian motion stock returns with an annual drift equal to 15 percent and volatility 20 percent.
Figure 17.3 Brownian Motion