Chapter 7. Light
Because color is reflected light, sensors can detect the color of a surface. With some creatively applied tubing, the direction of light can be detected, too. And if fire is the thing for your bot, there is a sensor for flame.
Do you want to measure human movement with infrared (IR) light? See Experiment: Burglar Alarm! (Passive Infrared Sensor). Need to know if an object is nearer than a given distance, using IR? See Experiment: Detect Obstacles With Infrared (IR Distance Sensor).
Experiment: Detecting Flame (Flame Sensor)
Flames emit a range of infrared light not very common in ambient light. The KY-026 flame sensor reports the level of infrared light with a change of resistance (Figure 7-1).
The code you’ll write for flame detection is the same code you’d use for an analog resistance sensor: you use analogRead() to read the voltage of a pin.
The KY-026 flame sensor provides two ways to measure flame: digitalRead() and analogRead(). Even though the code in this experiment implements both, you can just use whichever one you need in your own code.
Using digital mode only is especially convenient with Raspberry Pi, because Raspberry Pi doesn’t have an analog-to-digital converter.


Flame Sensor Code and Connection for Arduino
Figure 7-3 shows the wiring diagram for the flame sensor with Arduino. Wire it up as shown, and then run the sketch shown in Example 7-1.

// ky_026_flame.ino - report level IR light from flame to serial// (c) BotBook.com - Karvinen, Karvinen, ValtokariconstintanalogPin=A0;constintdigitalPin=8;constintledPin=13;voidsetup(){Serial.begin(115200);pinMode(digitalPin,INPUT);pinMode(ledPin,OUTPUT);}voidloop(){intthreshold=-1;// HIGH or LOWintvalue=-1;// 0..1023value=analogRead(analogPin);//threshold=digitalRead(digitalPin);//Serial.("Raw:");Serial.(value);Serial.("Over threshold:");Serial.println(threshold);delay(10);if(threshold==HIGH){//digitalWrite(ledPin,HIGH);}else{digitalWrite(ledPin,LOW);}}

Get the raw voltage reading from A0. It is an integer from 0 (0 V) to 1023 (+5 V).

Read the voltage of D8: LOW (0 V) or HIGH (+5 V).

Turn on the built-in LED (D13) if you’ve detected a flame.
Flame Sensor Code and Connection for Raspberry Pi
Figure 7-4 shows the circuit for connecting the sensor to a Raspberry Pi. Wire it up and run the program shown in Example 7-2.

# ky_026_flame.py - report presence of IR light from flame to serial# (c) BotBook.com - Karvinen, Karvinen, Valtokariimporttimeimportbotbook_gpioasgpio#defmain():triggerPin=25gpio.mode(triggerPin,"in")#flame=gpio.read(triggerPin)#if(flame==gpio.HIGH):#"Flame detected"else:"No flame detected"time.sleep(0.5)if__name__=="__main__":main()
-
Make sure there’s a copy of the botbook_gpio.py library in the same directory as this program. You can download this library along with all the example code from http://botbook.com. See GPIO Without Root for information on configuring your Raspberry Pi for GPIO access.
-
Pin is set to in mode to read its voltage in the next line of code.
-
Read the status of pin 23. The value is True for HIGH (+3.3 V) and False for LOW (0 V).

Note that a Boolean (true or false) value can be used in an
ifwithout a comparison operator. That is, you can sayif(b)instead ofif(b==True).
Environment Experiment: Flame Precision
The flame sensor’s built-in sensitivity resistor is very useful. It is especially important to adjust it so that ambient light won’t trigger the sensor constantly. It can also be used to set the flame sensor to react to very specific level of flame.

First, put an extra LED between GND and pin 13 (see Figure 7-6). It’s easier to see a full-sized LED than the onboard LED, so you’ll be more likely to notice when the sensor is activated. Upload the flame sensor code (Example 7-1) to your Arduino. Turn the potentiometer all the way right, then turn it left until the LED goes out. It’s probably a good idea to close the curtains, as strong sunlight can overpower other light sources.

Now, light a match. The LED should light again. Try adjusting the sensitivity potentiometer so that the sensor will react only to a full-size flame. Don’t get distracted watching the LED, or you might burn your fingers as the match burns down!
Experiment: See the Light (Photoresistor, LDR)
A light-dependent resistor (LDR) changes its resistance according to the level of visible light. Its resistance is lower in bright light. LDR is also known as a photoresistor (see Figure 7-7).
Photoresistors can turn on the lights when it’s dark, detect if a dark box is opened in a lit room, and help create robots that love light. With some creative use of heat shrink tubing, an LDR can also detect the direction of light. When testing, you can simply put your finger on an LDR to make darkness fall. If you want bright light, you can point a flashlight at the LDR.
To test a light-seeking robot in your lab, try covering it with a blanket (see Figure 7-8). This way, you don’t have to shut down the lights in the lab or run between your lab and a dark room.

LDR Code and Connection for Arduino
A photoresistor is just a two-legged variable resistor. With Arduino, it’s just a matter of configuring the sensor with another resistor as a voltage divider (see Experiment: Potentiometer (Variable Resistor, Pot)), then using analogRead(). In this way, a photoresistor is similar to many other analog resistance sensors.
Wire up the LDR as shown in Figure 7-9, and then run the sketch shown in Example 7-3.

// ldr_light_sensor.ino - report high level of light with built-in LED// (c) BotBook.com - Karvinen, Karvinen, ValtokariconstintlightPin=A0;constintledPin=13;intlightLevel=-1;voidsetup(){Serial.begin(115200);pinMode(ledPin,OUTPUT);}voidloop(){lightLevel=analogRead(lightPin);//Serial.println(lightLevel);if(lightLevel<400){//digitalWrite(ledPin,HIGH);}else{digitalWrite(ledPin,LOW);}delay(10);}
-
To measure the voltage at A0, just use
analogRead().-
If printing the value to serial is not enough, you can also light an LED when the level of light exceeds an experimentally chosen value.
LDR Code and Connection for Raspberry Pi
Connect the components as shown in Figure 7-10, and then run the code shown in Example 7-4.

# ldr.py - sense light level and print to screen# (c) BotBook.com - Karvinen, Karvinen, Valtokariimporttimeimportbotbook_mcp3002asmcpdefmain():whileTrue:lightLevel=mcp.readAnalog()("Current light level is%i"%lightLevel)time.sleep(0.5)if__name__=="__main__":main()
The library botbook_mcp3002.py must be in the same directory as this program. You must also install the spidev library, which is imported by botbook_mcp3002. See comments in the beginning of botbook_mcp3002/botbook_mcp3002.py or Installing SpiDev.
Environment Experiment: One Direction
Would you like to know the direction that light is coming from, rather than just how bright it is? A naked photoresistor reacts to light coming from around it so you can’t use it, for example, to turn a robot toward the light source. There’s a very easy solution for this. Take a piece of heat-shrink tubing and make a hood for the sensor, as shown in Figure 7-11. This prevents it from uncontrollably seeing light from every direction. You can use a material other than heat-shrink tubing as long as it blocks light coming in from the side (see Figure 7-12).


When you have many photoresistors, it’s a good idea to put all three wires and the resistor inside heat shrink tubing, as shown in Figure 7-13.

Experiment: Follow the Line
Line following is an easy way to move a robot along a predefined path. The most common use is creating “rails” with black tape. We have used line avoidance to keep our mind (EEG) controlled robot inside its playground. Figure 7-14 shows a line detector.

Line detectors light the surface below with light, usually infrared. The surface is considered “white” if enough light is reflected back; anything else is considered a line. To know if your bot is going off the line from left or right, you can use two or three line detectors side by side (for example, if the center detector sees a line, but the other two see white, you know you’re following the line). There are ready-made line detection sensors available that combine multiple sensors into one.
Line Sensor Code and Connection for Arduino
Because you are using a line detector with three leads here, no pull-up resistor is needed. One lead is for positive, another for signal, and the third for ground. The circuitry on the board includes any resistors or other components needed.
Wire up the circuit as shown in Figure 7-15, and run the sketch shown in Example 7-5.

// line_sensor.ino - print to serial if we are on a line// (c) BotBook.com - Karvinen, Karvinen, ValtokariconstintsensorPin=2;constintledPin=13;intlineFound=-1;voidsetup(){Serial.begin(115200);pinMode(sensorPin,INPUT);pinMode(ledPin,OUTPUT);}voidloop(){lineFound=digitalRead(sensorPin);//if(lineFound==HIGH){Serial.println("Sensor is on the line");digitalWrite(ledPin,HIGH);}else{Serial.println("Sensor is off the line");digitalWrite(ledPin,LOW);}delay(10);}
-
digitalRead(8)returns HIGH if the sensor has gone over the line.
Line Sensor Code and Connection for Raspberry Pi
As a line sensor is a digital sensor, its connection to Raspberry Pi is a simple as with Arduino. Figure 7-16 shows the circuit diagram. Wire it up as shown, and then run the code shown in Example 7-6.

# line_sensor.py - print to serial if we are on a line# (c) BotBook.com - Karvinen, Karvinen, Valtokariimporttimeimportosimportbotbook_gpioasgpio#defmain():linePin=23gpio.mode(linePin,"in")whileTrue:lineState=gpio.read(linePin)#if(lineState==gpio.HIGH):"Sensor is on the line"else:"Sensor is off the line"time.sleep(0.5)if__name__=="__main__":main()
-
Make sure there’s a copy of the botbook_gpio.py library in the same directory as this program. You can download this library along with all the example code from http://botbook.com. See GPIO Without Root for information on configuring your Raspberry Pi for GPIO access.
-
The digital value is read just like any other sensor.
Environment Experiment: Black is White

As you already know, an infrared sensor sees the world differently than we do. Different materials reflect light differently, and sometimes objects that appear dark can be so reflective that the sensor thinks they are white. If your line-following robot acts strange, it might be the surface texture—not the code—that’s playing tricks on you.
Usually black is black and white is white, but the total opposite has happened to us. When we presented our mind-controlled robot at Maker Faire, we brought tape and cardboard in order to make a platform with black borders and white center. The idea was that our robot would turn back when it saw black, keeping it on the platform. Surprisingly, the line detector saw tape and cardboard in inverted colors, as one was very reflective and the other very matte.
You can adjust the line follower sensitivity by adjusting its onboard potentiometer as shown in Figure 7-18.

Upload the code shown in Example 7-7 to Arduino. We have changed the previous example slightly so that now the serial monitor says BLACK or WHITE depending on what it sees.
// line_sensor_black_or_white.ino - line follow sensor. Signal low when over black line.// (c) BotBook.com - Karvinen, Karvinen, ValtokariconstintsensorPin=2;constintledPin=13;intlineFound=-1;voidsetup(){Serial.begin(115200);pinMode(sensorPin,INPUT);// No need for pull-up as sensor has this already.pinMode(ledPin,OUTPUT);}voidloop(){lineFound=digitalRead(sensorPin);if(lineFound==1){Serial.println("BLACK");digitalWrite(ledPin,HIGH);}else{Serial.println("WHITE");digitalWrite(ledPin,LOW);}delay(50);}
This code combines serial printing with the code shown in Line Sensor Code and Connection for Arduino.
Try out different materials. Can you find one that’s black for humans but white for the sensor?
Experiment: All the Colors of the ’Bow
A color sensor measures the color of a surface and returns values for red, green, and blue (Figure 7-19). For each basic color (red, green, blue), a color sensor has a color filter on top of a photodiode. The sensor for each color is read like any analog resistance sensor.

The experiment prints RGB (red, green, blue) values of the light it sees, one value for each color. You can use this sensor to build the Chameleon Dome (Test Project: Chameleon Dome).
Colors are simply names for specific wavelengths of light. For example, 555 nanometers (nm, which describes the light’s wavelength) or 540 terahertz (THz, its frequency) is green. Some animals can see colors humans don’t see, like ones in the infrared or the ultraviolet range.
The basic colors really are fundamental to humans. The only colors that the human eye can see are red, green, and blue. There are three types of cone cells in the retina, one type for each color.
Color Sensor Code and Connection for Arduino
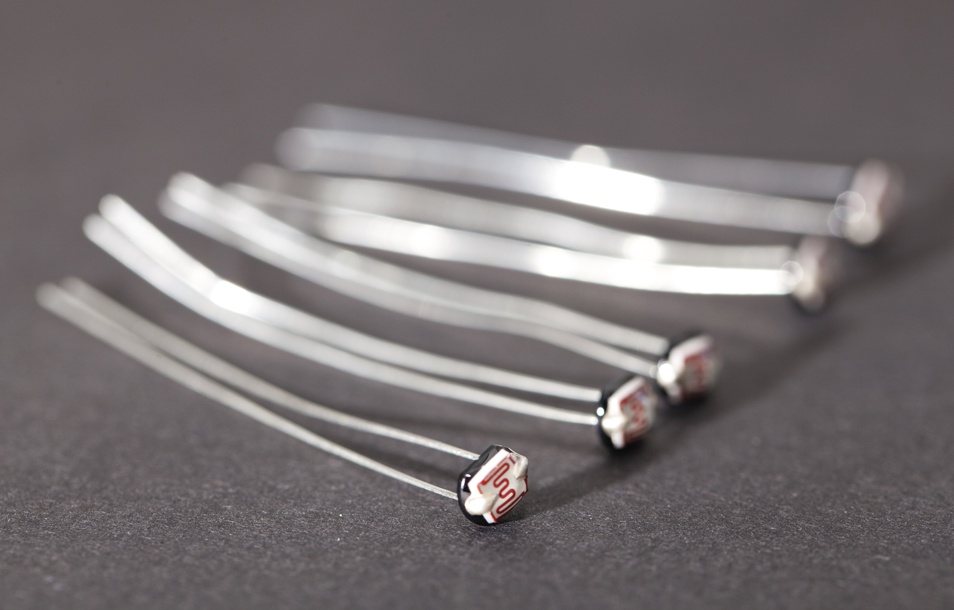
Figure 7-20 shows the circuit diagram for the color sensor and Arduino. Wire it up as shown, and then run the sketch shown in Example 7-8.
// color_sensor.ino - sense color with HDJD-S822-QR999 and print RGB value// (c) BotBook.com - Karvinen, Karvinen, Valtokariconstintgsr1Pin=7;//constintgsr0Pin=6;constintgsg1Pin=5;constintgsg0Pin=4;constintgsb1Pin=3;constintgsb0Pin=2;constintledPin=8;//constintredPin=A0;//constintgreenPin=A1;constintbluePin=A2;intred=-1;//intgreen=-1;intblue=-1;voidsetup(){Serial.begin(115200);pinMode(gsr1Pin,OUTPUT);pinMode(gsr0Pin,OUTPUT);pinMode(gsg1Pin,OUTPUT);pinMode(gsg0Pin,OUTPUT);pinMode(gsb1Pin,OUTPUT);pinMode(gsb0Pin,OUTPUT);pinMode(ledPin,OUTPUT);digitalWrite(ledPin,HIGH);//digitalWrite(gsr1Pin,LOW);//digitalWrite(gsr0Pin,LOW);digitalWrite(gsg1Pin,LOW);digitalWrite(gsg0Pin,LOW);digitalWrite(gsb1Pin,LOW);digitalWrite(gsb0Pin,LOW);}voidloop(){intredValue=analogRead(redPin);//intgreenValue=analogRead(greenPin);intblueValue=analogRead(bluePin);redValue=redValue*10/1.0;//greenValue=greenValue*10/0.75;blueValue=blueValue*10/0.55;Serial.(redValue);Serial.("");//Serial.(greenValue);Serial.("");Serial.(blueValue);Serial.println("");delay(100);}
-
Specify the gain selection pins. To calibrate individual colors, you can later add gain to red (
gsr1Pin,gsr0Pin), green (gsg1Pin,gsg0Pin), or blue (gsb1Pin,gsb0Pin) if needed. This way, you can increase sensitivity to individual colors as needed.-
This LED illuminates the surface and is critical for the operation of this sensor. The illuminating LED is built into the sensor.
-
Pins for reading red, green, and blue levels.
-
The variables for the values read from the sensor. The variables are initialized to impossible values to help debugging (if you see those values later when the code is running, then something’s wrong).

Turn on the sensor’s built-in LED for illuminating the surface.

Turn off gain selection for all colors. Each color has two bits (0 and 1), allowing for four levels (including off) of gain selection.

Reading the values is a simple call to
analogRead().
The elements for different colors have different sensitivity. On the other hand, you need all of RGB in the same scale if you want to recreate the color. The conversion factors (10 red, 14 green, 17 blue) were deduced from “HDJD-S822-QR999 RGB Color Sensor Datasheet.”

Print each of the RGB values to the serial monitor (Tools→Serial Monitor).
Color Sensor Code and Connection for Raspberry Pi
Figure 7-21 shows the circuit for Raspberry Pi. Hook it up as shown, and then run the code shown in Example 7-9.

# color_sensor.py - sense color and print RGB value to serial# (c) BotBook.com - Karvinen, Karvinen, Valtokariimporttimeimportbotbook_mcp3002asmcp#importbotbook_gpioasgpiodefinitializeColorSensor():ledPin=25gpio.mode(2,"out")#gpio.mode(3,"out")gpio.mode(14,"out")gpio.mode(17,"out")gpio.mode(22,"out")gpio.mode(27,"out")gpio.write(2,gpio.LOW)gpio.write(3,gpio.LOW)gpio.write(14,gpio.LOW)gpio.write(17,gpio.LOW)gpio.write(22,gpio.LOW)gpio.write(27,gpio.LOW)gpio.mode(ledPin,"out")gpio.write(ledPin,gpio.HIGH)#defmain():initializeColorSensor()whileTrue:#redValue=mcp.readAnalog(0,0)greenValue=mcp.readAnalog(0,1)blueValue=mcp.readAnalog(1,0)#redValue=redValue*10/1.0;#greenValue=greenValue*10/0.75;blueValue=blueValue*10/0.55;("R:%d, G:%d, B:%d"%(redValue,greenValue,blueValue))#time.sleep(0.1)# sif__name__=="__main__":main()
-
Both libraries, botbook_mcp3002.py (analog) and botbook_gpio.py (digital), must be in the same directory as this program (color_sensor.py). You must also install the spidev library, which is imported by botbook_mcp3002. See the comments in the beginning of botbook_mcp3002/botbook_mcp3002.py or Installing SpiDev. You can download both libraries, along with all the example code, from http://botbook.com. For configuring access to GPIO without needing to be root, see GPIO Without Root.
-
Turn off all gains by putting the gain select (
gs*) pins to 0 (LOW).-
Light up the illuminating LED in the sensor. This light is needed for the sensor to see the colors of the surface it’s measuring.
-
The program will keep running until you press Control-C.
-
Read the second (1, because we start counting at 0) MCP3002 chip on the first (0) channel:
readAnalog(device=1, channel=0). The preceding commands use a different combination of chip and channel.-
Equalize the color values according to the “HDJD-S822-QR999 RGB Color Sensor Datasheet.” After equalization, all colors use the same scale.
-
Create the printable string with a format string. The format string takes only one parameter, so multiple values are put inside a tuple,
(a, b).
Test Project: Chameleon Dome
Our final project for this chapter is a dome that changes color to match the surface it’s sitting on. We’ll use the color sensor code and display the color it senses with an RGB LED. When the whole thing is built in a solid package, the result is very impressive.

What You’ll Learn
In the Chameleon Dome project, you’ll learn how to:
- Build a device that changes color like a chameleon.
- Show any color with an RGB LED.
- Use a moving average to filter out random noise.
- Use an easing function to map input values to output values.
RGB LED
An RGB LED (Figure 7-22) packages three LEDs into one package. It looks just like a single LED. By mixing red, green, and blue, you can show any color.
The human eye has receptor cells for three colors: red, green, and blue. That’s why those colors are used in televisions and other displays. Human perception has a strange feature (or a bug) that it sees combinations of frequencies as another frequency. This means that you can mix red light with green to get yellow.
An RGB LED typically has four leads: one lead for each color (red, green, blue) and one common lead.

Contrary to what you might expect, in many RGB LEDs, the common lead is often positive. A common positive lead is also called common anode. Because the common lead is positive, you’ll have to take each color lead (red, green, blue) LOW (0 V or GND) to make each color shine.
But how do you know which lead is the common anode, and which one is each color?
Finding the Leads of an RGB LED
You can find the leads experimentally.
Turn on Arduino by connecting it to USB. As you’ll just use +5 V and GND, it doesn’t matter which code is running on the Arduino.
We are using a 5 V LED. If you only have a LED for lower voltage, you can use +3.3 V when testing for colors, and a resistor when connecting to Arduino.
On Arduino, connect a red wire to +5 V and a black wire to GND.
Connect the two wires to any adjacent leads on the RGB LED. Keep trying adjacent leads around the LED until it lights up. Try a couple of other leads until you have lit the red, green, and blue elements of the RGB LED separately. Note that in order to do this, one lead (for a common anode LED, this would be the positive lead) had to stay connected to the red +5 V wire, while you had to connect each of the other three leads in turn to the black GND wire. Mark the common anode (positive) lead.
If you notice that the common lead is longer than the others, remember this fact so you can find it later. Otherwise, mark the common lead with a small piece of tape and write something on it (A for anode, + for positive, whatever helps you remember).
If instead, you kept a common lead connected to the black GND wire and had to connect each of the other three leads in turn to the red +5 V wire, then you have a common cathode LED. If that’s the case, see What About Common Cathode?.
Mark each of the remaining leads with their corresponding color (R, G, or B).
RGB Code and Connection for Arduino
// hellorgb.ino - mix colors with RGB LED// (c) BotBook.com - Karvinen, Karvinen, ValtokariconstintredPin=11;//constintgreenPin=10;constintbluePin=9;voidsetup(){pinMode(redPin,OUTPUT);pinMode(greenPin,OUTPUT);pinMode(bluePin,OUTPUT);}voidloop(){setColor(255,0,0);//delay(1000);setColor(255,255,255);delay(1000);}voidsetColor(intred,intgreen,intblue){analogWrite(redPin,255-red);//analogWrite(greenPin,255-green);analogWrite(bluePin,255-blue);}
-
Like many RGB LEDs, this one has common positive lead. This means that all the data pins will need to be taken negative (LOW, 0 V) to light up.
-
To light the RGB LED, just call
setColor()with the color you want. The parameters are R, G, and B, where each color is from (nothing) 0 to (maximum) 255.-
Because you need to take a pin low to light a color, things are reversed from what you’re used to. For example, when
redPinisHIGH(255), the red LED is off. WhenredPinisLOW(0), the red LED is at maximum brightness.


Do you just want to make your Chameleon Dome? Skip the math and jump to Combining Codes.
Moving Average
The Chameleon Dome looks nice when it smoothly changes values. It would look ugly if it erratically jumped from one color to another. But that’s one of the perils of working with sensors: sometimes, for a blink of an eye, a red will look green for the sensor.
Random noise is a common problem in any measurement, and sensors are no exception.
Consider how I might measure the height of a tiny tree. I made multiple measurements to reduce the chance of error. I got these values:
102 cm, 100 cm, 180 cm, 103 cm, 105 cm
Most of us would likely drop the 180 cm measurement as a typo. Luckily, a computer can do that for you.
Initially, you might think of storing the values in an array, and then calculating the average for the array on every round. Even though this would work, it would require a lot of code for such a small thing: an array, a pointer, an average, and some calculation on each iteration.
Moving average to the rescue! You can calculate the average of current and previous value to get some smoothing. To get more data points without using a table, you can use a weighted moving average.
You could give 70% weight to new input, leaving 30% (100% minus 70%) for old values.
input = 0.7*input + 0.3*old
old = input
Because the old value is affected by the older data points, you don’t need to use an array at all.
RGB LED Shows Any Color
To get a variety of colors, you’ll need to mix red, green, and blue at varying levels. If you set all three of them to full brightness, you’ll get something pretty close to white light. If you set all three of them to minimum brightness, you’ll get nothing.
Arduino isn’t capable of truly dimming an LED, because an LED can’t be dimmed effectively. If you lower the voltage, the brightness will go down, but lower the voltage enough, and it simply turns off (usually well before you get all the way down to 0 V).
To work around this, Arduino uses pulse width modulation (PWM). To make an LED look like it’s at 10% brightness, PWM will use a duty cycle of 10%. This means that Arduino will keep the LED on for 10% of the time, and off 90% of the time. But Arduino switches the LED on and off so fast (each cycle takes 2 milliseconds or 2000 microseconds) that you don’t notice the flicker. At a 10% duty cycle, Arduino will turn the LED on for 200 microseconds, leave it off for 1800 microseconds, then start the on/off cycle again.
But in your code, you don’t have to worry about these details. You can pretend that you’re just sending a range of voltage (from 0 to 255) that corresponds to different brightness levels. Because the common lead is HIGH and each color lead is brightest when you take the lead LOW, you’ll get the brightest red color with analogWrite(redPin, 0).
For any values between the minimum and the maximum, we use the value of the color (such as red, r) subtracted from 255:
analogWrite(redPin, 255-r);
To get a feel for the basic colors, see Table 7-1.
| Name | RGB color | Data pin values | Comment |
Black | (0,0,0) | (255,255,255) | All colors off |
Red | (255,0,0) | (0,255,255) | |
Green | (0,255,0) | (255,0,255) | |
Blue | (0,0,255) | (255,255,0) | |
White | (255,255,255) | (0,0,0) | Maximum brightness of all LEDs |
(formula) | (r,g,b) | (255-r, 255-g, 255-b) |
You can get all the colors of the rainbow. Just experiment with mixing red, green and blue light!
Easing Input to Output
Inputs and outputs can have different kinds of values. Your code must convert between these values.
In the simplest case, output is just the input multiplied by a number. In that case, conversion is just a matter of multiplication.
For example, Arduino’s analogRead() has range of 0 to 1023, but analogWrite() has a range of 0 to 255. To convert between the ranges, you must first calculate the percentage, p, of the maximum input value, that a given input value (in) represents:
p = in/1023
Then, the mapped output is p percent of the maximum output value:
out = p*255
Arduino’s library even has a convenience function for this:
out = map(in, 0, 1023, 0, 255)
You can see some examples of linear conversion in Table 7-2.
| Input analogRead() | Percent | Output analogWrite() |
0 | 0.0 % | 0.0 |
234 | 23 % | 58 |
511 | 50 % | 127 |
1023 | 100 % | 255 |
However, some outputs don’t work well with an output that increases linearly, so you need to use easing. The RGB LED in this project is a good example of an output that works better with easing.
Most RGB LED color mixing needs to happen with low values. Near the upper range of output values, everything becomes white, and individual colors are hard to discern.
An easing function maps inputs to outputs in non-linear fashion. For an RGB LED, an exponential function is good. Otherwise, most values would just result in bright white light instead of colors like orange or violet.
First, calculate the percentage for the input:
p = in/1023
Then create the output non-linearly. Both ends, bottom 0 and top 255, are still represented along the range of possible values. The Chameleon Dome uses an exponent function for easing:
out = 255 * p4
Because percentage p has a maximum of 1.0 (100%), the exponent p4 values are always between 0.0 (0%) and 1.0 (100%). The exponent function creates the classic hockey-stick figure. You can see sample values mapped in Table 7-3.
| p | p**4 | analogWrite() | Comment |
0% | 0.0% | 0 | min |
20% | 0.2% | 0 | |
40% | 2.6% | 6 | |
50% | 6.2% | 15 | |
half | 60% | 13.0% | 33 |
80% | 41.0% | 104 | |
90% | 65.6% | 167 | |
100% | 100.0% | 255 |
Easing functions are also used in animation. When objects slide and then stop into place, the speed accelerates and decelerates according to an easing function.
Combining Codes
The Chameleon Dome combines an RGB LED with the color sensor you saw earlier in Color Sensor Code and Connection for Arduino.
Connect the color sensor and RGB LED to Arduino as shown in Figure 7-27. DuPont connector cables (see Figure 7-25) combined with a ScrewShield are a life-saver when you need to use a lot of pins (see Figure 7-26).


The sketch for the Chameleon Dome is shown in Example 7-11. After you make all the connections (Figure 7-27), run that sketch on your Arduino.

// chameleon_dome.ino - cube changes color to match the surface// (c) BotBook.com - Karvinen, Karvinen, Valtokariconstintgsr1Pin=7;//constintgsr0Pin=6;constintgsg1Pin=5;constintgsg0Pin=4;constintgsb1Pin=3;constintgsb0Pin=2;constintledPin=8;//constintredInput=A0;//constintgreenInput=A1;constintblueInput=A2;constintredOutput=11;//constintgreenOutput=10;constintblueOutput=9;intred=-1;//intgreen=-1;intblue=-1;constfloatnewWeight=0.7;//voidsetup(){Serial.begin(115200);pinMode(gsr1Pin,OUTPUT);pinMode(gsr0Pin,OUTPUT);pinMode(gsg1Pin,OUTPUT);pinMode(gsg0Pin,OUTPUT);pinMode(gsb1Pin,OUTPUT);pinMode(gsb0Pin,OUTPUT);pinMode(ledPin,OUTPUT);pinMode(redOutput,OUTPUT);pinMode(greenOutput,OUTPUT);pinMode(blueOutput,OUTPUT);digitalWrite(ledPin,HIGH);//digitalWrite(gsr1Pin,LOW);digitalWrite(gsr0Pin,LOW);digitalWrite(gsg1Pin,LOW);digitalWrite(gsg0Pin,LOW);digitalWrite(gsb1Pin,LOW);digitalWrite(gsb0Pin,LOW);}voidloop(){intredValue=analogRead(redInput);//intgreenValue=analogRead(greenInput);intblueValue=analogRead(blueInput);redValue=redValue*10/1.0;greenValue=greenValue*10/0.75;blueValue=blueValue*10/0.55;redValue=map(redValue,0,1023,0,255);//greenValue=map(greenValue,0,1023,0,255);blueValue=map(blueValue,0,1023,0,255);if(redValue>255)redValue=255;//if(greenValue>255)greenValue=255;if(blueValue>255)blueValue=255;red=runningAverage(redValue,red);//green=runningAverage(greenValue,green);blue=runningAverage(blueValue,blue);Serial.(red);Serial.("");Serial.(green);Serial.("");Serial.(blue);Serial.println("");if(red<200||green<180||blue<180){green=green-red*0.3;//blue=blue-red*0.3;}red=easing(red);//green=easing(green);blue=easing(blue);setColor(red,green,blue);//delay(100);}intrunningAverage(intinput,intold){returnnewWeight*input+(1-newWeight)*old;//}inteasing(intinput){//floatpercent=input/255.0f;return255.0f*percent*percent*percent*percent;}intsetColor(intr,intg,intb){//analogWrite(redOutput,255-r);//analogWrite(greenOutput,255-g);analogWrite(blueOutput,255-b);}
-
These are the gain pins for each color. This code doesn’t use gain, but sets all gain pins LOW. If you decide to use them, see Example 7-8 for more details.
-
This is the pin for the surface-illuminating LED in the sensor.
-
These are the input pins to read RGB values.
-
The output pins for the RGB LED.
-
Global variables to hold manipulated color values. They are initialized to impossible values to make debugging easier (if you see these values appear later when the code is running, you know something’s wrong).
-
The weighting value to apply to new input (see Moving Average).
-
Illuminate the surface before taking measurements.
-
Read the red color.
analogRead()returns a raw integer value between 0 and 1023.-
Map
analogRead()values (0..1023) toanalogWrite()values (0..255).

Because color values are equalized (e.g., red is multiplied by 10), they could end up higher than the maximum used in the map. This would result in a red value higher than 255. But later you’ll be controlling the LED with
analogWrite(), so you must cap the value at 255.
Some aesthetic color changes, with values found experimentally.

Make colors change a little more slowly, instead of just immediately jumping from red to green.

Set the RGB LED to a calculated color. Now the user can see the result.

A moving average allows you to smooth out random noise in the input. See Moving Average.

Easing is an animation term. When Flash or JavaScript animations move things so that they accelerate and decelerate like real objects, that’s often done with easing functions. The function here makes values lower than 255 (100%) smaller. Smaller values are affected more. The purpose is to make the output (RGB LED) change slowly and smoothly.

Change the RGB LED color to the given RGB value. Parameters are integers in the range of 0..255.

For common anode (common positive), the data pins are negative pins, and the values must be inverted. See RGB LED Shows Any Color.
Dome Building Tips
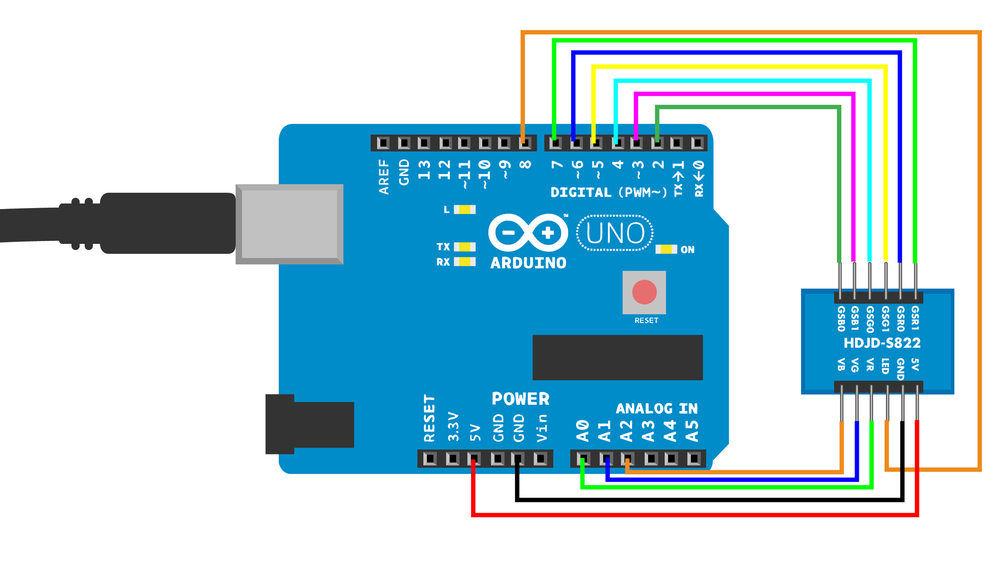
We found a perfect casing for our Chameleon Dome from IKEA. With some minor hacking, the Solvinden lamp is made for this. Obviously you can use any translucent box or dome that pleases your eye. There are tons of different lamps to choose from, or you could even use a freezer food storage container.
Start by opening Solvinden (Figure 7-28) and pry the bottom cover lid off (Figure 7-29). Remove the original electronics to make space for our gadget as shown in Figure 7-30.


There is a plastic stick in the center of the bottom; cut it off (see Figure 7-31). You need to make two holes, one 19 mm for the sensor to see what’s below; and one 3 mm to attach the Arduino and the RGB LED (Figure 7-32).


Use hot glue to attach the sensor pointing down, and make sure it’s in the center of the hole as shown in Figure 7-33.

Use a 3 mm screw to secure Arduino in the bottom (see Figure 7-33). On the top of that same screw holding Arduino, put the RGB LED. Our LED already had holes, but we needed to drill one larger to fit in the 3 mm screw.
Now just put the battery in the clip, turn the power switch on, close the dome, and enjoy your Chameleon Dome (see Figure 7-34).

Now your devices can see the light in many ways: detect the presence and direction of light, measure its intensity, and even its color.