
19
Active Directory Audit and Monitoring
Microsoft SQL Server is a database server. If I need a database server for a project, I can simply spin up a server and install Microsoft SQL Server on it and then use it to store data. In this situation, my requirement is static. As long as I am using the software/service, I need a working database server. But when it comes to cyber security, the requirements are not static – they change very often. There are new bugs and security threats found every day. A security solution we use today may not work well against new threats found in the future. The only possible way to address this challenge is to "continuously improve" the solutions in place. To do this, we can use the following steps as guidelines. These four steps are connected to each other and work as a life cycle rather than one-time process:
- Identify
- Protect
- Detect
- Respond
Before we come up with a solution, we first need to "identify" what to protect. The tools and services we can use to protect identities are different from what we can use to protect applications. Also, we need to be mindful when choosing where to make investments. As an example, we need to invest more to protect sensitive business data than protecting five-year-old pictures from a marketing campaign. Once we identify what we need to protect, then we can use the relevant tools and services to "protect" it.
One of the pillars of the Zero-Trust security approach is "assume a breach". We can't close all the doors. We need to assume a breach has already happened. But the important thing is that when it happens, there should be a way to "detect" it. If the solution or services in place are not in a healthy state, we need to detect those events as well. Once we detect a breach or issue, then we can "respond" in a timely manner. Each step through this life cycle is critically important. However, "detect" has more weight as we are not only looking to identify a breach, we can also use that information to confirm whether the solution in place is working as expected. This is why auditing and monitoring are important.
Before I use the London Underground service, I always check the Transport for London (TfL) website to see the status of the tube line services. This is a service provided by TfL to make sure its users are planning their journeys properly to avoid delays. The system TfL has in place to monitor line statuses gives us two benefits. As a service provider, TfL can detect problems and start to address them immediately. At the same time, some filtered information is passed to the public that is important for planning their journey.
Similarly, auditing and monitoring are not only there to enable engineers to find problems. They should also provide filtered, structured information that is important to the roles and responsibilities of different parties in the business. As an example, the IT manager would like to know the overall domain service availability over the last month, but it is not important for them to know each and every event that happened in the system during the last 30 days, although this can be important for the IT engineers.
In auditing and monitoring, we also need to identify what to monitor and what should be reported. Knowing each and every thing that happens in the system is good, but at the same time, unless it has been analyzed and prioritized, it will not deliver any benefit to engineers in detecting issues properly. Therefore, we need systems to audit and monitor the correct things and present it in a useful way.
Active Directory (AD) itself is not a security solution, but in previous chapters, I explained how we can use the features of AD to protect identities. So, it is important for us to monitor the health of AD.
In this chapter, we will look at the following:
- Monitoring Active Directory Domain Services (AD DS) related events and logs
- Advanced auditing for AD infrastructure
- Using Microsoft Defender for Identity to monitor identity infrastructure threats
- Azure AD Connect Health
Before we look into the other tools and services we can use to monitor AD, let's see what the built-in Windows tools can provide.
Auditing and monitoring AD using built-in Windows tools and techniques
Microsoft offers built-in features and tools to monitor and audit AD environments. In this section, we are going to review these features and tools.
Windows Event Viewer
As an engineer, I am sure you are well aware of Windows Event Viewer. It is a built-in tool that can be used to view and filter event logs on a local or remote computer. The events shown there are generated by the operating system, services, server roles, and applications. This is the most commonly used tool in Windows systems for auditing and troubleshooting purposes.
We also can write custom events to event logs. This is useful if you plan to run a script or action based on a particular event ID. This can be done by using the Write-Eventlog cmdlet.
As shown in the following screenshot, Windows Event Viewer (Local) has four different categories to group event logs:
Figure 19.1: Windows Event Viewer
In the preceding list, Windows Logs and Application and Service Logs both have additional predefined subcategories.
Custom Views
Event Viewer allows the creation of Custom Views based on event level, time, log type, source type, event ID, task category, keywords, users, or computers. Event Viewer catches thousands of different events. Using Custom Views, we can filter events and access the information we need. All these custom-made views will be listed under the Custom Views section. It also has predefined custom views.
These predefined custom views are based on the server roles. When AD DS roles are added, it also creates a custom view in the event log to group all the AD DS-related events, as shown in the following screenshot:

Figure 19.2: Windows Event Viewer Role logs
The data that appears in these custom views will also be available on other logs such as Windows Logs.
Windows Logs
The Windows Logs section includes five Windows log files. These mostly contain OS-related events:
- Application log: This log contains the events collected from various applications running on the system. These events can be from Microsoft or any other application.
- Security log: This log includes events such as successful and failed system login attempts. Engineers can specify which security events need to be recorded using audit policies.
- Setup log: This includes events related to application setup and adding/removing server roles.
- System log: This log includes events related to Windows system components. As an example, an event related to an automatic service start failure will be listed under this log.
- Forwarded Events: Using Event Viewer, we can connect to another remote computer and view the events. However, it may be required to watch for specific events from multiple sources. As an example, let's assume we need to collect events with ID
4321from three computers. Using the Subscriptions event, we can collect only those events and forward them to the Forwarded Events log.
Forwarded Events is the default location to push subscribed events. However, if needed, these events can also be forwarded to other log files.
Applications and Services Logs
The Application and Services Logs category was introduced after Windows Server 2008. This stores the events related to applications and their components. Most of the events listed here are more suited for application developers doing debugging and application-level troubleshooting.
This category has four log types:
- Admin: Events listed in this log are understandable by end users and IT professionals. This information can be used for basic application troubleshooting. Most of these log entries will include instructions or links to knowledge base articles from the application vendor to find out more about the given issue or to fix it.
- Operational: Operational events include information about configuration or status changes of an application/service. These events are useful for application diagnosis.
- Analytic: This log is hidden and disabled by default. This is usually only enabled during the application or service diagnosis process as this generates a high volume of events.
- Debug: This is purely used for troubleshooting purposes by application developers and vendors. Similar to the Analytic log, it is, by default, hidden and disabled.
As mentioned before, we also can see events data from remote locations by using subscriptions. Let's see what subscription data includes.
Subscriptions
This category lists down the event subscriptions created with remote computers. Here, we can create/edit/disable event subscriptions, check the runtime status, and forcibly run subscription jobs.
When we open up an event, it gives different levels of information, such as the following:
- A general description about the problem
- The log file name
- The event source to indicate where it came from
- The event ID number
- The level of the error (critical, information, or warning)
- The username of the error owner
- Links to TechNet, KB, or other sources to get more information about the event
- The time of the event
- Hostname of the source computer
In the previous section, I explained Applications and Services Logs and the types of data available under it. There are a few different Applications and Services Logs related to the AD service.
AD DS event logs
Apart from the events under the Windows Logs category, AD DS and related service events can be found under the following logs. These are located under the Applications and Services Logs category:
- AD Web Services
- DFS Replication
- Directory Service
- DNS Server
- File Replication Service (only if using FRS)
Apart from events, AD DS and related services have other system log files that record data about service installation/uninstallation, performance, service errors/failures, and so on.
AD DS log files
These log files can be used for auditing, troubleshooting, or debugging purposes.
The default location for these log files is %SystemRoot%Debug:
DCPromo.log: This log file is created during the AD promotion process. It also records events during the demotion process. This log contains events such as the following:- AD DS configuration settings
- Information about schema preparation
- Information about directory partition creation/modifications
- Information about data replication
- Service configuration status
- Information about creating AD databases and the
SYSVOLdirectory
DCPromoUI.log: This log file can be considered as a progress report for the AD DS promotion/demotion process. It starts the logging process as soon as the AD DS configuration wizard opens, and ends when it completes the installation successfully (until the reboot request is accepted) or when it is aborted due to errors. This includes the results of each and every act of the system during the service installation and removal process. This log includes useful information, such as the following:- A timestamp for when the installation or removal process started
- Detailed results of each validation test
- The name of the domain controller used for the initial replication
- A list of directory partitions that were replicated
- The number of objects replicated in each and every partition
- Configuration summary
- Information about registry key changes related to configuration
DFSR.log: This log file includes events related to DFS replication. This can be used forSYSVOLreplication troubleshooting and the debugging process (ifSYSVOLuses DFS replication).
After Windows Server 2008, AD uses DFS replication by default, but if domain controllers have been introduced to a Windows Server 2003 environment, it will use FRS by default.
AD audit
The only way to identify potential security threats and security breaches in infrastructure is through continuous monitoring and auditing. When it comes to auditing, the Windows system itself provides advanced auditing capabilities to identify such security issues. However, by default, only certain types of actions are audited. These auditing settings are handled by Windows audit policies.
Here, we are only going to look at advanced security audit policies, which were first introduced with Windows Server 2008 R2.
There are 10 categories of events we can audit in a Windows system:
- System events
- Logon/logoff events
- Object access events
- Privilege use events
- Detailed tracking events
- Policy change events
- Account management events
- Directory Service (DS) access events
- Account logon events
- Global object access auditing
Each and every event category also has subcategories.
Legacy Windows auditing provides nine categories and each category also has subcategories. These are located under Computer Configuration | Windows Settings | Security Settings | Local Policies | Audit Policies. Also, categories and subcategories can be listed using auditpol /get /category:*. Advanced security audit policies provide 53 options to tune up the auditing requirements, and you can collect more granular-level information about your infrastructure events than by legacy auditing.
Auditing on these categories can be enabled using group policies. These are located under Computer Configuration | Windows Settings | Security Settings | Advanced Audit Policy Configuration | Audit Policies, as shown in the following screenshot:

Figure 19.3: Advanced audit logs
All these categories can collect a lot of system and service events related to AD infrastructure activities. But in this section, we are only going to focus on the DS Access events category and its subcategories. It audits events related to AD objects access and AD object modification. Also, the settings under this category only apply to domain controllers.
The DS Access events category includes four subcategories:
- Audit Directory Service Access
- Audit Directory Service Changes
- Audit Directory Service Replication
- Audit Detailed Directory Service Replication
As our next step, let's explore each of the above subcategories in more detail.
Audit Directory Service Access
This category records events when an AD DS object is accessed. This will only work if the system access control list (SACL) is configured and the relevant objects have been added. This is similar to directory service access in legacy auditing.
SACL allows engineers to log access attempts to secured objects. SACL can generate audit records when an access attempt fails, when it succeeds, or both.
When auditing is enabled under this category, the following event can be found under security logs:
|
Event ID |
Event message |
|
|
An operation was performed on an object |
Audit Directory Service Changes
This category records events related to AD DS object changes, such as the following:
- Create
- Delete
- Modify
- Move
- Undelete
When an object value is changed, it records the old value and the new value it was changed to. Again, the event will only be generated for the entries listed under SACL. Once auditing is enabled, the following events can be found under security logs:
|
Event ID |
Event message |
|
|
A directory service object was modified. |
|
|
A directory service object was created. |
|
|
A directory service object was undeleted. |
|
|
A directory service object was moved. |
|
|
A directory service object was deleted. |
Audit Directory Service Replication
This category logs events when replication between two domain controllers begins and ends. When auditing is enabled, we will be able to find the following events in the logs:
|
Event ID |
Event message |
|
|
Synchronization of a replica of an AD naming context has begun. |
|
|
Synchronization of a replica of an AD naming context has ended. |
Audit Detailed Directory Service Replication
This category records detailed information about data replicated between domain controllers. Once auditing is enabled, it will generate a high volume of events and will be useful for troubleshooting replication issues. It will log the following types of events:
|
Event ID |
Event message |
|
|
An AD replica source naming context was established. |
|
|
An AD replica source naming context was removed. |
|
|
An AD replica source naming context was modified. |
|
|
An AD replica destination naming context was modified. |
|
|
Attributes of an AD object were replicated. |
|
|
Replication failure start. |
|
|
Replication failure end. |
|
|
A lingering object was removed from a replica. |
Demonstration
In this section, let's go ahead and see how we can use built-in Windows monitoring and audit capabilities. In order to do these configurations, you need to have domain administrator or enterprise administrator privileges.
Reviewing events
Event Viewer can simply be opened by running eventvwr.msc. The same MMC can also be used to connect to a remote computer using the Connect to Another Computer... option, as highlighted in the following screenshot:

Figure 19.4: Review events on another computer
We can simplify this by creating server groups in Server Manager. Server groups allow us to group systems running similar server roles or acting as part of a distributed system.
Before we go ahead and create server groups, we need to take note of the following information:
- We need an account that has administrator privileges for all the member servers to create and use server groups.
- We must enable Windows Remote Management (WinRM); after Windows Server 2012, WinRM is enabled by default. The existing WinRM configuration can be reviewed using the PowerShell
winrm get winrm/configcommand. If it's not enabled, we can enable it using thewinrm quickconfigcommand. - Even if we are logged in as a domain administrator or an enterprise administrator, by default, it is not allowed to collect events from remote computers. In order to do that, we need to add a collector computer account (the server where the server group is created) to the
Event Log Readersgroup. This is a built-in local group. Members of this group can read event logs from the local machine. We can add a computer account to the group using the following command:Add-ADGroupMember –identity 'Event Log Readers' –members REBELNET-PDC01$REBELNET-PDC01can be replaced with the collector computer account. - In order to create a server group, go to Server Manager from the dashboard and select Create a server group, as shown in the following screenshot:

Figure 19.5: Create a server group
- In the new window, we can provide a name for the group and add members to the group. It provides different methods to select from in order to search for the members, as shown in the following screenshot:

Figure 19.6: Add servers
- Once a group is created, you can access it using the left-hand panel in Server Manager. Inside the group window, there is a separate section called EVENTS. When we navigate through each member, it will show us events related to each member in the EVENTS window, as shown in the following screenshot:

Figure 19.7: Events from the remote server
We can configure the event data and modify it as follows:
- Event severity levels
- Event time frames
- Event log files where the data will be gathered, as shown in the following screenshot:

Figure 19.8: Configure Event Data option
The following screenshot explains how we can configure event data using different options:

Figure 19.9: Configure Event Data window
We also can filter events and save them as queries for future use. As an example, I need to list events with ID 129. I can just filter it out by typing 129 in the filter field. But at the same time, I can create a query for it and save it for future use. So, next time, I can just run the query to filter out the data, as shown in the following screenshot:

Figure 19.10: Save a query
The following screenshot shows how once the query is created; it can be accessed whenever needed:

Figure 19.11: Access a saved query
So far, we have only considered accessing Event Viewer data locally. In the next section, we are going to look into accessing Event Viewer data centrally.
Setting up event subscriptions
Event Viewer contains lots of different event entries. There can be several thousand events per day. Even if every event provides some useful information, we do not need to go through each and every one when we are troubleshooting a particular application or performing a service audit. There are specific events relevant to each server role, application, service, and system component.
On some occasions, when we're auditing or troubleshooting, we need to review events on multiple computers. Event Viewer only allows us to connect to one computer at a given time. It can be a local or a remote computer. Event subscriptions allow us to collect event logs from remote computers and review them on one console.
Before we configure event subscriptions, we need to perform the following steps:
- Enable WinRM.
- Add a collector computer account to the
Event Log Readersgroup.
Configuration steps for the aforementioned tasks are explained in the previous section.
Once the prerequisites are fulfilled, follow these steps:
- Log in to the Collector server.
- Open Event Viewer and go to Actions | Create Subscription.
- In the new window, enter the following details:
- Subscription name: The name of the subscription job.
- Destination log: The log file where collected events should appear. By default, it is the Forwarded Events log file.
We can select any log file available in the drop-down menu, as shown in the following screenshot:

Figure 19.12: Event subscription
- Collector initiated: We can list the source computers here. It is not a one-to-one connection. It can be any number of computers, as shown in the following screenshot:

Figure 19.13: Select source computer
- Source computer initiated: This allows you to define a subscription without defining the event source computers. Then, the source computers will be defined using a group policy setting located at Computer Configuration | Policies | Administrative Templates | Windows Components | Event Forwarding | Configure Target Subscription Manager.
In there, the collector should be added in the
Server=http://<eventcollector FQDN>:5985/wsman/SubscriptionManager/WEC,Refresh=10format. - Event to collect: Using this option, we can define which events are to be selected from the source computers. It is similar to a typical event filter window, as can be seen in the following screenshot:

Figure 19.14: Query events
- Change user account or configure advanced settings: In this option, we can define a separate account that can be used by a collector to extract events from source computers. It also gives us options to optimize the event delivery settings. This is important if a large number of events have been collected. An example can be seen in the following screenshot:

Figure 19.15: Advanced Subscription Settings
By default, we can't collect security logs from remote domain controllers due to permissions issues. Let's see how we can update the permissions manually to access the relevant data.
Security event logs from domain controllers
In order to collect security logs from remote domain controllers, we need to add a network service account to the channel access permissions of the security event log.
This is because the WinRM service is running under the network service account. This can be done by running the following code:
wevtutil sl security /ca:'O:BAG:SYD:(A;;0xf0005;;;SY)(A;;0x5;;;BA)(A;;0x1;;;S-1-5-32-573)(A;;0x1;;;S-1-5-20)'
O:BAG:SYD:(A;;0xf0005;;;SY)(A;;0x5;;;BA)(A;;0x1;;;S-1-5-32-573)(A;;0x1;;;S-1-5-20) contains READ permission settings for network service account (A;;0x1;;;). In the preceding code, the SID value for the network service account is (S-1-5-20), and the channel access value is (O:BAG:SYD:(A;;0xf0005;;;SY)(A;;0x5;;;BA)(A;;0x1;;;S-1-5-32-573)). Once all this is done, after a few minutes, we can see the Forwarded Events.
Enabling advanced security audit policies
As we have seen previously, for successful auditing, we need to have a SACL configured for the relevant AD objects. If there is no SACL entry, no events will be generated against that object. In order to configure the SACL, we need Domain Admin or Enterprise Admin privileges. To add a SACL entry, perform the following steps:
- Open AD Users and Computers.
- Click on View | Advanced Features.
- Right-click on the OU or the object that you'd like to enable auditing for. Then click on Properties. In my example, I am using the root container, as I wish to enable it globally.
- Click on the Security tab and then on Advanced.
- Click on the Auditing tab and then click on the Add button to add a new security principle to the SACL. In our scenario, I am using Everyone as I'd like to audit everything.
- For Type, I have selected the Success event type. Also, I've applied it to This object and all descendant objects, as can be seen in the following screenshot:

Figure 19.16: SACL entry
Once the SACL entries are in place, we can enable advanced audit policy configuration. In order to do that, perform the following steps:
- Go to Group Policy Management.
- In the MMC, expand the Domain Controllers OU.
- Right-click on Default Domain Controller Policy and select Edit.
- Then navigate to Computer Configuration | Policies | Windows Settings | Security Settings | Advanced Audit Policy Configuration | Audit Policies.
- In there, we can find all 10 audit categories. In this demo, we are only going to enable audit categories under DS Access.
- Navigate to DS Access and double-click on the Subcategory entry. To enable auditing, select Configure the following audit events and then select the events you'd like to audit. It's recommended to audit both Success and Failure, as shown in the following screenshot:

Figure 19.17: Audit Directory Service Access events
I have repeated the same configuration for the rest of the audit categories, as shown in the following screenshot:
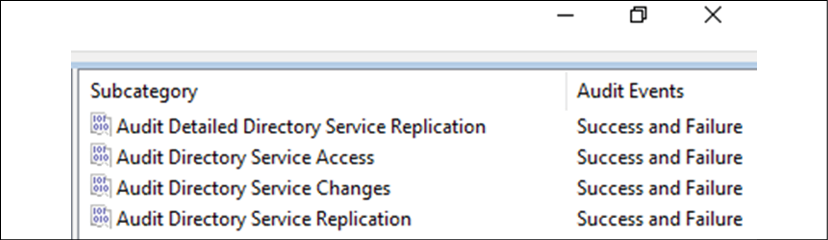
Figure 19.18: Audit categories
Once the group policy is applied successfully, it will start to log new events according to the audit policy.
Enforcing advanced auditing
Before Windows Server 2008, there were nine main auditing categories and subcategories. Those still continue to appear under Windows Server 2022. It is recommended not to mix them up, and only use advanced auditing instead. We can enforce the system to only accept advanced auditing policy settings if legacy audit policy settings are applied to the same category.
This can be done by enabling the Group Policy setting under Computer Configuration | Windows Settings | Security Settings | Local Policies | Security Options | Audit: Force audit policy subcategory settings (Windows Vista or later) to override audit policy category settings.
Reviewing events with PowerShell
We also can use PowerShell commands to review event logs or filter events from local and remote computers without any additional service configurations. Get-EventLog is the primary cmdlet we can use for this task, as shown in the following example:
Get-EventLog -List
The previous command will list the details about the log files in your local system, including the log file name, max log file size, and number of entries.
Get-EventLog -LogName 'Directory Service' | fl
The previous command will list all the events under the Directory Service log file. We can also limit the number of events we need to list. As an example, if we only need to list the latest 5 events from the Directory Service log file, we can use the following command:
Get-EventLog -Newest 5 -LogName 'Directory Service'
We can further filter it down by listing events according to entry type, as shown in the following example:
Get-EventLog -Newest 5 -LogName 'Directory Service' -EntryType Error
The previous command will list the first 5 errors in the Directory Service log file. We also can add a time limit to filter events further, as follows:
Get-EventLog -Newest 5 -LogName 'Directory Service' -EntryType Error –After (Get-Date).AddDays(-1)
The previous command will list the events with error type Error within the last 24 hours under the Directory Service log. We can also get the events from remote computers as follows:
Get-EventLog -Newest 5 -LogName 'Directory Service' -ComputerName 'REBEL-SRV01' | fl -Property *
The previous command will list the first 5 log entries in the Directory Service log file from the REBEL-SRV01 remote server.
We can also extract events from several computers simultaneously, as follows:
Get-EventLog -Newest 5 -LogName 'Directory Service' -ComputerName "localhost","REBEL-SRV01"
The previous command will list the log entries from the local computer and the REBEL-SRV01 remote computer. When it comes to filtering, we can further filter events using the event source, as follows:
Get-EventLog -LogName 'Directory Service' -Source "NTDS KCC"
The previous command will list the events with the source NTDS KCC. It also allows us to search for the specific event IDs, as shown in the following example:
Get-EventLog -LogName 'Directory Service' | where {$_.eventID -eq 1000}
The previous command will list the events with eventID as 1000.
There is a recommended list of events that we need to audit periodically to identify potential issues in an AD environment. The complete list is available for review at https://bit.ly/3nKlQK4.
Microsoft Defender for Identity
In several places in this book, I have talked about why we need the Zero-Trust approach to security. Zero-Trust is not a product or service it is a mindset. We need to understand the importance of this approach and implement relevant controls where ever possible. Especially with the COVID-19 pandemic, the word "Zero-Trust" is resounding in the tech industry, and this completely makes sense due to the following reasons:
- Today, IT security is getting more and more complex. Security is no longer someone's job alone. Everyone has a role to play when it comes to IT security. We have more and more devices connecting to corporate networks and data coming from remote locations. Attacks are also getting more and more sophisticated.
- The "perimeter defense" security strategy is no longer working. We have data and applications running on on-prem as well as in the cloud. Users are connecting to these services from everywhere. We no longer can define boundaries for networks. As the attack surface expands, new attack scenarios are developed and used by attackers.
Once attackers achieve the initial breach, they don't stop there. Instead, they move laterally to the cloud or other remote networks. The Solorigate attack is a great example of this.
- Attackers have shifted their attention to identity attacks. Over the years we have seen the number of identity attacks rising. It has been the most successful method for attackers, due to assets leaving corporate networks.
Out of those concerns, if we consider "identities" specifically, we can see the complexity of enterprise identities is growing, which can create room for attackers to find success. Enterprises are moving assets to the cloud more due to the accelerated pace of digital transformation. This means that enterprise identities are starting to appear in public clouds, SaaS applications, partner systems, BYOD, and mobile devices. When complexity grows,
- It is possible for engineers to miss certain security settings, rules, or configurations. In most scenarios, these are only noticed during a pen-test or vulnerability scan.
- Threats can come from anywhere – on-prem, BYOD, applications, clouds, and so on. So, protecting all of these areas can be difficult and costly.
- Security teams can get overwhelmed by the amount of data, logs, and alerts being gathered and it is possible to miss important data.
Microsoft identified these challenges and came up with Defender for Identity, a cloud-based solution that monitors signals from on-prem AD Domain Controllers and AD FS servers to detect, identify, and investigate identity threats and malicious activities.
What is Microsoft Defender for Identity?
In the previous two editions of this book, this section was allocated to Microsoft Advanced Threat Analytics (ATA). This is an on-prem platform to help us protect our identity infrastructure from advanced targeted attacks by automatically analyzing, learning, and identifying normal and abnormal behavior (from users, devices, and resources). Microsoft also had a cloud version of it called Azure Advanced Threat Protection (Azure ATP). This cloud service has now been renamed Defender for Identity. Microsoft ATA mainstream support ended on January 12, 2021, so going forward, users only can use the cloud-based Defender for Identity service.
When we consider a typical attack kill chain, we can identify four main areas to protect:
- Applications
- Endpoints
- Identity
- Data
Microsoft offers security solutions to protect all these areas:
- Applications – Microsoft Defender for Office 365, Microsoft Cloud App Security (MCAS)
- Endpoints – Microsoft Defender for Endpoints
- Identity – Microsoft Defender for Identity, MCAS
- Data – Microsoft Defender for Office 365, MCAS
Microsoft has grouped these four products – Microsoft Defender for Office 365, Microsoft Defender for Endpoints, Microsoft Defender for Identity, and MCAS – and created a unified pre- and post-breach enterprise defense suite called Microsoft 365 Defender, which can provide integrated protection for all four areas. So, Microsoft Defender for Identity is one pillar of a far greater solution. If you want to achieve unified protection in stages, it is recommended to start with identity protection first and then move to other products in the suite, as identity is the key to everything.
Defender for Identity benefits
Defender for Identity has the following key capabilities that help to streamline SecOps operations:
- Proactive – Detect vulnerabilities proactively and prevent attacks before they happen.
- Efficient – Automatic analysis and automatic response help SecOps teams to allocate their time to investigating critical issues.
- Prioritize – By reducing false positives, Defender for Identity helps SecOps teams to prioritize spending their time on dealing with the real issues.
When it comes to identity protection, Microsoft Defender for Identity focuses on four main deliverables.
Prevent
Defender for Identity helps SecOps teams to identify hidden vulnerabilities in their environments. These are present mostly due to misconfiguration of services/products and a lack of system updates.
The Defender for Identity security posture assessment can detect vulnerabilities such as:
- Exposing credentials in clear text
- Legacy protocols in use
- Unsecure Kerberos delegation
- Dormant accounts in sensitive groups
- Weak cipher usage
- Print spooler service in domain controllers
- Not managing local administrator accounts centrally (Microsoft LAPS)
- Lateral movement paths
- Unmonitored domain controllers
- Unsecure account attributes
- Unsecure SID history attributes
Defender for Identity not only detects these issues, but also advises what should be done to fix these issues. Defender for Identity's reports show how many times these issues have been reported, their impact levels, and their resolution statuses. This rich information helps SecOps teams to improve their secure posture and prevent attacks proactively.
Detect
In the Zero-Trust security approach, we need to assume a breach. We can't close all the doors. But more importantly, if there is breach, we need a way to "detect" it quickly so we can prevent further damage and also use that information to further improve our security. Microsoft Defender for Identity can detect identity attacks faster due to its analysis of rich information from a variety of data sources:
- Network traffic analytics – Defender for Identity analyzes network traffic passing through domain controllers in real time. It can inspect traffic from protocols including NTLM, LDAP, DNS, SMB, and RPC.
- AD security events and AD Data – One of the requirements during Defender for Identity deployment is to enable advanced auditing for domain controllers. This allows Defender for Identity to collect sensitive security events, which helps to detect potential attacks. It also profiles AD data for users, groups, and resources.
- User behavior analytics – Defender for Identity analyzes user behavior to identify what is anomalous.
- Cloud-based detection – Defender for Identity uses the cloud to enrich the data collected with additional information (such as IP details). This helps to detect attacks in real time.
- AD FS support – Defender for Identity now supports running identity sensors in AD FS servers and collecting information to detect attacks such as Nobelium.
A typical identity attack has different stages. First of all, the attacker needs to uncover details about the environment they are attacking. We call this the reconnaissance stage of the attack. Defender for Identity can detect the following types of reconnaissance events:
- LDAP enumeration
- Group membership enumeration
- Users and IP enumeration
- DNS enumeration
- Suspicious resource-access activities
- Reconnaissance by targeted entity attributes
After reconnaissance, the attacker's next step is to gain some sort of access to the system. The attacker can use many different methods for this. Defender for Identity can detect the following types of credential access events:
- Brute force attacks (AD DS and AD FS)
- Login/failed suspicious activities
- Suspicious DC password change suing NetLogon
- Suspicious Kerberos SPN exposure
- Honeytoken account activities
- Suspicious VPN activities
If an attacker successfully achieves an initial breach, the next step will be to move laterally within the infrastructure and try to gain more privileges. Most of the time, the initial breach is a typical end user account. To do significant damage, attackers will need higher privileges, so they will continue compromising systems until they have access to the keys of the kingdom, Enterprise/Domain Admin accounts. Defender for Identity can detect the following types of events, helping to identify lateral movement attempts:
- Pass-the-ticket attacks
- Pass-the-hash attacks
- NTLM relay and NTLM tampering
- Overpass-the-hash
- Suspicious certificates
- Suspicious group membership changes
- Suspicious SID history injection
If the attacker has access to privileged accounts, they can go further and compromise the remaining systems to get full control over the infrastructure. If the defender uses a hybrid setup, the attacker can try to extend their attack to cloud resources. Defender for Identity can detect the following types of events, helping to detect an attack in progress:
- Golden ticket attack
- Data exfiltration
- Code execution/service creation on DC and AD FS servers
- SMP manipulation
- Skelton key
- DNS remote code execution attempt
- Golden ticket leveraging
- Suspicious print spooler registration
It is important to know whether an attack is progressing to the stage mentioned above, as this means attacker already has access to most of the system. In such a situation, we need to act fast to minimize the impact.
Investigate
When there is a security event, SecOps teams can get overwhelmed by the number of events and alerts they are receiving. Prioritization of these events mostly depends on the skills of the engineers. Also, if a large number of alerts have been produced, it's possible for the engineers to miss some critical events.
Defender for Identity not only alerts us to security incidents, but also helps SecOps teams to prioritise their investigation efforts to make them more effective. As an example, User investigation priority score for a user account will help to shortlist the accounts for which immediate attention is required. A higher score here means more attention is required. This value is calculated based on the alerts connected to the user and any abnormal activities detected from the user account.
Some attacks involve large numbers of users. In such a situation, we can use impact ranking (from Low to High) to easily identify the users requiring immediate attention. Each attack can have multiple incidents. Defender for Identity marks each incident with a severity score (from Low to High), which also helps SecOps teams to identify which incidents to focus on first.
In addition to this, Defender for Identity also allows us to create custom detection rules to help SecOps teams focus on environment-specific security events.
We also can use Microsoft 365 Defender advanced threat hunting to query cross-domain data to investigate security events further. For that, we need to use KQL queries.
Respond
So far, we have seen how Defender for Identity can increase the efficiency of detection and prioritization of incidents. This also helps to reduce the time it takes from the initial detection of an event to its final fix.
Not only that, but when it comes to incident response, we can use Microsoft 365 Defender to automate our incident response process. For more information about automated remediation, please visit https://bit.ly/3l7kZkK.
Microsoft Defender for Identity architecture

Figure 19.19: MDI architecture
The preceding diagram explains the components involved in the Microsoft Defender for Identity setup. Let's go ahead and see the roles of each of these components:
Microsoft Defender for Identity portal – This portal allows us to configure our Defender for Identity instance. Using this portal we can download MID sensors, check the status of our MID sensors, configure honeytoken accounts, configure email settings, and so on. We also can view and investigate security incidents in the environment using the Microsoft Defender for Identity portal.
MDI sensors – Microsoft Defender for Identity collects security events, analyzes network traffic, and monitors AD entities via MDI sensors. These sensors need to be installed in each domain controller and AD FS server in the environment for best results. Defender for Identity also has standalone sensors. Instead of installing a sensor in each domain controller, we can configure a dedicated server as a sensor. We then need to configure port mirroring in our domain controllers to pass traffic through the standalone sensor. However, this standalone sensor can't collect Event Tracing for Windows (ETW) log entries, which use for multiple detection. Microsoft's recommendation is to install sensors on domain controllers and AD FS servers for best results.
Microsoft 365 Defender portal – Defender for Identity is a product in the Microsoft 365 Defender suite. It uses one portal to collect data from different products and then analyzes the data to identify attacks spread across different domains. Using this portal, SecOps teams can also do advanced threat hunting. If we need to configure automated remediation or custom detection rules, we need to use this portal to do it. The Microsoft Defender for Identity portal also forwards activity data, alerts, and metadata to the Microsoft 365 Defender portal. It is recommended to use the Microsoft 365 Defender portal for investigation as it contains rich data from different sources.
Microsoft Cloud App Security – Prior to the release of the Microsoft 365 Defender portal, the data it now handles was forwarded to Microsoft Cloud App Security, and engineers were able to do their investigations using the Cloud App Security portal.
In the next section, we are going to look into the things we need to consider before deployment of Microsoft Defender for Identity.
Microsoft Defender for Identity prerequisites
Before we deploy Microsoft Defender for Identity, it is important to check for the following prerequisites.
Licenses
Microsoft Defender for Identity requires the Enterprise Mobility + Security E5 (EMS E5/A5), Microsoft 365 E5 (M365 E5/A5/G5), or standalone licenses. These licenses can purchase through Microsoft 365 portals or via your Cloud Solution Partner (CSP).
Connectivity to the Defender for Identity cloud service
It is a common best practice to block/limit internet access to domain controllers. Unless you are using standalone sensors, all domain controllers with MDI sensors need to be able to communicate with the Defender for Identity cloud service. More info about the links and proxy configuration is available on https://bit.ly/3cM3KkB.
Service accounts
Microsoft Defender for Identity requires a service account to connect to AD. This service account must have read permissions for all objects in the domain.
Microsoft Defender for Identity supports two types of service accounts:
If the sensors' machines are running Windows Server 2012 or above, the recommended type of service account is gMSA. In Chapter 8, I explained gMSA and how we can set up this type of account. Please check Chapter 8 for more info.
If you are using an older operating system than Windows Server 2012, you will have to use a standalone service account.
Honeytoken account
During the reconnaissance or lateral movement phases of an attack, the hackers will try to access different user accounts. A honeytoken account helps MDI to detect such activities quickly. This account should be set up as a standard company account, but should never be used to log in. If any activity is detected in this honeytoken account, it will immediately be flagged by Microsoft Defender for Identity.
Firewall ports
Certain ports need to be open in your firewalls for internal and external communication by Microsoft Defender for Identity, as follows:
|
Protocol |
TCP/UDP |
Port |
To/From |
Direction |
|
SSL |
TCP |
443 |
Defender for Identity cloud services |
Outbound |
|
SSL |
TCP |
444 |
Sensor service |
Both |
|
DNS |
TCP and UDP |
53 |
Sensors to DNS Servers |
Outbound |
|
Netlogon |
TCP/UDP |
445 |
Sensors to all devices |
Outbound |
|
RADIUS |
UDP |
1813 |
RADIUS to sensors |
Inbound |
|
NTLM over RPC |
TCP |
135 |
Sensors to all devices |
Outbound |
|
NetBIOS |
UDP |
137 |
Sensors to all devices |
Outbound |
|
TLS to RDP |
TCP |
3389 |
Sensors to all devices |
Outbound |
For standalone sensors, the port requirements are different. More info about this is available at https://bit.ly/3l6MVFr.
Advanced audit policies
Defender for Identity detects 4726, 4728, 4729, 4730, 4732, 4733, 4753, 4756, 4757, 4758, 4763, 4776, 7045, and 8004 Windows event logs from domain controllers. Some of these event logs only appear if advanced audit policies are enabled in the domain controllers. I explained earlier in this chapter how we can enable advanced audit policies.
To capture the above events, we need to enable the following advanced audit policies:
- Account Logon | Audit Credential Validation
- Account Management | Audit User Account Management
- Account Management | Audit Distribution Group Management
- Account Management | Audit Computer Account Management
- Account Management | Audit Security Group Management
We need to capture Success and Failure events for all the above policies.
NTLM auditing
Windows event 8004 contains NTLM authentication data. By enabling NTLM auditing, we can allow Microsoft Defender for Identity to enrich event data by displaying the source user, source device, and accessed resource.
NTLM auditing should be enabled on domain controllers. We can enable this by using GPO settings under Computer configuration | Policies | Windows Settings | Security Settings | Local Policies | Security Options.
To collect the relevant data, we need to enable the following policy settings:
- Network Security | Restrict NTLM | Outgoing NTLM traffic to remote servers (Audit All)
- Network Security | Restrict NTLM | Audit NTLM authentication in this domain (Enable all)
- Network Security | Restrict NTLM | Audit incoming NTLM Traffic (Enable auditing for all accounts)
Once the settings are in place, MDI will display the NTLM data in Resource Access over NTLM and Failed logon events.
SAM-R Permissions
Microsoft Defender for Identity can detect lateral movement paths. To do this, MDI needs to be able to query the local administrators of any computer. This query uses the SAM-R protocol and the Microsoft Defender for Identity service account. By default, the service account can't do this query, so we need to grant the relevant permissions by using GPO. This policy setting should apply to all computers except domain controllers. To update the settings, go to Computer Configuration | Windows Settings | Security Settings | Local Policies | Security Options and add the service account to the list under the Network access – Restrict clients allowed to make remote calls to SAM policy.
Sizing tool
The Microsoft Defender for Identity sensor requires a minimum of 2 cores and 6 GB of RAM. However, this can be changed based on network traffic, server roles, and the server's current resource usage. Therefore, it is best to run the sensor sizing tool before installation. This tool will automatically analyze the current system and make recommendations for resource upgrades. To download the tool, please go to https://bit.ly/3xh7y6S.
This completes the prerequisites section for Microsoft Defender for Identity. Please note that I didn't mention much here about standalone sensors because they have limitations and are not the recommended method.
Deployment
After the prerequisites are sorted, the next phase is to set up the Microsoft Defender for Identity service and sensors. This is a very straightforward process and Microsoft has well-structured documentation for it. You can access this at https://bit.ly/30RUc4L. After deployment, I highly recommend doing the testing as specified in the documentation, so we know the service is working as expected.
Azure AD Connect Health
In the previous chapter, we learned what Azure AD Connect is and how it works in a hybrid Azure AD environment. Azure AD Connect is responsible for synchronization between Azure AD and on-prem AD. Therefore, it is important to monitor the health of the Azure AD Connect service to make sure it is running as expected. In a given computer infrastructure, only one Azure AD Connect instance can be active at a given time, so this puts more pressure on the health of the service. The Azure AD Connect service is a Windows service, so there are many tools on the market that can monitor the status of the service. But even if the service is up and running, it doesn't mean synchronization is healthy.
Azure AD Connect Health is a service that comes with Azure AD Premium to monitor the health of Azure AD Connect. Azure AD Connect Health can monitor the following types of sync errors:
- Duplicate attributes
- Data mismatches
- Data validation failures
- Large attributes
- Federated domain changes
- Existing admin role conflicts
- Other errors (those not categorized here)
Azure AD Connect Health insights are gathered via health agents.
There are three types of agents used by Azure AD Connect Health:
- Azure AD Connect (sync): This is installed as part of Azure AD Connect. This agent will gather information related to Azure AD Connect, such as service status, synchronization rules, service name, last sync time, sync errors, and alerts.
- Azure AD Connect Health Agent for Active Directory Federation Services (AD FS): This agent can gather additional data to monitor the health of Azure AD Connect in a federated environment. This agent will gather information such as the total number of requests processed by AD FS, requests based on relaying party trust, authentication methods used by requests, alerts, failed requests, and so on.
- Azure AD Connect Health Agent for Active Directory Domain Services (AD DS): This agent can gather additional data from an on-prem AD environment, which will provide additional insights to detect any underlying directory issues in a hybrid environment. This agent gathers information, such as the AD topology, forest and domain functional levels, Flexible Single Master Operation (FSMO) role holders, replication status, and number of processed authentication requests.
Prerequisites
We need to meet the following prerequisites to use Azure AD Connect Health:
- An Azure AD Premium subscription.
- Relevant Azure AD Connect Health agents installed on target computers.
- Allow outgoing TCP
443 & 5671traffic to Azure endpoints from the target servers (for a complete list of URLs, see https://bit.ly/3FK3BdP) - PowerShell 5.0 or above installed on the target computers.
- Federal Information Processing Standards (FIPS) should be disabled.
Configuration
In this section, we are going to look at Azure AD Connect Health in action. In my demonstration environment, I have the latest version of Azure AD Connect installed.
Azure AD Connect Health (sync) comes as a part of it, as shown in the following screenshot:

Figure 19.20: Azure AD Connect health services
But I'd like to install Azure AD Connect Health Agent for AD DS to gather additional insights from my on-prem AD environment. In order to do that, perform the following steps:
- Log in to the target computer as the Domain Admin/Enterprise Admin.
- Go to the Azure portal at https://portal.azure.com and log in as a global administrator.
- Then go to Azure Active Directory | Azure AD Connect and click on Azure AD Connect Health, as shown in the following screenshot:

Figure 19.21: Azure AD Connect Health access
- In the new window, click on Download Azure AD Connect Health Agent for AD DS, as shown in the following screenshot:

Figure 19.22: Download Azure AD Connect Health Agent for AD DS
- Once the download is completed, run the
ADHealthAddsAgentSetup.exeas administrator. - Complete the installation, and then sign in using the global administrator account in the login window, as shown in the following screenshot:

Figure 19.23: Azure AD login
- Let the system complete the agent registration, as shown in the following screenshot:

Figure 19.24: Azure AD Connect Health service registration
If a proxy is in place, we have to import the proxy settings from Internet Explorer by running
Set-AzureAdConnectHealthProxySettings -ImportFromInternetSettings.Once registration is completed, it can take a few hours to display the collected data.
- Once agents start reporting, we can view Azure Active Directory Connect (Sync) data under Sync errors and Sync services, as shown in the following screenshot:

Figure 19.25: Sync errors and Sync services
The landing page shows the high-level health status of Azure AD Connect:

Figure 19.26: Overview of Azure AD Connect Health
On the error pages, we can see detailed descriptions of events:

Figure 19.27: Sync errors
- Similarly, data collected from the Azure AD Connect Health Agent for AD DS can be accessed under Active Directory Domain Services, as shown in the following screenshots:

Figure 19.28: AD DS services
The landing page shows the overall health of replication:

Figure 19.29: Replication health
Azure AD Connect Health is mainly focused on monitoring the health of directory synchronization. Additional insights collected from AD FS and AD DS agents primarily help to troubleshoot directory synchronization health issues. However, healthy synchronization doesn't mean we are running a healthy Azure AD hybrid environment. This can only be ensured by monitoring identity infrastructure security threats. Microsoft has different services that can monitor identity infrastructure threats. Azure Security Center and Azure Sentinel are good examples of this. I highly recommend that you look into these solutions to further improve the overall health of your identity infrastructure.
Summary
Continuous monitoring and auditing are a must for identity infrastructures to identify potential security threats and maintain a healthy environment. There are a lot of tools and methods out there to do this, but the success of these solutions depends on the accuracy of detection, the way it presents data, and how it helps in identifying the root cause.
In this chapter, we started by looking at Windows' built-in tools and methods that can be used to monitor and audit AD environments. First, we started with GUI tools and then moved to PowerShell-based auditing. Then we looked at Microsoft Defender for Identity and how it can help to identify security threats in the infrastructure that cannot be detected using traditional tools and methods. Last but not least, we also learned how Azure AD Connect Health can help to monitor the synchronization health of the Azure AD hybrid environment.
After a long journey, we are now reaching the end of this book. In the final chapter, we will look at the most common AD-related issues and how we can fix them.