System Monitor is a tool designed to track and display performance information in real time. It gathers information on any performance parameters you've configured for monitoring and presents it using a graphical display.
System Monitor is a snap-in that's added to the Performance Monitor utility. You can start Performance Monitor by clicking Start, selecting Programs or All Programs, Administrative Tools, and then Performance, or you can type perfmon at the command line.
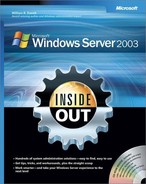
When you start Performance Monitor, the System Monitor node is selected by default, as shown in Figure 16-1, and the right pane graphs any performance items you've configured for monitoring. Each performance item you want to monitor is defined by the following three components:

Performance objects Represent any system component that has a set of measurable properties. A performance object can be a physical part of the operating system, such as the memory, the processor, or the paging file; a logical component, such as a logical disk or print queue; or a software element, such as a process or a thread.
Object instances Represent single occurrences of performance objects. If a particular object has multiple instances, such as when a computer has multiple processors, you can use an object instance to track a specific occurrence of that object. You could also elect to track all instances of an object, such as whether you want to monitor all processors on a system.
Performance counters Represent measurable properties of performance objects. For example, with a processor, you can measure the percentage of processor utilization using the %Processor Time counter.
In a standard installation of Windows Server 2003, many performance objects are available for monitoring. As you add services, applications, and components, additional performance objects can become available. For example, when you install the Domain Name System (DNS), the DNS object becomes available for monitoring on that computer.
The most common performance objects you'll want to monitor are summarized in Table 16-1. Like all performance objects, each performance object listed here has a set of counters that can be tracked.
Table 16-1. Commonly Tracked Performance Objects
Performance Object | Description |
|---|---|
Browser | Monitors the Browser service for a domain or workgroup |
Cache | Monitors disk cache usage |
LogicalDisk | Monitors the logical volumes on a computer |
Memory | Monitors memory performance for system cache (including pooled paged and pooled nonpaged memory), physical memory, and virtual memory |
Network Interface | Monitors the network adapters configured on the computer |
NTDS | Monitors the Active Directory directory service |
Objects | Monitors the number of events, mutexes, processes, sections, semaphores, and threads on the computer |
Paging File | Monitors page file current and peak usage |
PhysicalDisk | Monitors hard disk read/write activity as well as data transfers, hard faults, and soft faults |
Print Queue | Monitors print jobs, spooling, and print queue activity |
Process | Monitors all processes running on a computer |
Processor | Monitors processor idle time, idle states, usage, deferred procedure calls, and interrupts |
Server | Monitors current server activity and important server usage statistics, including logon errors, access errors, and sessions |
Server Work Queues | Monitors server threading and client requests |
System | Monitors system-level counters, including processes, threads, context switching of threads, file system control operations, system calls, and system uptime |
Thread | Monitors all running threads and allows you to examine usage statistics for individual threads by process ID |
The most commonly tracked performance objects are Memory, PhysicalDisk, and Processor. This is why when you first start Performance Monitor, System Monitor is configured to graph basic counters for these objects. Many other performance counters are available for tracking. To track additional counters, you use the Add Counters dialog box, as shown in Figure 16-2. After you access System Monitor, you display this dialog box by pressing Ctrl+I or rightclicking the graph in the details pane and selecting Add Counters.

Adding counters to track is easy. Select the type of object you want to work with, such as Memory, and then choose the counters for that object that you want to track. To add all counters for the object, click All Counters, and then click Add. To choose the individual counters to add, click Select Counters From List, and then select the counters to add. Use Ctrl+Click or Shift+Click to select multiple counters, and then click Add. Or select one counter at a time and then click Add. Any counters you've added will be displayed in System Monitor. You can then repeat this process, as necessary, to add counters for other performance objects. Click Close when you're finished adding counters.
Inside Out: Selecting counters when objects have multiple instances

If you select an object that has multiple instances, you'll be able to select counters for a specific instance or all instances of that object. Choose All Instances to monitor the counter for all instances of the object. Choose Select Instances From List to monitor the counter for specific instances of the object. You can use Ctrl+Click or Shift+Click to select multiple instances. Then click Add to track the counter for the specified instances.
As you've seen, it's easy to add counters to track. What isn't so easy is determining which counters you should track. While you are working with the Add Counters dialog box, you can get a detailed explanation of a counter by selecting a counter and then clicking Explain. If you add too many counters or track the wrong counters, don't worry. In the System Monitor view, you can delete counters later by clicking their entry in the lower portion of the details pane and then clicking Delete. You can also delete all counters being tracked and start over with a clean graph by pressing Ctrl+E or clicking New Counter Set.
System Monitor displays each counter that you are tracking in a different color and line thickness. You can use the legend in the lower portion of the details pane to help you determine which counter is being graphed where. If you are unsure, double-click a line in the graph to select the corresponding counter in the legend list. To highlight a specific counter so that it is easy to pick out in the graph, select the counter in the legend list, and then press Ctrl+H.
System Monitor can present counter statistics in several different ways. By default, it graphs the statistics. A graph is useful when you are tracking a limited number of counters because you can view historical data for each counter that you are working with. By default, System Monitor samples the counters once every second and updates the graph. This means at any given time there can be up to 100 seconds worth of data on the graph. If you increase the sample interval, you can get more information into the chart. For example, if you set the sample interval to once every 10 seconds, you can get up to 1,000 seconds (or about 17 minutes) worth of data on the graph.
You can set the sample interval by using the General tab of the System Monitor Properties dialog box, as shown in Figure 16-3. To display this dialog box, press Ctrl+Q or click Properties. Then set the sample interval using the Sample Automatically Every x Seconds option.

The options on the Display Elements panel control the availability of the Legend, Value Bar, and Toolbar. The Legend is displayed at the bottom of the details pane, and it shows the color and line style that are used for each counter. The Value Bar is displayed between the graph and the legend. It shows values related to the counter you've selected in the graph or in the legend. The Toolbar is displayed above the graph and provides the basic toolbar functions for working with System Monitor. You might find that it is much easier to use the shortcut keys than to click the Toolbar buttons. The Toolbar buttons and their shortcut keys are as follows:
New Counter Set Ctrl+E; deletes all counters being tracked so you can use a different counter set.
Clear Display Ctrl+D; clears the display so that you can start with a clean display.
View Current Activity Ctrl+T; switches the view so that current activity being logged is displayed.
View Log Data Ctrl+L; switches the view so that data from a performance log can be replayed.
View Histogram Ctrl+B; switches the view to represent the performance information using a bar graph.
View Report Ctrl+R; switches the view to display the report list format.
View Graph Ctrl+G; switches the view to display the graph format.
Add Ctrl+I; displays the Add Counter dialog box, which lets you add counters to track.
Delete Delete key; removes the counter so that it is no longer tracked.
Highlight Ctrl+H; highlights the counter using a white line so that it is more easy to see. Highlighting works best with graphs. If you want to turn the Highlight function off, press Ctrl+H again.
Copy Properties Ctrl+C; creates a copy of the counter list along with the individual configuration of each counter and puts it on the Windows Clipboard. The information is formatted as an Extensible Markup Language (XML) file. If you open a text editor, you could paste in this information and save it for later use.
Paste Counter List Ctrl+V; pastes a copied counter list into System Monitor so that it is used as the current counter set. If you saved a counter list to a file, you simply open the file, copy the contents of the file to the Clipboard, and then press Ctrl+V in System Monitor to use that counter list.
Tip
Save the counter list or use it on different computers
You can use the copy and paste features to track the same set of counters quickly and easily at a later date or to use the set on other computers. Press Ctrl+C to copy the counter list and save it to a file. Then you or someone else could access the counter list when you want to use the same setup again. You could also paste the counter list into an e-mail message so that it could be sent to someone who wants to use the same counter list.
Properties Ctrl+Q; displays the System Monitor Properties dialog box.
Freeze Display Ctrl+F; freezes the display so that System Monitor no longer updates the performance information. Press Ctrl+F a second time to resume sampling.
Update Data Ctrl+U; updates the display by one sampling interval. When you freeze the display, System Monitor still gathers performance information; it just doesn't update the display using the new information. If you want to update the display while it is frozen, use this option.
Help F1; displays the System Monitor Help information.
The histogram and report views deserve a bit of additional discussion. In the histogram view, System Monitor represents the performance information by using a bar graph with the last sampling value for each counter displayed on an individual bar within the graph. The sizes of the bars within the graph are adjusted automatically based on the number of performance counters being tracked and can be adjusted to accommodate hundreds of counters. That is, in fact, the biggest advantage of the histogram—it allows you to track a lot of counters more easily. In the screen on the following page, approximately 100 counters are being tracked, and it is easy to pick out which counter is which.

In the report view, as shown in the following screen, System Monitor represents the performance information by using a report list format. In this view, objects and their counters are listed in alphabetical order. The performance information is displayed numerically rather than graphed. If you are trying to determine specific performance values for many different counters, this is the best view to use because the actual values are always shown.

Monitoring performance on the computer for which you are trying to establish a baseline can skew the results. The reason for this is that Performance Monitor uses resources when it is running, particularly when you are graphing performance information, taking frequent samples, or tracking many performance counters. To remove the resource burden (or at least most of it), you should consider monitoring performance remotely. Here, you use one computer to monitor the performance of another computer. Although this does generate some extra network traffic, you'll get more accurate results for the monitored computer because you're not using its resources for monitoring.
Note
By default, only administrators can monitor performance remotely. Like remote access to the Registry, remote access for monitoring is controlled by the Registry key HKLM SYSTEMCurrentControlSetControlSecurePipeServersWinreg. If you want to limit remote access to the Registry, you can start by changing the permissions on this key. For more information, see the section entitled "Controlling Remote Registry Access".
Tip
Configure remote monitoring
You can use any computer running Microsoft Windows 2000 or later to perform remote monitoring, and that computer can monitor any computer running Windows 2000 or later. The only exceptions are for Microsoft Windows Millennium Edition (Windows Me) and Windows XP Home Edition. The computer you are using for monitoring can even monitor multiple computers. Don't, however, use a Remote Desktop Connection to connect to the computer you want to monitor and then start monitoring. Even though you are viewing from a different computer, the monitoring is still being performed on the computer to which you are connected.
To begin remote monitoring, start Performance Monitor, press Ctrl+E to start with a new counter set and clear out any existing counters, then press Ctrl+A to display the Add Counters dialog box. In the Add Counters dialog box, choose Select Counters From Computer, and then type the Universal Naming Code (UNC) name or Internet Protocol (IP) address of the computer you want to monitor remotely. A UNC computer name or IP address begins with two back slashes (\). So, for instance, you could type \CorpServer03 or \192.168.1.56.
After you type the UNC computer name or IP address, press Tab or click the Performance Object list. When you do this, Performance Monitor will attempt to connect to the remote computer and retrieve a list of available performance objects to monitor. You can then choose performance objects and counters to track just as you would for a local computer.
Troubleshooting: Try the IP address if you can't connect
Performance Monitor should be able to find any computer in any trusted domain of your organization's forest. Sometimes, however, it isn't able to do this and returns an error. If this happens, ensure you entered the correct computer name. If you did and you still get an error, try entering the UNC path with the computer's IP address. Using an IP address saves Performance Monitor from having to perform a DNS lookup to resolve the computer's name to its IP address.
Tip
Compare performance of multiple systems
The Legend area shows the associated UNC computer name or IP address for each performance counter you are tracking. If you want to see how performance compares on different computers, use your monitoring computer to track the same performance counters on these computers. You can then make direct comparisons of how these computers perform relative to each other.