- Microsoft® Windows Server™ 2003 Inside Out
- SPECIAL OFFER: Upgrade this ebook with O’Reilly
- A Note Regarding Supplemental Files
- Acknowledgments
- We'd Like to Hear from You!
- About the CD
- Conventions and Features Used in this Book
- About the Author
- 1. Windows Server 2003 Overview and Planning
- 1. Introducing Windows Server 2003
- What's New in Windows Server 2003
- 64-Bit Computing
- .NET Technologies
- Windows XP and Windows Server 2003
- Windows XP Editions
- Increased Support for Standards
- Interface and Tool Improvements
- Active Directory Improvements
- Domains Can Be Renamed
- Active Directory Can Replicate Selectively
- Active Directory–Integrated DNS Zones Can Forward Conditionally
- Active Directory Schema Objects Can Be Deleted
- Active Directory and Global Catalog Are Optimized
- Active Directory Can Compress and Route Selectively
- Forest-to-Forest Trusts
- Active Directory Migration Made Easier
- Group Policy Improvements
- Management and Administration Extras
- Security Advances
- Reliability and Maintenance Enhancements
- 2. Planning for Windows Server 2003
- Overview of Planning
- Identifying Your Organizational Teams
- Assessing Project Goals
- Analyzing the Existing Network
- Defining Objectives and Scope
- Defining the New Network Environment
- Selecting a Software Licensing Program
- Final Considerations for Planning and Deployment
- 1. Introducing Windows Server 2003
- 2. Windows Server 2003 Installation
- 3. Preparing for the Installation and Getting Started
- 4. Managing Interactive Installations
- 5. Managing Unattended Installations
- 6. Using Remote Installation Services
- Introduction to RIS
- Installing RIS
- Configuring RIS Clients
- Preparing RIS-Based Installations
- Using RIS for Automated Installations
- Working with Sysprep
- 3. Windows Server 2003 Upgrades and Migrations
- 7. Preparing for Upgrades and Migration
- 8. Upgrading to Windows Server 2003
- General Considerations for Upgrades
- Upgrading from Windows 2000
- Upgrading from Windows NT 4
- 9. Migrating to Windows Server 2003
- Selecting the Migration Tools
- ADMT
- General Considerations for Migrations
- Determining the Approach to Migration
- Preparing for Migration
- Migrating Security Principals
- Performing the Migration: An Overview
- Migrating Group Accounts
- Migrating User Accounts
- Migrating Passwords
- Migrating the Computers
- Merging Groups during Migration
- Migrating Domain Trusts
- Migrating Service Accounts
- Security Translation
- Generating Migration Reports
- 4. Managing Windows Server 2003 Systems
- 10. Configuring Windows Server 2003
- 11. Windows Server 2003 MMC Administration
- 12. Managing Windows Server 2003
- Using the Administration Tools
- Using the Control Panel Utilities
- Using the Add Hardware Utility
- Using the Add or Remove Programs Utility
- Using the Date and Time Utility
- Using the Display Utility
- Using the Folder Options Utility
- Using the Licensing Utility
- Using the Network Connections Utility
- Using the Regional and Language Options Utility
- Using the Scheduled Tasks Utility
- Using the System Utility
- Using Support Tools
- Using Resource Kit Tools
- Using the Secondary Logon
- 13. Managing and Troubleshooting Hardware
- 14. Managing the Registry
- 15. Performance Monitoring and Tuning
- 16. Comprehensive Performance Analysis and Logging
- 5. Managing Windows Server 2003 Storage and File Systems
- 17. Planning for High Availability
- 18. Preparing and Deploying Server Clusters
- 19. Storage Management
- Essential Storage Technologies
- Configuring Storage
- Managing MBR Disk Partitions on Basic Disks
- Managing GPT Disk Partitions on Basic Disks
- Managing Volumes on Dynamic Disks
- Creating a Simple or Spanned Volume
- Extending a Simple or Spanned Volume
- Recovering a Failed Simple or Spanned Disk
- Moving Dynamic Disks
- Configuring RAID 1: Disk Mirroring
- Mirroring Boot and System Volumes
- Configuring RAID 5: Disk Striping with Parity
- Breaking or Removing a Mirrored Set
- Resolving Problems with Mirrored Sets
- Repairing a Mirrored System Volume to Enable Boot
- Resolving Problems with RAID-5 Sets
- 20. Managing Windows Server 2003 File Systems
- 21. File Sharing and Security
- File Sharing Essentials
- Creating and Publishing Shared Folders
- Managing Share Permissions
- Managing File and Folder Permissions
- Managing File Shares After Configuration
- Sharing Files on the Web
- Auditing File and Folder Access
- 22. Using Volume Shadow Copy
- 23. Using Removable Media
- Introducing Removable Media
- Managing Media Libraries and Media
- Inserting Media into a Library
- Ejecting Media from a Library
- Mounting and Dismounting Media in Libraries
- Enabling and Disabling Media
- Enabling and Disabling Drives
- Cleaning Drives
- Working with Library Doors and Ports
- Configuring Library Inventory
- Starting Library Inventory
- Changing Library Media Types
- Enabling and Disabling Libraries
- Managing Media Pools
- Managing Work Queues, Requests, and Security
- Using the Work Queue
- Troubleshooting Waiting Operations
- Changing Mount Operations
- Controlling When Operations Are Deleted
- Using the Operator Requests Queue
- Notifying Operators of Requests
- Completing or Refusing Requests
- Controlling When Requests Are Deleted
- Setting Access Permissions for Removable Storage
- 6. Managing Windows Server 2003 Networking and Print Services
- 24. Managing TCP/IP Networking
- Understanding IP Addressing
- Special IP Addressing Rules
- Using Subnets and Subnet Masks
- Getting and Using IP Addresses
- Understanding Name Resolution
- Configuring TCP/IP Networking
- 25. Managing DHCP
- DHCP Essentials
- DHCP Security Considerations
- Planning DHCP Implementations
- Setting Up DHCP Servers
- Configuring TCP/IP Options
- Levels of Options and Their Uses
- Options Used by Windows Clients
- Using Userand Vendor-Specific TCP/IP Options
- Settings Options for All Clients
- Settings Options for Routing and Remote Access Clients Only
- Setting Add-On Options for Directly Connected Clients
- Defining Classes to Get Different Option Sets
- Advanced DHCP Configuration and Maintenance
- Setting Up DHCP Relay Agents
- 26. Architecting DNS Infrastructure
- 27. Implementing and Managing DNS
- 28. Implementing and Maintaining WINS
- 29. Installing and Maintaining Print Services
- Understanding Windows Server 2003 Print Services
- Print Services Changes for Windows Server 2003
- Upgrading Windows NT 4 Print Servers to Windows Server 2003
- Migrating Print Servers from One System to Another
- Planning for Printer Deployments and Consolidation
- Setting Up Printers
- Managing Printer Permissions
- Managing Print Server Properties
- Managing Printer Properties
- Setting General Properties, Printing Preferences, and Document Defaults
- Setting Overlays and Watermarks for Documents
- Installing and Updating Print Drivers on Clients
- Configuring Printer Sharing and Publishing
- Optimizing Printing Through Queues and Pooling
- Configuring Print Spooling
- Viewing the Print Processor and Default Data Type
- Configuring Separator Pages
- Configuring Color Profiles
- Managing Print Jobs
- Printer Maintenance and Troubleshooting
- 30. Using Remote Desktop for Administration
- 31. Deploying Terminal Services
- Using Terminal Services
- Designing the Terminal Services Infrastructure
- Setting Up Terminal Services
- Using the Terminal Services Configuration Tool
- Using the Terminal Services Manager
- Managing Terminal Services from the Command Line
- Other Useful Terminal Services Commands
- Configuring Terminal Services Per-User Settings
- 24. Managing TCP/IP Networking
- 7. Managing Active Directory and Security
- 32. Active Directory Architecture
- 33. Designing and Managing the Domain Environment
- Design Considerations for Active Directory Replication
- Design Considerations for Active Directory Search and Global Catalogs
- Design Considerations for Compatibility
- Design Considerations for Active Directory Authentication and Trusts
- Universal Groups and Authentication
- NTLM and Kerberos Authentication
- Authentication and Trusts Across Domain Boundaries
- Authentication and Trusts Across Forest Boundaries
- Examining Domain and Forest Trusts
- Establishing External, Shortcut, Realm, and Cross-Forest Trusts
- Verifying and Troubleshooting Trusts
- Delegating Authentication
- Design Considerations for Active Directory Operations Masters
- Operations Master Roles
- Using, Locating, and Transferring the Schema Master Role
- Using, Locating, and Transferring the Domain Naming Master Role
- Using, Locating, and Transferring the Relative ID Master Role
- Using, Locating, and Transferring the PDC Emulator Role
- Using, Locating, and Transferring the Infrastructure Master Role
- 34. Organizing Active Directory
- 35. Configuring Active Directory Sites and Replication
- 36. Implementing Active Directory
- Preinstallation Considerations for Active Directory
- Installing Active Directory
- Uninstalling Active Directory
- Creating and Managing Organizational Units (OUs)
- Delegating Administration of Domains and OUs
- 37. Managing Users, Groups, and Computers
- Managing Domain User Accounts
- Managing User Profiles
- Managing User Data
- Maintaining User Accounts
- Managing Groups
- Managing Computer Accounts
- 38. Managing Group Policy
- Understanding Group Policy
- Implementing Group Policy
- Working with Local Group Policy
- Working with the Group Policy Object Editor
- Working with the Group Policy Management Console
- Installing and Running the Group Policy Management Console
- Using the Group Policy Management Console
- Accessing Forests, Domains, and Sites in Group Policy Management Console
- Creating and Linking a New GPO in Group Policy Management Console
- Editing an Existing GPO in the Group Policy Management Console
- Linking to an Existing GPO in the Group Policy Management Console
- Deleting an Existing GPO in the Group Policy Management Console
- Managing Group Policy Inheritance and Processing
- Using Scripts in Group Policy
- Applying Group Policy Through Security Templates
- Maintaining and Troubleshooting Group Policy
- 39. Active Directory Site Administration
- 8. Windows Server 2003 Disaster Planning and Recovery
- Index to Troubleshooting Topics
- Index
- SPECIAL OFFER: Upgrade this ebook with O’Reilly
You can use performance alerts to notify you and others when certain events occur or when certain performance thresholds are reached. You can also use performance alerts to generate events that are logged in the Application event log and to start applications and performance logs.
After you select the Alerts node in the left pane of Performance Monitor, you should see a list of current alerts (if any) in the right pane. A green log symbol next to an alert, as shown in the following screen, indicates it is active. A red log symbol indicates the alert is inactive and won't be triggered even if the performance alert condition is reached.

You can manage an existing alert by right-clicking its entry in the right pane and then selecting one of the available shortcut options. Choose Delete to delete the alert. Choose Properties to display the alert's Properties dialog box. Choose Start to activate the alert. Choose Stop to stop the alert. Choose Save Settings As to save the alert configuration as a Web page that can be viewed in a browser, such as Internet Explorer, or imported into a new alert by using the New Alert Settings From option.
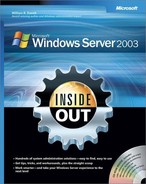
You can create a new alert by right-clicking in the right pane and selecting New Alert Settings from the shortcut menu. A New Alert Settings dialog box is displayed asking you to name the new alert. Type a descriptive name here before continuing, and then click OK. A Properties dialog box similar to the one in Figure 16-11 is displayed.

Figure 16-11. Create a new alert by adding counters and setting the alert conditions for those counters
Click Add to display the Add Counters dialog box, then add the counters for which you want to define alert conditions. When you are finished, click Close to return to the Properties dialog box of the alert. In the Counters panel, select the first counter, and then use the Alert When Value Is box to specify when an alert for this counter is triggered. Alerts can be triggered when the counter is over or under a specific value. Select Over or Under, and then set the trigger value. The unit of measurement is whatever makes sense for the currently selected counter(s). For example, to alert if the available megabytes of memory is less than 50, you would select Under and then type 50. Repeat this process to configure other counters you've selected.
In the Sample Data Every box, type in a sample interval, and select a time unit in seconds, minutes, hours, or days. The sample interval specifies how frequently the alert condition is checked for. By default, each counter will be sampled once every 5 seconds. Because you don't want to overburden the system by checking alert conditions, you should set a sampling interval that makes the most sense given the counters you are tracking and the load on the system.
In the Run As box, type the name of the account under which the counter log will run, and then click Set Password. After you type the password for the account and then confirm the password, click OK to close the Set Password dialog box. To run alert logging under the default account, Network Service, type <Default>.
Next, select the Action tab, as shown in Figure 16-12. You can now specify any of the following actions to happen when an alert is triggered:

The Log An Entry In The Application Event Log option creates entries in the Application log for alerts.
The Send A Network Message To option sends a network message to the computer specified.
The Start Performance Data Log option sets a counter log to start when an alert occurs.
The Run This Program option sets the complete file path of a program or batch file script to run when the alert occurs.
When you've set the actions to use, click the Schedule tab, and then specify when alerting should start and stop. You can configure the alerting to start manually or automatically at a specific date. Select the appropriate option, and then specify a start date if necessary.
Once alerting is started, it will continue until you manually shut it off. Unlike performance logs, for which you usually want a specific stop date, you will usually want performance alerts to keep running. That way, you can be sure you will be alerted if a performance condition is met. Click OK when you are finished setting the alerting schedule and the new alert will be added to the Alerts list. The alert's icon will be red until alerting starts.
-
No Comment