
5
Nanosensors
C.C. Bueno*
P.S. Garcia*
C. Steffens**
D.K. Deda*
Abstract
Nanosensors are fundamental for the development and progress of research in nanotechnology. These devices have been receiving increasing attention because of the need for detecting and measuring, at the molecular level, chemical and physical properties of toxins, pollutants, and analytes in general. In this chapter, general concepts related to nanosensors as well as concepts related to atomic force microscopy (AFM) and atomic force spectroscopy (AFS) regarding the development of nanosensors and nanobiosensors will be introduced. Nanosensors employing AFM tips and (micro)cantilevers will be addressed with emphasis on theoretical concepts, their advantages and disadvantages, and main applications.
Keywords
nanotechnology
nanobiosensors
atomic force microscopy
atomic force spectroscopy
chemical force microscopy
force curves
functionalization
Hertz theory
Derjaguin–Muller–Toporov (DMT)
Johnson–Kendall–Roberts (JKR)
5.1. Introduction
One of the main attractions of nanomaterial engineering in the context of sensing is the great sensitivity and selectivity/specificity potential it can offer in addition to the possibility of detecting multiple analytes and controlling their presence in real time [1] and in situ [2]. Such characteristics are obtained at the nanoscale because of the large number of sites available for molecular interactions originating from the high area/surface ratio of nanomaterials [3]. For these reasons, nanostructured sensors have been gaining more marketing attention because of the need to detect and measure chemical and physical properties and properties of complex biological and industrial systems [4].
According to Business Communications Company Inc. (BCCI), the tips and (micro)cantilevers used in atomic force microscopy (AFM) and scanning probe microscopy (SPM) currently represent the largest market share in the nanosensors market [3]. The next largest market share are the interdigitated sensors, lab-on-a-chip, because of their wide use in sensing applications in various areas such as industrial, medical, and environmental. Thus, this chapter will focus mainly on the discussion of aspects related to nanosensors with AFM (micro)cantilevers and tips in addition to introducing some concepts related to other types of nanosensors that are currently being researched.
5.2. Sensors and Nanosensors: New Detection Tools
The technologies related to sensors and nanosensors are at the forefront of analytical instrumentation research [2]; to better understand this technology, one must realize that a sensor receives the prefix nano if one or more of its spatial properties are in the scale between 10 and 100 nm. Therefore, nanosensors can be defined as any sensitive material used to transmit chemical, physical, or biological information about nanomaterials and molecules from recognition events. They can also be defined as molecular devices for analyses that incorporate a recognition element associated with a transduction system that allows the processing of the signal produced by the interaction between the sensing element and the analyte [5]. Therefore, these sensors can detect physical, chemical, biological, and quantum phenomena at the nanoscale.
Nanosensors can be classified according to four main criteria: (1) type of interaction established between the sensing element and the analyte; (2) method used to detect this interaction; (3) nature of the recognition element (e.g., biological or inorganic); and (4) transduction system. Therefore, there are different types of nanosensors that are defined and categorized by their different detection targets, their constituent materials, and the signals they use to transmit information, as shown in Fig. 5.1.

Figure 5.1 Fundamental components of a nanosensor. Adapted from M. Swierczewska, et al., High-sensitivity nanosensors for biomarker detection, Chem. Soc. Rev. 41 (7) (2012) 2641–2655 [6]. With permission of The European Society for Photobiology, the European Photochemistry Association, and The Royal Society of Chemistry.
Table 5.1 shows a brief summary of the main types of nanosensors that are currently being researched, as well as their main applications.
Table 5.1
Types of Current Nanosensors and Their Main Applications
| Types of Nanosensors | Main Applications |
| Gas nanosensors | Nonspecific sensors (global selectivity), in which the variation of electrical conductivity, voltage difference, or frequency as a function of its exposure to the monitored analyte is verified. For example, electronic nose systems to monitor the degree of ripeness of fruits and vegetables for harvest, as well as for quality control of food in general [7]. They are often used for recognizing specific chemical compounds in a complex mixture of fumes [8–12]. They may also serve as a portable breathalyzer for diagnosis of diseases [13]. |
| Enzyme nanobiosensors and nanosensors | In general, based on interdigitated sensors, AFM cantilevers or tips that are chemically functionalized to bond covalently to an enzyme or antibody [14–16]. Generally, their specific interactions are reversible, which permits the continuous monitoring of samples [17]. They are tools that are very useful for the diagnosis of diseases (in situ or not) and for other analytical purposes, such as the detection of toxic analytes in complex environments, because they are highly selective and sensitive [11,18]. |
| Fluorescent nanosensors (quantum dots) | The fluorescent properties of quantum dots are applied in procedures to detect tumors and chemical changes (intracellular) inside the body and to monitor important diseases in vivo, such as hyponatremia and diabetes [19–22]. They have potential applications in the fields of catalysis [20] and in the monitoring of the environmental quality of toxic substances [23]. |
| Chemical nanosensors | Sensors with biometric sensory receptors, usually constructed with molecularly imprinted polymers (MIP). They are useful for applications in industrial processes for control and automation, to monitor specific analytes and toxic substances in biomedical, pharmaceutical, and environmental analyses, and in the area of defense and security [24–26]. |
| Electric/ionic nanosensors | Sensors with electric/ionic detection, primarily field-effect transistors (FETs), offering simple and direct measurements in real time, as well as the characteristic of being portable [27,28]. Typically, these sensors use nanowires, nanoribbons, and nanotubes to measure the change in induced resistivity of a target molecule. Sensors of this nature using carbon nanotubes exhibit weaker detection limits compared to silicon nanowires; however, they are highly sensitive to the detection of deoxyribonucleic acid (DNA). The main limitation of electric/ionic nanosensors may be related to the inability to detect molecules of interest in physiological solutions, especially in those that have elevated concentrations of sodium, because these solutions may filter electric signals, thus reducing the detection sensitivity [6]. They have advantages such as nondestructive measurements of cells, allowing the constant monitoring of these analyses of various liquids and the detection of proteins, metal ions, various chemical species, and viral particles [6,29]. Recently, these sensors have also been used in research for the biomimicry of muscles and artificial heart valves [27]. |
| Magnetic nanosensors | These are sensors that use magnetic materials and the principles of magnetism to compose sensitive sensing systems. Many types use magnetic nanoparticles (diameter 5–300 nm) or magnetic particles (diameter 300–5000 nm), usually chemically functionalized to recognize specific molecular targets [30]. There are basically three types of magnetic biosensors that use different biosensing principles, magnetic materials, and instrumentation: magnetic relaxation switches, magnetic particle relaxation sensors, and magnetoresistive sensors [30,31]. In general, magnetic nanosensors are related to the detection of analytes such as nucleotides, proteins, viruses, cancerous cells, antibodies, and bacteria [30,32,33]. They also enable several industrial applications, such as the monitoring of processes, robotics, testing of magnetic fields for machines and motors, speed detection for transmissions, and position sensors for ferromagnetic structures and in the silent motor controls in hard drives. One of the major disadvantages of these sensors in technological applications is the need to operate at relatively low temperatures. |
| Optical nanosensors/pH nanosensors/Raman and hyper-Raman nanosensors | Optical nanosensors can be defined as sensing devices for chemical products or biological events using optical signals [34,35]. The sensors known as probes encapsulated by biologically localized embedding (PEBBLE) are also in this class. These nanosensors consist of an inert matrix in which a detection component and/or an optical correlator is entrapped [34]. Fluorescence is used as a transduction method because it is highly sensitive and relatively easy to measure. Optical nanosensors present advantages such as intracellular measurements with low or no physical disturbance [34], allowing the precise determination of oxygen changes in plant cells [36] as well as optical memory devices with high data density [37]. The pH nanosensors are based on optical fluorescence, making them excellent alternatives to methods involving glass electrodes. Their applications range from marine research to toxicological tests. They have advantages such as not requiring reference elements and being immune to electrical interference [38–41]. There are also optical nanosensors based on surface enhanced Raman scattering (SERS). These nanosensors based on SERS have been used in research involving various types of cells that present strong and specific Raman spectrum signals, such as macrophages, fibroblasts, and epithelial cells, and molecules in general [42–45]. |
| Optical fiber nanosensors | Optical fiber nanosensors are noted as an alternative to electronic nanosensors. They are of passive nature, presenting immunity to electromagnetic noise and having high durability [46]. Most optical fiber nanosensors are based on the modulation of the intensity of the light produced by the substance to be detected. The detection element can be any optical fiber or an external component attached to the fiber. In any case, one of the optical properties, such as color, index of refraction, or fluorescence must be modified as a function of the substance monitored in the environment [46,47]. |
| Twin-action nanosensors | This type of nanosensor is usually based on polymers whose physical–chemical surface properties respond to two different stimuli at the same time. As an example, there are sensors that can identify metal ions and their temperature via colorimetric response [48]. They have the advantage that their synthesis process is cheaper, compared to the synthesis of nanoparticles and quantum dots, in addition to the fact that they are extremely sensitive to external stimuli. |
| Graphene nanosensors/injectable | These are sensors of active or passive approach that usually transmit sensing data by wireless systems or by smartphone apps via fluorescence. The graphene is imprinted in tissue soluble in water (as adhesives) to be compatible with biological tissue, thus being able to offer an in situ monitoring of the level of bacterial infection and contamination [49]. Injectable nanosensors, in contrast, are more often used in the in situ monitoring of diseases such as diabetes and arterial hypertension. With them, it is possible to constantly measure glucose [50] and sodium [51] levels in blood, for example. Injectable nanosensors are similar to a tattoo and are implanted in patients in a minimally invasive form. These sensors have advantages such as being highly sensitive and allowing medical monitoring, even at a distance, thus ensuring the quality of life of the patient. |
The development of high performance sensors, such as AFM tip and cantilever sensors, and others cited in Table 5.1 make use of nanofabrication technologies to maximize the advantages offered by miniaturized devices, to integrate the low cost and efficiency of these systems [52]. These structures are being researched for the purpose of finding innovative tools that can be applied in various areas including medical diagnosis, for example, disease markers, antibodies, deoxyribonucleic acid sequencing, DNA, hormones, and antibiotics; monitoring of gases in general; biochemical assays and investigating biomolecular interactions (drug carriers, antigen–antibodies, nucleic acids, enzyme assays, and proteins); environmental monitoring (atmosphere pollutants); agribusiness (pesticides, pheromones, and heavy metal ions); quality control of food (microorganism detection, water quality, and fruit ripening); and safety (drugs and explosives), among others [15,53–55].
5.3. Atomic Force Spectroscopy (Force Curve)
Atomic force microscopy, in addition to being useful for imaging various surfaces and in supplying information about their mechanical properties [56] (a topic previously discussed in Volume 1 of the Nanoscience and Nanotechnology collection, in the chapter titled “Low-Dimensional Systems: Nanoparticles”), can also be used as a tool for specific recognition at the nanoscale. The same device used for surface scan analysis in AFM, the cantilever with a tip (Fig. 5.2), can be used for point measurements for the interaction and specific recognition of several analytes. Sensors based on this device are called AFM tip or probe nanosensors. They are based on the interaction response between the tip of the cantilever and a specific substrate, or even between molecules attached to their surfaces, as a function of the relative distance between them. Data from this recognition are supplied by force curves versus distance, or simply by force curves, that consist of data describing the vertical position of the tip and of the deflection of the cantilever, registered and converted into numerical information that is then translated into curves by the microscopy software. The force curves result from a technique known as atomic force spectroscopy (AFS), a dynamic and analytic technique that allows the study of the chemical and physical bonds between molecules of interest [14]. By means of AFS, it is possible to obtain data regarding the behavior of molecules present on surfaces and being subjected to elongation and torsion forces, as well as their response to indentation [14,57].

Figure 5.2 Device used for AFM measurements and nanoscale sensing (tip) composed of a cantilever and tip.
Through these principles, AFM tips can be used as sensing elements and in this context are referred to as AFM tip nanosensors. These sensors can detect both inorganic and organic analytes and can be constructed by means of chemical functionalization (chemical modification of the surface) of the AFM tips with biological elements (biomolecules) [58] or biomimetics [5], constituting nanobiosensors.
5.3.1. Theoretical Considerations Regarding Force Curves
The optimization of nanosensor recognition, as well as their construction, requires a thorough understanding of the components and variables that constitute the specific recognition system at the nanoscale as well as the theoretical principles involved. Understanding AFS principles and how functionalization affects specific interaction events of a nanosensor is of fundamental importance for the development of a recognition system with high sensitivity, selectivity, and reproducibility. Therefore, important considerations for a better understanding of the principle of operation of these nanosensors will be introduced next.
5.3.1.1.. Basic AFS Principles
AFS is one of the most promising tools for obtaining information from (bio)recognition processes with molecular resolution. For biological studies, the force curve allows measurements of the specific interactions between molecules in physiological conditions, as well as the capacity to supply detailed information about the kinetics and the thermodynamics of a pair of interacting molecules [59]. Force curves can also complement traditional biochemical approaches, offering the possibility of elucidating nonconventional aspects related to specific recognition processes, conformational changes, and heterogeneity of the molecular population of a sample [60]. Due to these capabilities, this technique is particularly useful for investigating biological systems.
In Chapter 5 (Low-Dimensional Systems: Nanoparticles) of Book 1 from this collection, in the Biosensors section, the authors emphasize molecular recognition as the fundamental point of biosensors because of the possibility of promoting high selectivity and specificity when performing these molecular interactions. Cited examples include antigen–antibody interactions (immunosensors) and ligand–receptor interactions, which exhibit all of the requirements to be well performed with AFS technique.
In addition, the force curve is a high resolution tool based on force measurements [60]. In this technique, the tip of the cantilever is moved only in the vertical direction, z, (perpendicular to the sample plane) downward, until it is in contact with the surface of the sample. Once the interaction is detected, the tip is forced to release the sample (upward movement) until it returns to its initial position. This induced movement is reflected in the force curves and is a function of piezoelectric displacement (Fig. 5.3). From these curves it is possible to investigate how biomolecules interact, how ligand–receptor complexes are formed, and how the molecules are oriented both on the tip and on the substrate; therefore, a configuration favorable for specific recognition is used [15,61,62]. Furthermore, other information such as the length of the bonds (decoupling length) [61], the tendency and behavior of the decoupling process of the molecules, and whether the bonding process is reversible or not can also be obtained. These investigations can mimic what occurs in biological systems, opening wide horizons for applications for new medications and environmental bioremediation systems, for example.

Figure 5.3 Typical force curve.
(A–B) The cantilever tip is induced to come into contact with the sample surface. (B–C) The tip reaches the C region because of attractive forces near the sample surface. (C–D) The cantilever bends up as the tip is pushed against the sample surface. (D–E) The cantilever comes into equilibrium with the sample surface forces. (E–F) The cantilever bends from attractive forces. (F–G) Rupture moment (F) bounded by tip interaction and sample surface. (G) The cantilever is restored to the initial position. Vertical distance (F–G) represents tip-sample force adhesion (Fadh), and in (G–H) the tip and sample are not in contact. Adapted from D.A. Smith, et al., Chemical force microscopy: applications in surface characterization of natural hydroxyapatite, Anal. Chim. Acta 479 (1) (2003) 39–57 [63]. Copyright (2014), with permission of Elsevier Publishing House.
(A–B) The cantilever tip is induced to come into contact with the sample surface. (B–C) The tip reaches the C region because of attractive forces near the sample surface. (C–D) The cantilever bends up as the tip is pushed against the sample surface. (D–E) The cantilever comes into equilibrium with the sample surface forces. (E–F) The cantilever bends from attractive forces. (F–G) Rupture moment (F) bounded by tip interaction and sample surface. (G) The cantilever is restored to the initial position. Vertical distance (F–G) represents tip-sample force adhesion (Fadh), and in (G–H) the tip and sample are not in contact. Adapted from D.A. Smith, et al., Chemical force microscopy: applications in surface characterization of natural hydroxyapatite, Anal. Chim. Acta 479 (1) (2003) 39–57 [63]. Copyright (2014), with permission of Elsevier Publishing House.
Force curves can be statistically significant when carried out in series and repeated  times, where
  (preferably). Thus, the validation of force curves is performed by statistical approaches, evaluating the obtained data using normality tests, for example. As shown in Fig. 5.4, for an analysis to represent the sample as a whole, it is useful to construct whiskbroom scanning lines of the adhesion forces (Fadh), and these can be specified by the AFM topographic image previously supplied during the analysis and/or by the functions provided by the equipment software.

Figure 5.4 Arrangements (patterns) of acquisition of force curves that represent real characteristics of the sample: horizontal, vertical, and diagonal lines and assorted geometric shapes.
After obtaining a sample that statistically represents the data, a relative frequency histogram of the adhesion force values is obtained (Fig. 5.5), allowing one to obtain a range of standard values of Fadh. Thus, these histograms display the statistical distribution of the adhesion forces, given by the vertical distance found in the force curve. These results are extremely useful for commercial applications using the nanobiosensor and can evaluate if an actual sample satisfies the statistical conditions previously standardized and, therefore, verify if the actual sample contains the molecule of interest (analyte).
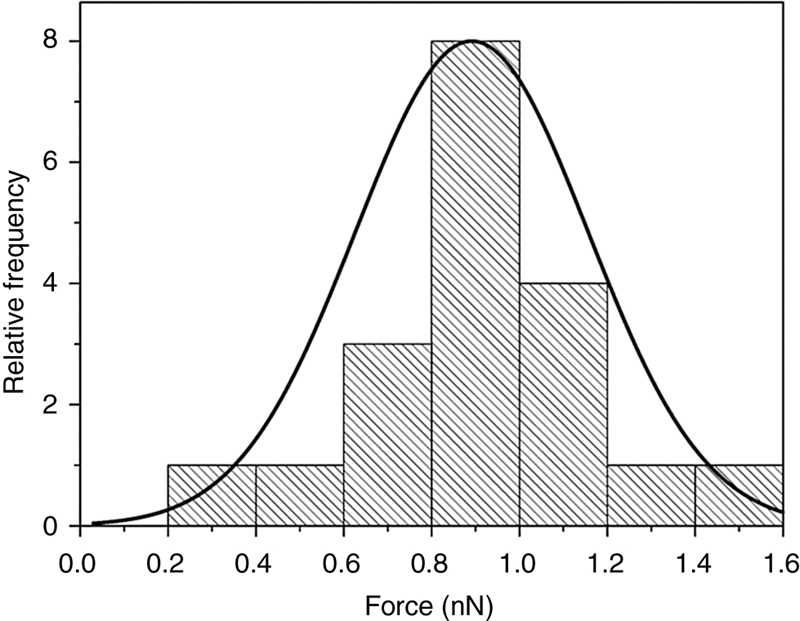
Figure 5.5 Histogram pattern associated with the mean relative frequency of adhesion force values measured by force curves.
To augment the analyses introduced, one can produce an adhesion map (Fig. 5.6). In this type of analysis, both topographic and force data are used to form the adhesion image, pixel by pixel. The adhesion map indicates whether the molecule of interest is uniformly distributed over the surface of the sample. In addition, these maps provide the incidence of specific interaction events per square centimeter or square milimeter [14]. Adhesion maps have another notable application: the pattern of shining pixels for specific recognition events can establish a fingerprint for each molecule, substance, receptor, and complexation to recognize and locate specific substances on a surface [64]. Therefore, this type of analysis can be a useful tool that allows the differentiation of surfaces at the nanoscale, via the sensing of systems with AFM tips [55].

Figure 5.6 Schematic representation of an adhesion map.
(A) Surface covered with target analytes; (B) surface divided in pixels; and (C) adhesion map image generated by the adhesion force calculation of punctual force curves generated. The brightest pixels (white) represent the specific interaction, and the darkest pixels (gray) are those in which the adhesion force was low and there was therefore no specific interaction.
(A) Surface covered with target analytes; (B) surface divided in pixels; and (C) adhesion map image generated by the adhesion force calculation of punctual force curves generated. The brightest pixels (white) represent the specific interaction, and the darkest pixels (gray) are those in which the adhesion force was low and there was therefore no specific interaction.
5.3.1.2. Theoretical Models for Analysis of Force Curves
Molecular recognition processes can be framed in several theories, such as “key-lock” or “induced-fit ” [65,66], with the latter currently preferred. The induced-fit theory assumes that the associated molecules perform an important role in the final determination of each other’s geometric forms; that is, a molecule that acts as a receptor is flexible and adaptable.
These theories influence the way in which adhesion forces are interpreted and therefore how they act in the formation of specific complexes. Thus, the detection of the force that binds inorganic or biological molecules to other surfaces, and also to each other, is an important prerequisite for the characterization of adhesion processes [67]. There are several theoretical models that accurately explain and quantify the several types of forces present in sensing systems and, therefore, in the operation of AFS [68,69]. In addition to providing data from the process of adhesion between two surfaces, these theoretical models provide information about material properties such as hardness and elasticity. In a study by Leite et al. [70], one can find a detailed description of these theoretical bases for several systems studied with AFS regarding intermolecular interactions and surface forces in vacuum, in air, and in solution. As we are discussing specific recognition in nanosensors with AFM tips, the main theories related to the contact region of the force curves only will be presented next, followed by the introduction of adhesion models for biological materials.
To understand the theories related to the contact region, it is necessary to know that the contact lines in the force curves describe the elastic/plastic behavior of the materials and its resilience. Considering first an ideal elastic material, after contact is established between the AFM tip and the sample (indentation), the latter will recover its initial shape. After its shape is recovered, the sample will exert on the tip the same force that is applied to its surface. When this occurs, the retraction curve perfectly overlaps the approximation curve (Fig. 5.7A) [70,71]. In a second scenario, when the sample exhibits ideal plastic behavior, it neither recovers its initial form nor can it exert a force on the tip. In this case, the approximation and retraction curves of the force curves do not overlap (Fig. 5.7B). Most samples exhibit mixed behavior and therefore usually present force curves without the curves overlapping [71–73]. This difference in the curve shift is called hysteresis, in which the force used in the retraction curve is smaller than the force used in the approximation curve (Fig. 5.7C).

Figure 5.7 (A) Force curves versus depth (δ) of an ideal elastic material and (B) of an ideal plastic material. (C) Force–depth curve of an elastoplastic material. H’ is the indentation depth at which the force equals zero, and H is the distance over which the sample recovers. Adapted from B. Cappella, G. Dietler, Force–distance curves by atomic force microscopy, Surf. Sci. Rep. 34 (1–3) (1999) 1–104 [68]. Copyright (2014), with permission of Elsevier Publishing House.
In addition to interpreting elastoplastic behavior, it is necessary to be familiar with the geometry of the tip because it is related to the contact region with the sample (Fig. 5.8). The determination of the spring constant of the sample (ks) depends on this contact area, Young’s modulus (E), and Poisson’s ratio (v), as shown in Eq. 5.1 [68]:
 (5.1)
(5.1)where a is the contact radius.

Figure 5.8 Elastic sphere deformation scheme over a plain surface according to the Hertz and Johnson–Kendall–Roberts (JKR) theories.
The profile of a spherical tip assumed using the Derjaguin–Muller–Toporov (DMT) theory is equal to the Hertz theory, in which F is the force applied, R is the sphere radius, y is the distance from the center of the contact area, δ is indentation depth, and ahertz and aJKR are the contact radius from the Hertz and JKR theories. Adapted from B. Cappella, G. Dietler, Force–distance curves by atomic force microscopy, Surf. Sci. Rep. 34 (1–3) (1999) 1–104 [68]. Copyright (2014), with permission of Elsevier Publishing House.
The profile of a spherical tip assumed using the Derjaguin–Muller–Toporov (DMT) theory is equal to the Hertz theory, in which F is the force applied, R is the sphere radius, y is the distance from the center of the contact area, δ is indentation depth, and ahertz and aJKR are the contact radius from the Hertz and JKR theories. Adapted from B. Cappella, G. Dietler, Force–distance curves by atomic force microscopy, Surf. Sci. Rep. 34 (1–3) (1999) 1–104 [68]. Copyright (2014), with permission of Elsevier Publishing House.
5.3.1.2.1. Hertz and Sneddon theory
To quantify the mechanical properties of biological samples, the most widely used theory is the Hertz theory. This model describes the elastic deformation of two plane, rigid, and homogeneous surfaces arising from contact with each other but does not take into account superficial and adhesion forces. Regarding force curves, the forces measured are dominated by the elastic properties because viscosity presents a minimal contribution over time. Therefore, given a sphere of radius R that comes into contact with a surface by a force F, the adhesion force Fadh, the contact radius a, the contact radius with zero load a0, the deformation of the spherical tip δ, and the pressure P are given, respectively, by Eqs. 5.2–5.6:
 (5.3)
(5.3)
 (5.5)
(5.5)
 (5.6)
(5.6)where x = y/a, y is the distance from the contact center, and the reduced Young’s modulus K is given by Eq. 5.7 [68]:
 (5.7)
(5.7)However, the Hertz theory assumes that the characteristics of the materials in contact are isotropic and homogeneous and also that the contact does not create friction because its geometry has axial and continuous symmetry (zones with high and low exerted superficial forces) [68]. However, in a large portion of the AFM/AFS experiments, the tip has a higher hardness than the surface of the sample, and the deformations resulting from this fact, both on the tip and on the sample, do not exhibit axial or continuous geometry. Therefore, one can conclude that the Hertz theory is experimentally valid only for contact events that create small deformations. In situations where large deformations occur, friction and adhesion (indentation), for example, must be taken into account. In these cases, the Hertz theory is not valid, and a modification of it must be used: the Sneddon model [74].
In the Sneddon model, the force F exerted on the surface of the sample and the deformation δ resulting from the indentation are given by [75,76]:
 (5.8)
(5.8)
 (5.9)
(5.9)The deformation and the contact force are calculated for heterogeneous and asymmetric indentation profiles (depth) [68,77]:
 (5.10)
 (5.11)
where f(x) is the function that describes the indentation profile.
Both models are used mainly to estimate the value of Young’s modulus for biological cells via force curves. This type of analysis has become increasingly important in the medical and biological fields for the nanomechanical analysis of different groups of cells, especially to differentiate between healthy and sick cells.
5.3.1.2.2.. Bradley, Derjaguin–Muller–Toporov, and Johnson–Kendall–Roberts theories
This section presents theories that take into account the effects of surface energy on contact deformation: Bradley, DMT, and JKR [68].
Bradley Theory: In 1932, the author theoretically modeled the interaction of two rigid spheres, for which the total force between these spheres is given by Eq. 5.12 [78] ( , separation equilibrium; R, reduced radius of the spheres (1/R1 + 1/R2)−1; and W, work of adhesion on contact) [68]:
 (5.12)
DMT Theory: In addition to the deformation of the elastic sphere (Hertz), there is also the action of an external force (F) as well as of the forces between the two bodies outside the contact region; such forces produce a finite area of contact. There may be an increase or a decrease of the contact area when forces are applied: an external force implies an increase in contact area, whereas a negative force implies a decrease of this area until zero is reached, when, to leave the contact state, it reaches its maximum value [68]. This theory can be applied to systems with low adhesion that have tips with a small radius [68]. Eqs. 5.13–5.17 correspond to Hertz and Sneddon equations, however, with minimization of the sum of the elastic and surface energies [70]:
 (5.14)
 (5.15)
 (5.16)
 (5.17)
JKR Theory: Only short-range forces inside the contact region are considered [70]. Its behavior incorporates hysteresis, and it is appropriate for highly adhesive systems with tips of low rigidity and large radius [79]. Thus, the presented JKR equations, 5.18–5.22, are equivalent to Eqs. 5.2–5.5 from Hertz and Sneddon:
 (5.18)
 (5.19)
 (5.20)
 (5.21)
 (5.22)
It is worth mentioning that there are several theoretical models that are more appropriate for biological systems; they feature adjustments related to the concentration of, kinetics of, and the complexes formed by organic molecules such as, for example, the Bell and Bell–Evans models [80–82] and the extended Bell model [83].
5.3.2. Chemical Force Microscopy
5.3.2.1. Introduction
Chemical force microscopy (CFM) is a technique used to chemically map the surface of a sample at the nanoscale (chemical nanocharacterization) by means of chemically modifying the AFM tip, making it sensitive to specific interactions. This technique not only allows the modulation of the interaction between functional groups by using chemically modified cantilevers, but it also allows the detection and quantification of these interactions [84]. This chemical modification, termed functionalization, ensures that the cantilever exhibits selectivity and sensitivity for interactions at the molecular level, thereby allowing detailed mapping of the chemical surface at the nanoscale [85]. The functionalization of the cantilevers has been extensively used in the development of biosensors (nanobiosensors) sufficiently powerful to detect a single molecule. CFM is an appealing tool because it presents fast response and selectivity [85] and is used both for characterization and for applications involving the detection of various types of analytes [86–90].
5.3.2.2. Methodology for the Functionalization and Characterization of AFM Probes
Several strategies have been developed to immobilize molecules on the tip of a cantilever and on the substrate for the purpose of favoring the correct interaction between them (molecule architecture/geometrical design), to reduce multiple events, and to differentiate specific (Fig. 5.9A) and unspecific (Fig. 5.9B) recognition events within the studied system.

Figure 5.9 Interaction among molecules is strongly related to its conformation on the substrates.
If the correct conformation is reached, the molecules will have spatial freedom to move; thus, they will reach the expected specific sensing active sites and will therefore achieve specific binding, and the adhesion force (Fadh) will be high (A). Otherwise, binding will not be specific, and the adhesion force will be low (B).
If the correct conformation is reached, the molecules will have spatial freedom to move; thus, they will reach the expected specific sensing active sites and will therefore achieve specific binding, and the adhesion force (Fadh) will be high (A). Otherwise, binding will not be specific, and the adhesion force will be low (B).
Regarding nanosensors, it is well known that the devices used in AFS (cantilevers, AFM tips) are based on silicon technology (e.g., SiO2, Si, and Si3N4) [91] and that they do not have, on their own, specific recognition characteristics. To enable such materials to be highly selective and sensitive sensors, their surfaces are usually chemically modified (functionalized) with organosilanes (such as 3-aminopropyltriethoxysilane, APTES), which have chemically active groups to provide an appropriate interface between the silicon transducer and the immobilized molecules. An important element of chemical functionalization of AFM tips is the linker, that is, a flexible molecule between the modified surface and the biomolecule that will be immobilized at its end to perform detection. Some examples of linkers are glutaraldehyde, alkanethiols, and polyethylene glycol (PEG). The functions of these linkers in a nanoscale sensing system are to give mobility and structural orientation freedom to the molecules; to help differentiate between specific and unspecific recognitions; to prevent molecule distortions and denaturation; to contribute to the uniform orientation of surface molecules; and to act as a bridge between the organic surfaces and the biomolecules [60]. All of these functions significantly contribute to prioritizing the specific bonds.
The immobilizations of these chemical groups to surfaces such as AFM tips are similar to a group of assorted molecular pieces in which the fitting of blocks (molecules) can occur via cross-linking or physical adsorption, in which the environment and the surfaces are controlled to immobilize molecules through the natural forces present, or in which the fitting can occur through the formation of covalent bonds, which is the methodology most often used, in which surface modification is reached by chemical reactions [50,61,92]. Concerning the chemical modification of surfaces for sensing systems based on AFM tips, it is necessary to know the geometry of the tip used, as previously noted, as well as its elastic constant [58]. Additionally, it is necessary to adapt the choice of molecule that will be immobilized to the tip so that it can specifically recognize the analyte [15,61,93]. For example, if the developed sensor must detect molecules of a specific antigen, the biomolecule bonded to the AFM tip must be its specific antibody. The use of molecular modeling together with recognition systems at the nanoscale is fundamental because this tool allows one to predict the types of interactions and structural conformations, binding energies, and electrical properties, among other parameters, aiding the understanding of the molecular behavior of the system [58].
Fig. 5.10A illustrates the tip of a cantilever coated with an organic monolayer whose terminal groups consist of methyl. Fig. 5.10B, in contrast, shows the tip of a cantilever functionalized with biotin, which is connected to the silicon nitride surface by a layer of bovine serum albumin (BSA). This functionalization renders the cantilever an extremely selective biosensor for detecting streptavidin molecules.

Figure 5.10 (A) Schematic representation of a silicon nitride tip covered by a thin organic methyl-terminated layer. (B) Schematic representation of a silicon nitride tip covered by biotin, which converts it to a nanobiosensor to detect streptavidin. Part A, Adapted from J.E. Headrick, C.L. Berrie, Alternative method for fabricating chemically functionalized AFM tips: silane modification of HF-treated Si3N4 probes, Langmuir 20 (10) (2004) 4124–4131 [94]; part B, adapted from M. Micic, et al., Scanning electron microscopy studies of protein-functionalized atomic force microscopy cantilever tips, Scanning 21 (6) (1999) 394–397 [95].
The characterization of the functionalized tip is usually necessary to ensure that the molecules/biomolecules on the surface are oriented appropriately to interact with the substrate, in addition to validating the functionalization process. For this purpose, several techniques can be used: imaging of the tip using scanning electron microscopy (SEM) [94,95] and AFM [96–98], infrared reflection-absorption spectroscopy [94,97], Fourier transform infrared spectroscopy (FTIR) [99,100], X-ray photoelectron spectroscopy (XPS) [96,98], fluorescence spectroscopy [101], and surface plasmon resonance [96,102] and contact angle measurements [97,98].
Additionally, other less common techniques can also supply information about the functionalization. For example, Volcke et al. [98] used techniques such as ellipsometry, chemical force titration, and dual-polarization interferometry.
5.4. Applications for AFM Tip Sensors
AFM tip nanosensors are frequently used to study various types of biological structures and processes, such as antigen–antibody bonds, ligand–receptor interactions [55], protein unfolding, molecular stretching [61], and the detection of molecules of interest for environmental [93,103], industrial [104], medical [105], military, and safety monitoring [26].
These devices can be used, for example, to detect agrochemical molecules at low concentration levels for environmental and food safety [93]. This technique is a viable and more sensitive and selective alternative when compared to the analytical methods used recently to detect agrochemicals, such as mass spectroscopy [14].
Silva et al. [93] describe the development of an AFM tip nanosensor devised for the detection of the herbicide metsulfuron-methyl via the formation of a specific bond with the acetolactate-synthase (ALS) enzyme. This sensor is based on the mechanism of inhibition of the action of the enzyme by the agrochemical and relies on a specific bond that can be mimicked by AFM tip sensors. In this same study, the authors demonstrated that the process of molecule immobilization (functionalization) was essential for the successful operation of the sensor. In addition, Franca et al. [58] proposed a theoretical sensing system based on the interaction of the acetyl-coenzyme-A-carboxylase (ACCase) enzyme for the detection of the agrochemical diclofop-methyl, based on the same specific inhibition principle presented by Silva et al. [93] (Fig. 5.11). These techniques have also been used in research regarding autoimmune and autoneurodegenerative diseases such as multiple sclerosis and neuromyelitis optica [106]. The group has recently created the research field termed nanoneurobiophysics and has pioneered the development of AFM tip and microcantilever nanosensors for the detection of enzyme-inhibiting herbicides and demyelinating diseases [106–112].

Figure 5.11 Schematic representation of an AFM tip enzymatic nanobiosensor.
(A) Schematic of the detection principle: enzyme molecules were immobilized on the AFM tip in solution as a result of electrostatic attraction. Enzyme-herbicide interaction was obtained through force curve measurements of the system. (B) Immobilized, oriented enzyme molecules over a functionalized AFM tip surface [58]. Reproduced from Franca et al., Designing an enzyme-based nanobiosensor using molecular modeling techniques, Phys. Chem. Chem. Phys. 13 (19) (2011) 8894–8899 [58]. With permission of the European Society for Photobiology, the European Photochemistry Association, and The Royal Society of Chemistry.
(A) Schematic of the detection principle: enzyme molecules were immobilized on the AFM tip in solution as a result of electrostatic attraction. Enzyme-herbicide interaction was obtained through force curve measurements of the system. (B) Immobilized, oriented enzyme molecules over a functionalized AFM tip surface [58]. Reproduced from Franca et al., Designing an enzyme-based nanobiosensor using molecular modeling techniques, Phys. Chem. Chem. Phys. 13 (19) (2011) 8894–8899 [58]. With permission of the European Society for Photobiology, the European Photochemistry Association, and The Royal Society of Chemistry.
5.5. Microcantilever Sensors
Recent advances in microelectromechanical systems (MEMS) have facilitated the development of sensors involving mechanical transduction or other mechanical phenomena [113]. One of the advantages of MEMS systems, including AFM microcantilevers, is the capacity to adapt the size and the structure of the device, in addition to its low cost. The microcantilever used in AFM consists of a thin and flexible beam with a thin pyramidal needle at the bottom, whose radius of the vertex at the end of the tip is a few nanometers. The microcantilevers can be fabricated with one or more silicon or silicon nitride beams with an average length between 100 and 500 μm and thickness between 0.5 and 5 μm. They may have a “V” (triangular) or a “T” (rectangular) shape [114].
To act as high quality sensors, the microcantilevers must be covered (i.e., functionalized) with a sensitive layer specific to the molecules of interest. The adsorption of these molecules to the beam creates excess surface tension, resulting in the curvature of the microcantilever [115] if it occurs preferentially on one of the sides of the surface. Selective adsorption is usually controlled by functionalizing the top surface of the microcantilever only [116,117].
5.5.1. Operation Modes of Microcantilever Sensors
There are two basic operation modes for microcantilever sensors, termed the static and dynamic modes. The static mode uses the change of the physical deflection of the microcantilever, whereas the dynamic mode uses the change in resonance frequency of the microcantilever resulting from the increase in mass adsorbed on the surface [115]. These modes differ because of the principles of the transduction, functionalization, and method of detection [116,117]. Fig. 5.12 shows the schematic representation of both operation modes for the microcantilevers.

Figure 5.12 Schematic representation of the microcantilever operation modes [118], (A) resonance frequency change (fres) resulting from an effective mass change and (B) surface tension resulting from molecular adsorption [119]. Reproduced from A chemical sensor based on a microfabricated cantilever array with simultaneous resonance-frequency and bending readout, 77/1-2, M. Battiston, J.P. Ramseyer, H.P. Lang, M.K. Baller, Ch Gerber, J.K Gimzewski, E Meyer, H.-J Güntherodt, 122–131, Copyright (2014), with permission of Elsevier Publishing House.
In the static deflection mode, the difference between the surface functionalized on only one side of the microcantilever (active side) and the surface that is not functionalized (passive side) causes a change in surface tension, causing the deflection of the microcantilever [116]. The deflection is a function of the spring constant (k), the properties of the material, and the geometry of the microcantilever. Stoney’s equation allows one to obtain the theoretical ratio of the response of the microcantilever (Zmax) to the tension difference between the active and the passive surfaces [115].
 (5.30)
where ν is the Poisson ratio (ν = 0.24 for a rectangular microcantilever), ∆σ is the surface tension induced by the analyte (∆σactive side − ∆σpassive side (N·m−1)), E is Young’s modulus, t is the thickness, and l is the length of the cantilever. This relation is valid only for thin films (20% of the thickness of the microcantilever) [64].
According to Lang and Gerber [116], the adsorption of molecules on the surface (functionalized on one side only) will result in a deflection upward or downward because of the change in surface tension between the functionalized and nonfunctionalized sides. If the opposite situation occurs, that is, when both sides of the microcantilever (top and bottom) are functionalized, both sides will be exposed to compressive stress predominantly on the bottom surface of the microcantilever and also to tensile stress on the top surface. For this reason, it is extremely important to functionalize the surface appropriately so that the nonfunctionalized side does not respond when exposed to an analyte or in deflection measurements for the microcantilever sensor in the static mode.
In the dynamic mode, the resonance frequency (fres) of an oscillating microcantilever is constant as long as the elastic properties remain unaltered during the adsorption or desorption of the molecules and the damping effects are insignificant [120]. These conditions can be attained as long as the surface molecules are in dynamic equilibrium with the molecules in the environment. The change in mass during the molecular adsorption can be related to the change of fres using Eq. 5.31 [121]:
 (5.31)
where fres(0) is the initial resonance frequency and fres(1) is the resonance frequency after mass is added.
The deflection and fres can be accurately monitored by using a variety of methods, of which optical deflection, piezoresistivity, capacitance, and electron tunneling are especially notable [121,122]. The simplest way of evaluating the deflection is the optical method, in which a laser diode is focused at the extremity of the microcantilever and the reflection of the laser is monitored by using a photodetector. The minimum deflection detected by this method is of approximately 0.1 nm. Its advantages are simplicity of operation, linear response, and the lack of requirement for electrical connections [123]. However, the calibration at each measurement is indispensable to register the signal in terms of the real deflection of the microcantilever.
In this context, the development of these devices based on the microcantilevers used in AFM has been very attractive in various application fields because recent advances in design and in the development of these sensors make them able to detect very small mechanical deflections. This high sensitivity is reached because the spring constant of a microcantilever is between the order of 10−3 and 101 N·m−1, thus allowing the detection of very small forces (10−12–10−9 N) [124]. These factors result in a fast response time, lower manufacturing costs, possibility of constructing a sensor array with small dimensions, and the ability to explore microenvironments [125].
The difficulty of comparison between the sensitivities of microcantilever sensors is compensated by the high level of detection, on the order of parts per trillion (ppt) [126–128], rarely reached by other types of sensors. It is emphasized that the sensitivity of microcantilever sensors is directly related to the sensitive layer.
Some aspects must be considered when choosing the microcantilever to be used as a sensor [122]; for example, the material must contain low internal damping (Young’s modulus), and the geometry must provide an elevated quality factor (Q); the surface of the microcantilever must reflect the optical reading with high quality, and so it cannot be rough because it would disperse the light in all directions; and the coating (functionalization) of the surface must be specific for the desired application.
5.5.2. Theoretical Considerations
One of the simplest mechanical structures is a microcantilever, in which one end is free and the other end is fixed to a support. When a force F (N) perpendicular to the laser beam is applied to its extremity, a deflection Z (nm) will occur in the material with Young’s modulus E (N·m−2) [115] (Fig. 5.13).

Figure 5.13 Schematic illustration of a microcantilever deflection (Z), in which F is the applied force and t, w, and l are the dimensions of the microcantilever [55]. Reproduced from Atomic Force Microscopy as a Tool Applied to Nano/Biosensors, Sensors, 12/6, Clarice Steffens, Fabio L. Leite, Carolina C. Bueno, Alexandra Manzoli and Paulo Sergio De Paula Herrmann, 8278–8300.
The theoretical mass-spring mechanism can be used to describe the resonance frequency ( fres) for a rectangular microcantilever with spring constant (k) [121]:
 (5.32)
where m is the mass of a microcantilever (kg) and can be expressed as:
where ρ is the density of the material (kg·m−3), and t, w, and l denote the thickness, width, and length of the microcantilever, respectively. Microcantilevers with lengths in the micrometer (μm) scale and with width and thickness dimensions in the nanometer (nm) scale vibrate at resonance frequencies (Hz) that are measurable because of thermal and environmental noise [121].
The expression of the spring constant (k) is given as a function of the geometric dimensions and parameters of the material [129]:
 (5.34)
where E is Young’s modulus (E = 1.3 × 10¹¹ N·m−2 for silicon in the <100> plane of its crystalline structure) [121]. The spring constant of a microcantilever is related to Young’s modulus, which depends on the properties of the material [130], thus defining the sensitivity of the microcantilever [131].
Microcantilever sensors can be functionalized with different types of materials, such as the inorganic and organic types, which enables the creation of bimaterial structures (silicon cantilever plus the sensitive layer) [132]. Among the inorganic sensitive layers most often used are metals such as gold, which is often used for the detection of mercury vapor [124].
To increase the functionality of these sensors, several types of organic layers have been researched for functionalization, such as biomolecules (DNA, RNA, specific antibodies, polypeptides, and nucleotides) [133], lipid layers [134], polymers [117], nanocomposites [135], and hydrogels [136], among others, for the detection of various physical, chemical, and biological stimuli [64]. Polymers are also often used to functionalize sensors for the detection of volatile compounds because the adsorption is completely reversible [137].
5.5.3. Applications for Microcantilever Sensors
In a study using microcantilever sensors functionalized with a conducting polymer, Steffens [137] observed that these devices present a detection limit for relative humidity (RH) of 1 ppmv. In addition, functionalized microcantilever sensors presented a fast response time, were repetitive during several RH cycles, and exhibited durability longer than 6 months. However, nonfunctionalized sensors were found to not interact with RH (%), that is, they did not provide a deflection response. In this same report [137], the deflection response of the microcantilever was essentially linear regarding the relative water vapor content at 20°C. The sensitive layer deposited on the surface of the microcantilever caused changes in the surface tension corresponding to the changes in the water vapor. A schematic demonstration of this research is illustrated in Fig. 5.14, in which one can observe the deflection of the silicon microcantilever sensors functionalized with polyaniline compared to a nonfunctionalized microcantilever when exposed to water vapor.

Figure 5.14 Schematic representation of nanomechanical microcantilever responses in two distinct moments.
(A) System consisting of microcantilevers (one functionalized microcantilever while the others are without any covering) in PBS solution and (B) when a specific antigen is added in the solution, binding to the functionalized microcantilever and leading to deflection.
(A) System consisting of microcantilevers (one functionalized microcantilever while the others are without any covering) in PBS solution and (B) when a specific antigen is added in the solution, binding to the functionalized microcantilever and leading to deflection.
Tests related to the use of the cantilever as a humidity sensor were carried out by Singamaneni et al. [64], whose research evaluated the use of flexible silicon structures covered with methacrylonitrile (bimaterial). The same authors correlated the deflection of the bimaterial with humidity and observed that the sensitivity change obtained with the cantilever was of the order of ±10 ppb, with response intervals in the range of milliseconds. Fig. 5.15 shows the deflection of the silicon cantilever functionalized with a layer of polyimide; according to another report [138], the observed upward deflection is due to the shrinkage of the polymer after curing. During the operation, when the cantilever comes into contact with the humidity in the environment, the polyimide layer swells, thus inducing a compressive stress so that the cantilever tends to return to its horizontal position. These examples show the great possibility of using cantilever sensors for measuring vapors and volatile organic compounds in food, with low detection limits and high selectivity.
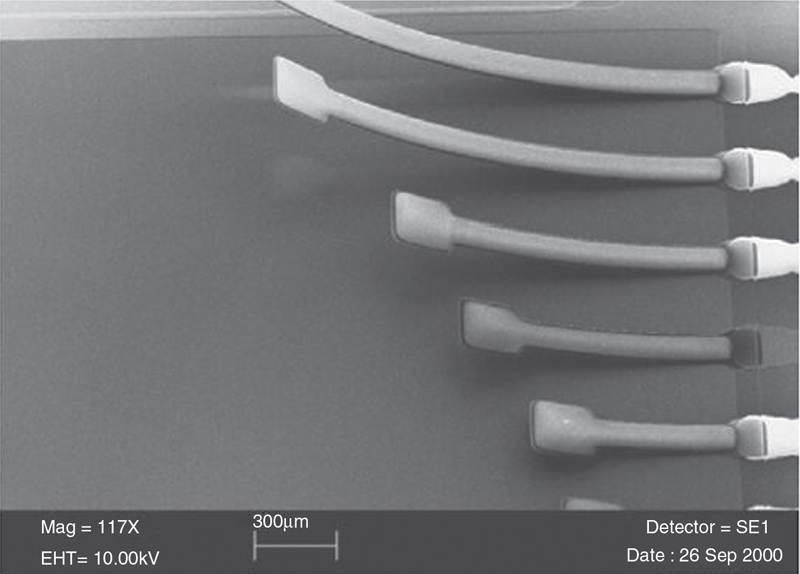
Figure 5.15 Deflections of the cantilever sensor functionalized with a polyimide layer and exposed to different relative humidity values [138]. Reproduced from Simulation of capacitive type bimorph humidity sensors, 10, J Fragakis, S Chatzandroulis, D Papadimitriou and C Tsamis, 305–308, Copyright (2014), with permission of © IOP Publishing. Reproduced with permission. All rights reserved.
The first studies involving microcantilever chemical sensors are related to the evaluation of physical and environmental parameters such as temperature, pressure, and humidity. Thundat et al. [139] reported the deflection of silicon nitride microcantilevers functionalized with 4 nm of chromium and 40 nm of gold, functionalized with 5–13 nm of nonfunctionalized aluminum, and exposed to different values of relative humidity. The deflection was essentially linear and reversible for the microcantilevers coated with gold, negligible for those without coating, and extremely sensitive for those functionalized with aluminum.
The absorption of water vapor by the sensitive layer was investigated by Thundat et al. [124], in which the authors functionalized one of the sides of two microcantilevers, one with a thin gelatin film and the other with phosphoric acid, both hygroscopic materials. The results indicated that the resonance frequency decreased for the microcantilever functionalized with phosphoric acid and increased for the microcantilever functionalized with thin gelatin film, when exposed to different values of relative humidity.
Ma et al. [140] described the use of silicon microcantilevers covered with a layer of polyimide for the measurement of humidity and gas flow rate. The change in humidity induced the microcantilever to suffer a deflection, creating a change in the measured resistance. This occurs because when the air flow passes over the microcantilever, a small deformation occurs, and the change in air flow rate can be determined by the change in resistance caused by the deflection of the laser beam.
Tests related to the use of microcantilevers as humidity sensors were also carried out by Singamaneni et al. [134], who evaluated the use of silicon flexible structures covered with methacrylonitrile (bimaterial). The results indicate that the change in sensitivity was on the order of ±10 ppb, with response intervals in the range of milliseconds.
The surfaces of the microcantilevers can also be covered with different polymers to analyze a mixture of volatile organic compounds [119,141,142]. The exposure of the polymers to the gases causes the polymeric matrix to swell because of the analyte adsorption process, which changes the density and the mass of the polymer. Lahav et al. [143] reported the development of an electro-oriented device with the deposition of polyaniline by redox activation on one of the sides of the microcantilever. The degree of deflection was controlled by repulsive electrostatic interaction by applying a voltage from −0.5 to 0.8 V. The oxidation of the polymer on top of the microcantilever caused electrostatic repulsion and the swelling of the polymer chains, thus resulting in deflection. The shrinkage of the polymer released the tension applied on it; as a result, the microcantilever returned to its original position.
Wu et al. [144] evaluated the use of microcantilevers functionalized with specific antibodies of prostate-specific antigen (PSA) for the diagnosis of prostate cancer via the optical detection method. When the functionalized microcantilevers were placed in contact with blood samples from patients with prostate cancer, an antigen–antibody complex was formed, deflecting the cantilever because of the adsorbed mass related to the antigen molecules. According to the authors, these results were more sensitive than conventional biochemical techniques for the detection of PSA.
Arrays of silicon nitride nanocantilevers were used to detect pieces of DNA with 1587 base pairs via resonance frequency change that resulted from the mass increase of the device because of analyte binding [145]. The reading of the frequency for the cantilevers was performed by means of laser beam scanning. To calibrate the response of the nanosensors with high sensitivity and precision (to count a small number of bonded molecules), researchers inserted gold nanodots on the cantilevers, which captured the modified sulfide agents from the double-stranded DNA. In this way, molecules were identified with a mass of 0.23 ag (1 ag = 10−18 g), indicating the detection of a simple DNA molecule, with 1587 base pairs.
Microcantilever sensors have also been applied in research involving bacterial resistance in infections, which involve several forms of the disease, ranging from inflammation to food poisoning [146]. Conventional methods for tests of resistance to antibiotics, such as the agar dilution method described by the National Committee for Clinical Laboratory Standards, require analysis times from 16 h up to 2 days [147]. In a study by Gfeller et al. [148], the authors evaluated the use of a cantilever array sensor functionalized with agarose as a nutrient medium for the detection of Escherichia coli. The sensors were exposed to suspensions of E. coli with growth in Luria-Bertani broth containing 10 μg·mL−1 tetracycline or kanamycin for 10 min. The resonance frequency was monitored to evaluate the increase in mass of the cantilever arrays, with an observed mass equal to 50 pg·Hz−1 (this mass corresponds to a sensitivity of approximately 100 E. coli cells). The sensors were able to detect growth during 1 h. Thus, this specific system of cantilever array sensors presents a large potential for applications in methods for fast detection of bacterial growth.
Microscopic fungi are human pathogens and serious contaminants in food production and industry [149]. Therefore, the fast detection of these species of yeasts and molds is of great importance for medical diagnosis and food quality control, among other applications. Nugaeva et al. [150] evaluated the use of cantilever arrays functionalized with concanavalin A, fibronectin, and immunoglobulin G for the selective immobilization and fast quantitative detection of fungal spores. Two morphological forms were evaluated, the fungus Aspergillus niger and the yeast Saccharomyces cerevisiae, and it was possible to detect with a sensor array a range of 103–106 colony forming units (CFU)·L−1. The measurement was proportional to the mass of individual fungal spores and can be used to evaluate the levels of spore contamination, with a response time of approximately 4 h, that is, 10 times faster than conventional analysis techniques.
Therefore, cantilever sensors and nanosensors have countless applications in various areas, thus presenting large potential to be explored as devices that are extremely sensitive, selective, and simple, have low cost, are able to detect a low quantity of analyte (in μL), and have fast analysis response [64]. Compared to other techniques for the detection of traces of substances in ppb and in ppt, such as high performance liquid chromatography (HPLC), thin layer chromatography (TLC), gas chromatography (GC), among others, analysis by these microdevices is much simpler and requires less time and instrumentation [133].
Cantilever sensors can consist of a single sensor element or an array of sensor elements. Simple cantilevers present some disadvantages because they are susceptible to changes in deflection because of temperature changes or chemical interactions with the environment (if operating in a liquid medium). Therefore, it is important to use a reference cantilever to exclude influences on deflection [115].
By using microcantilever arrays, it is possible to use a reference cantilever, whereas the other cantilevers are functionalized with the molecules of interest (sensitive layer with affinity), for the detection of the target molecules, thus evaluating multiple signals [115]. This type of array can also be expanded to integrated multisensors, supplying a viable platform for the development of high performance electronic noses [129]. The electronic nose was developed in the early 1980s [151], and the most accepted definition is given by Gardner et al. [152], who defined it as an “instrument which comprises an array of electronic chemical sensors with partial specificity and appropriate pattern recognition system, capable of recognizing simple or complex odors”. Since then, the analysis of volatile compounds has grown in prominence, and several studies have been dedicated to the improvement of odor measurement. Electronic noses can be applied to several areas, such as in agriculture for the detection of diseases in cultures, for the identification of insect infestations, and for the monitoring of food quality [7,153]. The responses obtained by electronic noses are typically formed by comparison of the profiles of the volatile organic compounds (VOCs) in the sample and in a reference profile, such as VOCs emitted by healthy and sick plants/fruits [154]. Several studies are being performed using electronic noses for the detection of the ripening degree of fruits (banana) [153], for monitoring changes of the odor from apples during storage [155], and to evaluate the post-harvest of fruits and vegetables [156].
Polymers have often been used to functionalize these different cantilevers with distinct sensitive layers because they present high sensitivity [132]. This sensitivity is obtained through the surface tension of the sensor and can be a result of the swelling of polymer chains because of the absorption of analytes [157]. Research performed with sensitive polymer layers has addressed the detection of humidity, pH changes, alcohols, alkanes, ethers, aromatics, esters, ketones, perfume essences, beverage flavors [115,117,158,159], and also as the inert layer in reference cantilevers [160,161].
5.6. Challenges and Tendencies
From a marketing viewpoint, both academia and industry must face the challenge of reducing the costs of the materials and devices used to build a sensor/nanosensor, with the purpose of making the products that use this technology compatible with most of the technologies currently used. Additionally, there is a need to develop a process of mass production that is efficient as well as to identify key elements that lead to strategic options for technological connection with current and future market conditions. There is also the need to invest in Research & Development, from basic to specialized research, to create more knowledge, information and, consequently, sensing products that are broadly characterized, reliable, useful, and able to perform multiple analyses. In addition, nanosensors must satisfy certain requirements, such as early and safe detection with high specificity and selectivity, simplicity, and the ability to be connected to a minimally invasive or even noninvasive procedure of detection (for the nanobiosensor case) [6].
It is worth noting that there is also a social and ethical challenge related to sensors built at the nanoscale. With these sensors, the capacity to measure extremely small quantities of atmospheric pollutants or toxic materials in diverse environments brings questions and dilemmas of risk thresholds. Additionally, nanosensors for medical applications will not only aid diagnosis and treatment of patients but also enable prediction of a healthy or nonhealthy patient profile. This capability will have a direct impact on how health insurance companies will act because they may use this information to grant or deny coverage of a service. In the food industry, the use of nanosensors can lead to high thresholds of food safety and quality. Finally, when applied to information technology, nanosensors may significantly increase the efficiency of devices for surveillance and monitoring, which are directly coupled to issues related to privacy and security.
Given that the advances in the detection and sensing of different biological and chemical species (organic and inorganic) can be achieved with greater capacity and accuracy through the use of nanosensors, the social and ethical mechanisms involved can be positively designed with accurate and reliable information, thus heading to a future without negative implications but offering great discoveries and innovations.
List of Symbols
∆σ Surface tension induced by the analyte
∆m Change in mass
δ Deformation of the spherical tip
a Contact radius
a0 Contact radius with zero load
E Young’s modulus
F Force
fres Resonance frequency
fres(0) Initial resonance frequency
fres(1) Resonance frequency after mass is added
K Reduced Young’s modulus
K Spring constant
ks Spring constant of the sample
P Material’s density
P Pressure
R Sphere radius
ν Poisson’s ratio
W Work of adhesion upon contact
..................Content has been hidden....................
You can't read the all page of ebook, please click here login for view all page.