Another large advantage that we can exploit in industrial cases is the fact that many of these setups have a fixed camera position. This is interesting when the objects that need to be detected follow a fixed ground plane, like in the case of pedestrians or objects passing by on a conveyor belt. If these conditions exist, then there is actually a possibility to model the scale of an object at each position in the image. This yields two possible advantages:
- First of all, you can use this knowledge to effectively reduce the number of false positive detections while still keeping your certainty threshold low enough so that low certainty and good detection still stick around. This can be done in some sort of post-processing step after the object detection phase.
- Secondly, this knowledge can be used to effectively reduce the detection time and search space for object candidates inside the image pyramid.
Let's start by focusing on the following case, illustrated in the following figure. Consider the fact that we want to create a pedestrian detection and that we have an existing model for doing so. We have a 360-degree camera mounted on top of a car and are grabbing those cycloramic images at continuous intervals. The cycloramas are now passed on towards the computer vision component that needs to define if a pedestrian is actually occurring in the image. Due to the very large resolution of such a 360-degree cyclorama, the image pyramid will be huge, leading to a lot of false positive detections and a very long processing time.
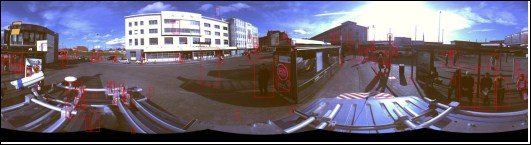
An example of the Viola and Jones cascade classifier pedestrian detection model in OpenCV 3 based on HAAR features
The example clearly shows that when applying the detector it is very hard to find a decent score threshold to only find pedestrians and no longer have a bunch of false positive detections. Therefore, we took a base set of 40 cycloramic images and manually annotated each pedestrian inside, using our object annotation tool. If we then visualized the annotation heights of the bounding box in function of the x position location of appearance in the image, we could derive the following relation, as shown in the following graph:
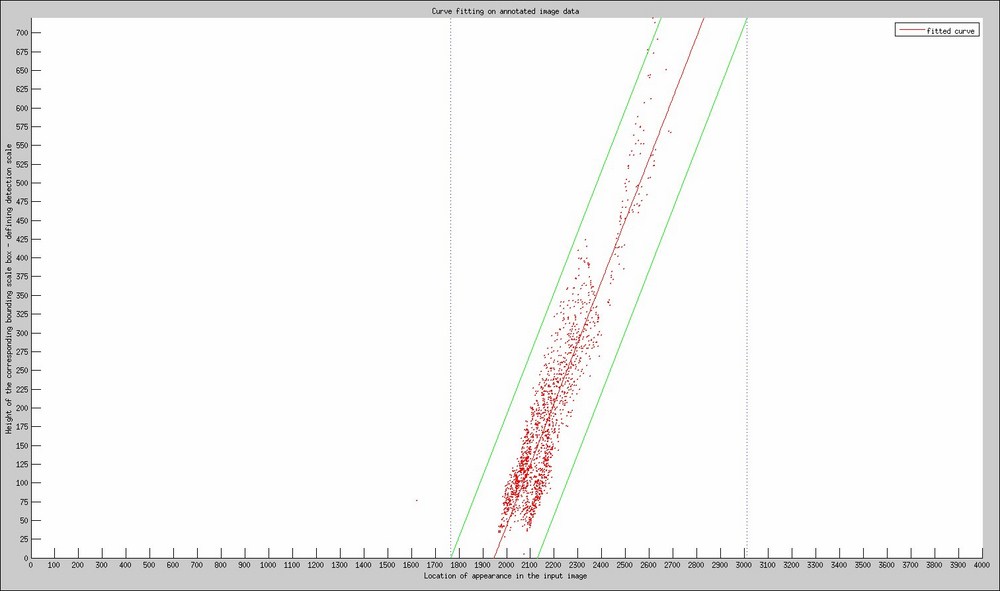
Scale space relation between the position of the annotation in the image and the scale of the found detection
The red dots in this figure are all possible ground truth annotations that we retrieved from the test bench of 40 cycloramas. The red line is the linear relation that we fitted to the data and which describes more or less which scale should be detected on which location in the image. However, we do know that there could be a small variation on that specific scale as defined by the green borders, in order to contain as much of the annotations as possible. We used the rule of assigning a Gaussian distribution and thus agree that in the range [-3sigma,+3sigma] 98% of all detections should fall. We then apply the minimal and maximal value according to our ranges and define a region where objects can occur naturally, assigned with the blue borders and visualized in the following picture:
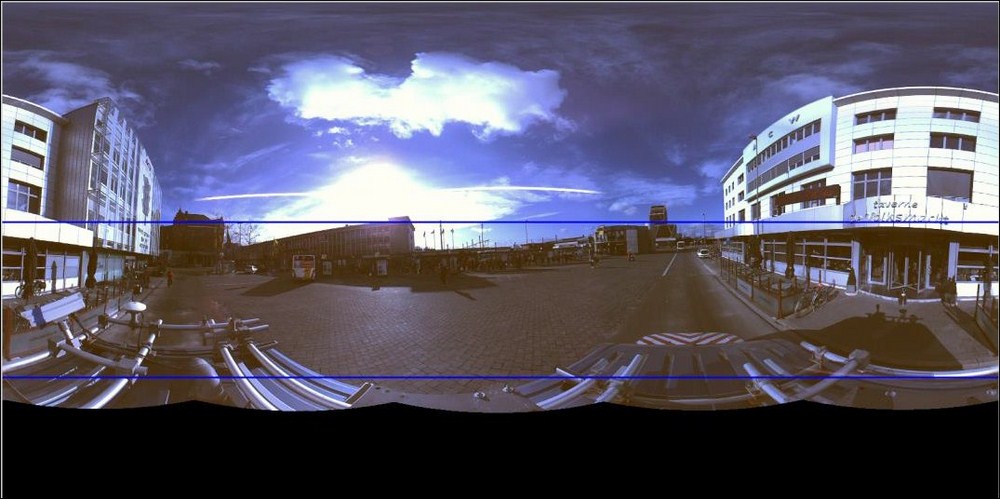
Possible locations of pedestrians walking in the same ground plane and fully visible by the camera system
This means that if we run a detector on this input image, we already can eliminate more than 50% of the image because training data clearly shows that a pedestrian cannot occur in that location. This reduces the search space quite a lot! The only downside to this approach of limiting the search space with an image mask is that people on, for example, balconies will simply be ignored. But again, in this application, it was not necessary to find these people since they are not in the same ground plane.
We then finally combined everything we know from this chapter together. We applied a scale space relation for all possible scales that can occur, already only inside the mask area because objects cannot exist outside of it in our application. We then lowered the score threshold to have more detections and to ensure that we have detected as many pedestrians as possible before applying our filtering based on the scale-space relation. The result can be shown here. It clearly shows that there are applications where the contextual information can increase your detection rates a lot!
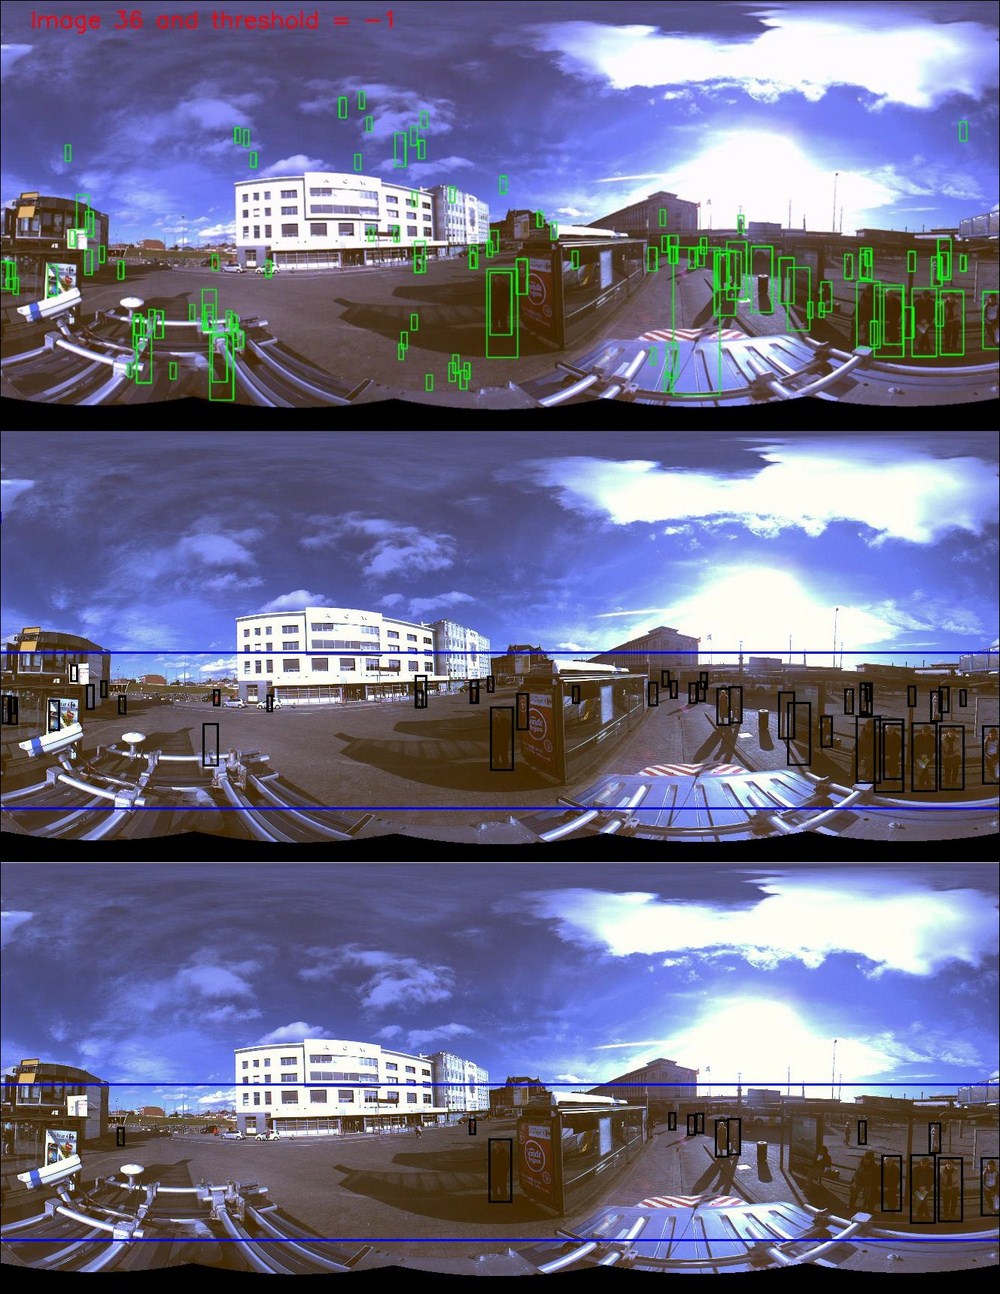
The complete pipeline: 1) detection with low threshold, 2) applying the mask and removing a lot of false positives, 3) enforcing the scale space location to remove extra false positive detections