
CHAPTER 9
Demand Planning
In Oracle Manufacturing, Demand Planning is at the front end of the planning process. It is where you create and manipulate predictions of future demand. It gives these users an environment where they can “slice and dice” volume data. You can create these predictions yourself, or you can use the history created through the shipping system to create your time series data. You can combine calculated forecast data and adjust for events such as promotions, price increases, cannibalization from new product lines, etc. The responsibility for portions of the forecast can be assigned and then the aggregate forecast assembled for final review. It is a collaborative process involving internal and external participants. Information from several sources is collected and organized in order to estimate future demand based on market conditions. ODP provides exception-based forecast tracking and notifications. Figure 9-1 gives an overview of the demand planning collaboration.
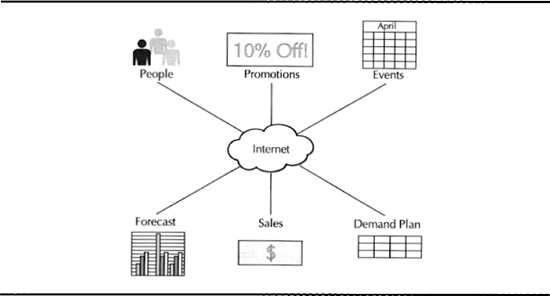
FIGURE 9-1. Demand Planning in a collaborative world
Demand Planning Overview
Oracle Demand Planning (ODP) generates demand forecasts that form the basis of plans from long-term strategic business plans to forecasts that feed the master production schedule. ODP collects data from Oracle Applications into a central planning server. It comes with predefined collections for 10.7, 11.0, and 11 i.
What Demand Planning Does
Demand Planning collects time series information from many data sources including shipments, bookings, opportunities, and other forecasts. Feeds into ODP can be time series data from Oracle Shipping, bookings from Oracle Order Entry, or a forecast from Oracle Manufacturing or a third-party application. ODP allows the data to be viewed at multiple levels of aggregation. It enables you to summarize the item, geographic, organization, and time hierarchies. When used with the Advanced Planning and Scheduling system, it creates the demand forecast that will drive the planning and scheduling systems.
ODP has capabilities to model promotions, product introductions with associated cannibalizations, and product phase outs. When making changes to the forecast, planners also associate change reasons with comments, creating an audit trail and knowledge base for future plans. Forecasts can be created at any level and later reconciled on a top-down or bottom-up basis.
Demand Planning User Interface
Demand Planning is used by professional analysts within the enterprise, as well as occasional users within the enterprise and in customer and distributor enterprises. Demand Planning provides interfaces for untrained users that are accessible through a Web browser, interfaces tuned for analytical processing as well as reports and notifications.
User Interfaces Available to Partners over the Internet
Oracle Demand Planning supports Internet collaboration, incorporating information from sales, marketing, operations, and customers. You can also manage multiple scenarios to develop a collaborative consensus demand plan. It is built on Oracle’s Internet computing architecture, which enables all of the applications to be deployed over the Internet or your corporate intranet. ODP is also completely integrated with Oracle’s Self-Service Web Applications. Any authorized person with a Web browser can verify and adjust forecasts based on local knowledge.
User Interfaces Tuned for Multidimensional Analysis
The Worksheet user interface provides drill and pivot capability. You can create a worksheet with selected measures and dimension values, adjusting the size of the columns to fit your data. You can arrange the dimensions on the page according to how you want to view the data. You can view a more detailed or higher level of data. You can view a different page of the worksheet.
Reporting and Alerting
ODP comes with a set of feedback and alerting mechanisms that range from preconfigured reports to user-defined alerts that will deliver e-mail when the defined condition is met. Such conditions might be significant forecast error for a particular region or low margin for a given product family. Both the preconfigured and ad hoc reporting tools come with graphing or export to Excel. The reports can handle currency and unit of measure conversions to ensure that the aggregate reports are expressed in common measures.
Demand Planning Technology
ODP imbeds state-of-the-art forecasting technologies from Geneva Forecasting. It supports level trend and seasonal exponential smoothing, linear and non-linear regression with outlier detection, and best fit analysis.
Oracle Express server is the database at the back end providing data manipulation and analytical capabilities.
Demand Planning Terminology
You should be familiar with the following terms that will be used throughout this chapter:
![]() Scenario A set of circumstances that might occur in the future, that you are creating a demand forecast for.
Scenario A set of circumstances that might occur in the future, that you are creating a demand forecast for.
![]() Measure An attribute of the plan that determines its success as a plan. One such attribute might be forecast error. Another might be the profit yielded by the plan.
Measure An attribute of the plan that determines its success as a plan. One such attribute might be forecast error. Another might be the profit yielded by the plan.
![]() Forecast A prediction of future demand in quantitative terms.
Forecast A prediction of future demand in quantitative terms.
![]() Baseline forecast The forecast generated by the assigned forecasting method for a given scenario, before planners make any changes based on local knowledge.
Baseline forecast The forecast generated by the assigned forecasting method for a given scenario, before planners make any changes based on local knowledge.
![]() Dimension An attribute of the forecasts and planning data, that you might want to see quantities or measures aggregated by. For example, you might want to see the forecast error at various levels in the product dimension.
Dimension An attribute of the forecasts and planning data, that you might want to see quantities or measures aggregated by. For example, you might want to see the forecast error at various levels in the product dimension.
![]() Hierarchy A number of levels within a hierarchy. For example, the geography dimension can contain the location hierarchy. This extends from the customer location through countries and regions to “All Geographies.”
Hierarchy A number of levels within a hierarchy. For example, the geography dimension can contain the location hierarchy. This extends from the customer location through countries and regions to “All Geographies.”
![]() Time series data Any collection information about something varying over time. Demand or shipment information is an obvious example. Quality data or machine failure information might be others.
Time series data Any collection information about something varying over time. Demand or shipment information is an obvious example. Quality data or machine failure information might be others.
Understanding the Demand Planning Environment
ODP uses Oracle Express as the database that holds the forecast data. It is important to understand the distinction between the planning server, the demand planning consolidated database, and the individual planner databases. Figure 9-2 illustrates how the different pieces of the Express Server relate to each other.

FIGURE 9-2. Demand Planning environment
The planning server holds all of the time series data, sales plans, and demand from internal or customer sources. The demand planning shared database holds the consolidated forecasts from all of the planners. Only the Plan Manager has access to this environment. Each planner has a personal database that holds the forecast for his or her portion of the aggregated forecast. Planners can manipulate plans and create histories and forecasts in their own private databases.
Understanding Demand Planning Roles
Your system administrator might have chosen different names for the roles and responsibilities in Demand Planning, but the following is a brief overview of the division of work. This division is delivered as different responsibilities.
Demand Planning Integration Administrator
The Demand Planning Integration Administrator is the individual who is responsible for a demand plan. You set up dimensions and hierarchies for Demand Planning and set up the ERP instances that Demand Planning will be working with. You set up demand plans with the express databases and run the collections from the source instances and publication of the forecasts. This work is done from within the Oracle Applications environment.
Planning Administrator
The Demand Plan Administrator assigns parts of the planning problem to individual planners. They track the progress of the Demand Planning cycle as well as defining and setting up planning alerts. This work is done from within the Express Server.
Planner
The Planner is responsible for the accuracy of the forecast in an assigned segment of the plan. You review his portion of the plan, make adjustments as necessary, and then submit the plan back to the planning manager.
Planning Manager
It is the role of the Planning Manager to review and adjust the entire forecast. It is only this role that gets this unrestricted view of the forecast data. The Planning Manager can use his or her judgment to adjust the plan in the shared database.
Configuring Oracle Demand Planning
To configure Demand Planning, you will need to log on with access to the Demand Planning Integration Administrator functions. The Demand Planning Integration Manager is the individual that sets up the data elements required to build a demand plan. These Data elements include Dimensions, Hierarchies, Planning Levels, Plan Names, Express set up data, Plans, and Output Scenarios. Oracle collects data into the planning server through a layer of views. As delivered these are collecting against the Oracle transaction systems, but the views provide an insulation should you need to integrate Demand Planning with other systems.
Demand Planning Dimensions
Dimensions are the ways that you “slice and dice” your data within the Demand Planning. You should think about the ways that your company assigns responsibility for tracking and achieving volume.
Oracle provides six predefined dimensions and two dimensions that can be user defined. You can also change the names and descriptions for the dimensions that Oracle delivers. For example, Oracle delivers a dimension for “Ship From Location.” You might want to rename this to “Shipping Warehouse.” Navigate to the Dimensions form in the Set Up menu.
Demand Planning Hierarchies
Hierarchies are the routes up the dimensions that you aggregate data. For example, you can aggregate data from customer site level up a geography dimension. To set up a dimension, navigate to the Hierarchies form in the Set Up menu. You will see the Oracle has seeded a number of hierarchies. For example, there are three hierarchies sharing the geography dimension: Customer Class, Customer Group, and Geography.
Demand Planning Levels
You might want to show projected volumes for a product grouping at various levels. Levels might include
![]() Customer site to plan distribution requirements, aggregated to
Customer site to plan distribution requirements, aggregated to
![]() Customer to verify with the account manager, aggregated to
Customer to verify with the account manager, aggregated to
![]() Customer class to verify with the sales manager, aggregated to
Customer class to verify with the sales manager, aggregated to
![]() All Geography to verify with the factory manager
All Geography to verify with the factory manager
To define the levels within a hierarchy you can either navigate to the Levels form in the Set Up menu, or you can create the Hierarchy Levels from the Hierarchy Definitions form. In the level definition you can state whether the level is Top, bottom or intermediate. This determines the navigation up and down the hierarchy.
Demand Planning Hierarchy Levels
To set up this hierarchy, click the Hierarchy Levels button in the Hierarchies form. You will see that levels within a hierarchy refer to their parent levels to form the hierarchy. Figure 9-3 illustrates how the hierarchies and hierarchy levels fit together.

FIGURE 9-3. Setting up Demand Planning herarchies
You will also notice that the relationship between the parent and child levels is in a view. As delivered this view is over Oracle Applications, but if you are integrating to other systems, you can name a view that defines the relationship. For the form to work correctly the view that you define must return the following columns:

Defining Events
You can define marketing promotions, new product introductions, and phase outs to be considered within a demand-planning scenario. Navigate to the Promotions and Other Events form. Enter the name of the promotion. You can promote an individual product, a product family, a category, or all products. Enter the Start Date and End Date for the promotion. Click the Details button to record the effects of the promotional activity. The promotion will affect demand in different ways for different periods during the promotion. For example, if the promotion is a retail promotion and the retailers fill the shelves, there will be an initial peak followed by a plateau in demand at a higher level than unpromoted demand. The promotion will be running within a portion of the plan identified by the dimensions and levels. For example, the promotion might be running on the West Coast, through the Direct Sales Channel, in the Major Accounts Sales Organizations, serviced from the Nevada Distribution Center. Events are used in the definition of the Demand Plan scenario.
Defining Introductions
New Product Introductions enable you to use history of the Base Product to calculate forecast for the new item. It enables you to specify the Cannibalized Items whose demand is likely to fall due to the new product being introduced. For example, a manufacturer of communications equipment may move into the PDA market. The sales of PDAs will be based roughly on the sales of the smaller cell phones. The older cell phones will be unaffected by the PDAs as the buyers are likely to be early adopters who will choose between the high-end cell and the PDA.
Defining the Instances and Organizations to Be Collected from
Demand Planning is designed to get time series data from many data sources. These data sources could be on many instances. An enterprise might be running some divisions on one instance of Oracle Applications and other divisions on another. You can define the instances to collect from and the Organizations within those instances by navigating to the Instances form in the Set Up menu.
NOTE
You will have to run the Demand Planning Setup Data Collection once to collect the organization and item category information.
Defining Demand Plans
With the Demand Planning system configured you can start to define demand plans. Demand plans consist of a header that defines the dimensions that the demand plan will be analyzed by, the inputs that the demand plan will be based on, and the scenarios that the demand plan will attempt to forecast. The scenario has a set of events beyond the time series data to be considered, such as promotions and product introductions. The scenario is also defined by the levels at which the output of the planning scenario occurs. Figure 9-4 is a sample of a completed demand plan ready to start its cycle.

FIGURE 9-4. A sample demand plan
Defining Demand Plan Headers
As delivered, the demand plans are defined using the Demand Planning Administrator responsibility. Navigate to the Demand Plans form in the Demand Plan Definitions menu. Figure 9-5 illustrates how the demand plan is assembled from Inputs, Scenarios, and Outputs.
Your demand plan could be for any portion of the business. Decide on a name and description. You might need to decide on a common unit of measure to express volumes, if you want to show aggregate measures volume for items that have difference primary units of measure in their time series data.

FIGURE 9-5. Setting up a demand plan
NOTE
Unit of measure conversions are collected from the source system.
You will need to choose the item category set that represents the product hierarchy used for Demand Planning.
NOTE
Item Categories are a multi-segment key flex. As at time of going to press, Oracle does not support multiple levels in this hierarchy. For more information on item categories review Chapter 3 which covers engineering and product management.
You can also define the Average Discount to assume from the list price for calculating the future revenue stream. The volumes will be bucketed in time according to the type and name of the calendar that you choose.
Defining Dimensions
Define the Dimensions that you wish to use to analyze your data. Time and Product are mandatory. If you want to analyze by more than four dimensions, you will have to “collapse” those dimensions into “user dimension.” For example, you might want to analyze by “Sales Representative” and can “Collapse” Sales Representative into Geography. The leaf node of the hierarchy will then be location and sales representative, rather than location. To be able to analyze the data using hierarchies within these dimensions you will need to click on the DP Hierarchies button. This will show all the hierarchies that use the dimension you have selected. Select Copy All to use all the hierarchies within this dimension for this plan.
Defining Inputs
Define the sources of time series data for your forecast. These are from the sources captured in the collection and pull stages. For shipment and booking history, you can choose the date that you would like to use as the time series: Booked, Shipped, Scheduled, Promised, or Requested.
Define Scenarios
When you choose the Scenarios tab, you are defining possible outcomes for the planners to work with. Enter a name and description for the scenario. For example, you might have a scenario for a new competitor entry, a scenario for an economic recession, and a scenario for a price war. Define the Forecast type and Forecast Period Type that the scenario will be based on. You need to define the historical window that the scenario will be based on and the future period that the scenario will cover.
Associate Events
You can associate events that you have defined in the Define Events and Promotions. Click the Events button and choose from the list.
Define Output Levels
Click the Output Levels button. You should think about the level that will be appropriate to generate the forecast at. If you generate the forecast at low levels, it can overwhelm the audience with too much detail. However, if the output is at too high a level, it will be forced down through allocation rules to lower levels. This can force local conditions to be “spread” across your plan. For example, if you output at “Region” level, but have a large demand from a particular “Customer,” this local variation will be spread across all customers for that region.
Defining the Express Setup
The last tab is where you define the Express Setup. This is a highly technical function that you will need knowledge of the network topology to complete. The EAD (Express Applications Database) name is the name of the express database instance. The Express Port is the name and port number of the machine. The Shared Database Prefix defines how the shared Express databases will be named when it is created. If you leave this blank, the shared database will be created as OPD<Demand Plan Name>. The Express Connect String is how the information is passed to and from the express environments. The Shared Database Location is where the shared database will get created. The OWA (Oracle Web Agent) Virtual Path is the virtual directory path defined in the Oracle Express Web Agent cartridge.
Demand Planning Administrator Functions
The Demand Plan Administrator performs his work in the Express environment to administer and monitor the demand plan. The functions of the Demand Plan Administrator include
![]() Setting up the Express system parameters
Setting up the Express system parameters
![]() Managing predefined reports
Managing predefined reports
![]() Managing Demand Plan Assignments
Managing Demand Plan Assignments
![]() Setting scenario properties
Setting scenario properties
![]() Tracking progress of the demand plan
Tracking progress of the demand plan
Setting Up Oracle Express System Parameters
You will need to specify the location of the public, shared, and private databases for Demand Planning. In the Navigator, go to Database Information. You can also change the appearance of the demand-planning page for the users with a background image and welcome text. If you leave this blank, the standard message will greet users.
You also specify how the application will handle Java foundation classes on this page. You can opt to install Oracle Jinitiator, enable users to access Java foundation classes remotely, or enable local install of Java Foundation classes. Jinitiator is Oracle’s Java program for running its applications.
NOTE
The default setting is Local Cache Install of Jinitiator. Check to ensure that users’ PCs meet memory requirements for the installed version of Jinitiator.
The Jinitiator properties are only relevant if you have chosen the Jinitiator option as the installation type.
Managing Predefined Reports
As Demand Planning Administrator you can select the predefined reports to make available to the planners and plan managers. You can specify the dimensions for which the reports can be generated and determine certain default report parameters. Default settings for predefined reports are Time Levels, Comparison Measures, and Review Document Dimension.
Dimension Selection Options
Single or multiple dimensions can be selected for each report. For example, if you select the Growth report and choose the Geography and Product dimensions, users will see a Growth folder with both Product Growth and Geography Growth documents.
Dimension Selection Restrictions
Restrictions for multiple dimensions apply to Mix Comparison Report and the Sales Trend reports. For Mix Comparison Report, only the Product dimension is available. For the Sales Trend and Cumulative Sales Trend Reports, the Analysis Dimension must be one of Time. Time cannot be an Analysis Dimension for any other report. Dimensions selected for reports must have a hierarchy defined. See the section “Configuring Oracle Demand Planning” for information on hierarchies.
Managing Demand Plan Assignments
Demand Planning responsibilities might be any combination of item, geographic, or customer characteristics. If you log with a responsibility with Demand Plan Administrator functions, you will be taken to the Web-based planning environment of Express. In the Navigation list, choose Demand Planner Assignments. The window for maintaining assignments appears in the workspace. Scroll to the bottom of the page and choose New. A row for “New Assignment” is inserted in the grid. Your Oracle ID is displayed as the default owner. Create a name for the assignment. Assign it to the proper planner using his or her Oracle ID. Choose Edit to assign the values for each dimension for this assignment. For example, Neptune might have a planner assignment for Server Products in Corporate Accounts on the West Coast. To check that there are no conflicts in the assignments, choose Refresh. A red flag will be displayed if conflicts are detected.
NOTE
To check for segments of data not yet assigned to any planner, scroll to the bottom of the Demand Planner Assignments list and choose Unassigned. An Unassigned dialog box appears with the unassigned data.
Setting Scenario Properties
In the Navigation list, choose Output Scenarios. The scenarios for the demand plan are displayed in the grid. Select a scenario and choose Properties. The Scenario Properties dialog box appears. The Forecast Method, Forecast Levels, and Allocation Rule tabs display the current settings for the scenario.
Specifying the Forecast Method
The forecasting engine that is included in Oracle Demand Planning offers a range of forecasting methods. A brief explanation of some of them follows:
![]() Linear regression A forecasting method in which a linear relationship is determined from historical data. An example of a linear relationship might be a direct relationship between ice cream sales and sun tan lotion.
Linear regression A forecasting method in which a linear relationship is determined from historical data. An example of a linear relationship might be a direct relationship between ice cream sales and sun tan lotion.
![]() Polynomial regression A forecasting method of the nonlinear type in which a linear relation is fitted to a transformation of the original data. For example, the number of pairs of sunglasses is not directly related to the sales of ice cream. As the sales of ice cream increase the sales of sunglasses will also increase. But whereas people might buy ice cream every day, they are unlikely to buy sunglasses every day.
Polynomial regression A forecasting method of the nonlinear type in which a linear relation is fitted to a transformation of the original data. For example, the number of pairs of sunglasses is not directly related to the sales of ice cream. As the sales of ice cream increase the sales of sunglasses will also increase. But whereas people might buy ice cream every day, they are unlikely to buy sunglasses every day.
![]() Exponential fit A forecasting method of the nonlinear regression type in which a linear relationship is fitted to a transformation of the original data between one variable and the log of the other variable. An example might be the correlation between time and Internet capacity, which doubles every six months.
Exponential fit A forecasting method of the nonlinear regression type in which a linear relationship is fitted to a transformation of the original data between one variable and the log of the other variable. An example might be the correlation between time and Internet capacity, which doubles every six months.
![]() Single exponential smoothing A forecasting method used where the volume is relatively fixed over time. Exponential smoothing gives an “average” of all the previous data, but will allow the average to “react” to the more recent data. It applies a proportion of the forecast error back to the forecast to come up with the new estimate. By setting a Smoothing Coefficient you can make the system react quicker. However, by following the random movements of the actual volumes too closely you can increase the degree of error over time. This needs to be balanced with the need to react to structural movements in the forecast.
Single exponential smoothing A forecasting method used where the volume is relatively fixed over time. Exponential smoothing gives an “average” of all the previous data, but will allow the average to “react” to the more recent data. It applies a proportion of the forecast error back to the forecast to come up with the new estimate. By setting a Smoothing Coefficient you can make the system react quicker. However, by following the random movements of the actual volumes too closely you can increase the degree of error over time. This needs to be balanced with the need to react to structural movements in the forecast.
![]() Double exponential smoothing A forecasting method that extends the single exponential smoothing. It is appropriate where the rate of increase is stable over time. The smoothing technique applied to level demand is applied to both the level and trend.
Double exponential smoothing A forecasting method that extends the single exponential smoothing. It is appropriate where the rate of increase is stable over time. The smoothing technique applied to level demand is applied to both the level and trend.
![]() Holt winters A forecasting method that extends exponential smoothing to the problem of seasonality. The volume in a given period is first determined as the exponentially smoothed level. The exponentially smoothed rate of increase or decrease is then applied. The new level is then adjusted up or down by a seasonality factor. For example, you might consider that there are 12 periods in the cycle. You might expect that the sales in June should be adjusted up by 120 percent. The observation in any given period will give forecast errors for Level, Rate, and Seasonality factors that are used to determine the new estimates. An example of a highly seasonal commodity might be ice cream. It would be expected that sales of ice cream would be greater in summer months than in winter.
Holt winters A forecasting method that extends exponential smoothing to the problem of seasonality. The volume in a given period is first determined as the exponentially smoothed level. The exponentially smoothed rate of increase or decrease is then applied. The new level is then adjusted up or down by a seasonality factor. For example, you might consider that there are 12 periods in the cycle. You might expect that the sales in June should be adjusted up by 120 percent. The observation in any given period will give forecast errors for Level, Rate, and Seasonality factors that are used to determine the new estimates. An example of a highly seasonal commodity might be ice cream. It would be expected that sales of ice cream would be greater in summer months than in winter.
If the Parameters box appears, you will need to provide the smoothing coefficients for the method you have chosen.
As an alternative to selecting a specific forecasting method, you can allow the system to automatically determine the best method to use. This is referred to as the automatic method. An expert system checks the forecast performance of each algorithm based on historical data.
Specifying the Forecast Level
From the Forecast Levels tab, double-click a dimension to view its levels and select a level. Forecast errors will tend to be less as you forecast at a higher and higher level. For example, for Neptune there will be a higher forecast error for the forecasts by distribution center and desktop product family than there will be for the desktop range as a whole. The errors higher up the hierarchy tend to cancel each other out. However, the local nuance can be lost if the aggregate forecast is allocated down.
Specifying the Allocation Rule
Allocation rules specify how volume data that has originated at different levels of aggregation are allocated upward or downward in the hierarchy when forecasts are changed or combined. You can choose from among the following allocation rules:
![]() Allocate based on forecasted weights aggregated from the lowest level. Volumes are allocated based on the volumes at the lowest level or aggregated from the lowest level.
Allocate based on forecasted weights aggregated from the lowest level. Volumes are allocated based on the volumes at the lowest level or aggregated from the lowest level.
![]() Allocate based on a forecast at each level. A forecast is done at each level below the level specified. Allocations from higher levels are based on the forecast at the lower level. The allocation is stepped through the levels downward. Allocations above the specified level are done by aggregating the forecast at the specified level.
Allocate based on a forecast at each level. A forecast is done at each level below the level specified. Allocations from higher levels are based on the forecast at the lower level. The allocation is stepped through the levels downward. Allocations above the specified level are done by aggregating the forecast at the specified level.
![]() Allocate based on historical weights for a user-specified period.
Allocate based on historical weights for a user-specified period.
Tracking the Progress of a Demand Plan
Demand Planning is a workflow-driven application. The Demand Plan Administrator can track the progress of a demand plan through its lifecycle.
![]() Downloading data from the Planning Server initiates the forecast cycle by loading data from the Planning Server into the Express database.
Downloading data from the Planning Server initiates the forecast cycle by loading data from the Planning Server into the Express database.
![]() Forecasting data and distributing to planners creates the baseline forecast in the shared database and distributes data to planners, based on their data assignments.
Forecasting data and distributing to planners creates the baseline forecast in the shared database and distributes data to planners, based on their data assignments.
![]() Collecting forecast data from planners consolidates the forecasts that have been submitted by planners to the shared database.
Collecting forecast data from planners consolidates the forecasts that have been submitted by planners to the shared database.
![]() Uploading the final forecast to the Planning Server loads the finalized forecasts from the Express shared database into the Planning Server.
Uploading the final forecast to the Planning Server loads the finalized forecasts from the Express shared database into the Planning Server.
To review the progress of a plan choose the name of the demand plan from the navigation list. The list of Workflow activities will be displayed. You can initiate the activities from this list by selecting the activity in the stage column and choosing Apply.
A batch log is also created when any of these tasks are performed. You can review the batch log by choosing Batch Log from the navigator.
Understanding the Demand Planning Cycle
Now that a demand plan has been defined you can push it through its lifecycle. The cycle starts by running a collection to gather the time series data. The data is gathered into the Planning Server and stored in the shared database. When the forecast is distributed to the planners, they can review baseline forecast, make adjustments, and submit their forecasts back for the planning manager to review. He or she can then review and adjust the forecast before publishing it to the planning server. Figure 9-6 illustrates the lifecycle of a demand plan.

FIGURE 9-6. The planning cycle
Understanding Where the Source Data Comes from
Before the demand plans are available for use, you need to collect the data from the source systems into the Planning Server. As delivered, Oracle Demand Planning can collect data from Oracle Applications, Releases 10.7,11,11i. However, the collections are made through a set of insulating views. These views are listed in the following table.

Running Collections
This will take the data and place it into the staging tables. Users will still need to run the pull programs to get the data from the fact tables into the destination tables on the Planning Server. To collect the data, navigate to the Collect Data function in the Collections menu.
NOTE
There is a profile option that enables you to collect all the data at once—this profile is MSD One Step Collections.
Choose the type of data you wish to collect. You will be taken to a concurrent submission screen. You can collect from Shipping Data, Booking Data, Manufacturing Forecasts, Sales Forecasts, and Sales Opportunities.
When you pull time data, you have the choice of Financial, Manufacturing, and Gregorian calendars. You will have to run the program once for every manufacturing calendar you have defined and once for every financial calendar you have defined.
This will have placed the data in the staging tables and you need to run the pull programs before you can define or generate a demand plan.
Pulling Information from the Planning Server
The Demand Planning Integration Administrator submits the jobs that collect data from the source systems into the Planning Server. They also submit the jobs that pull from the Planning Server into the shared database. To submit these jobs, sign on as Demand Planning Administrator. Choose Collection to get from source systems. Choose Pull to get from the Planning Server to the shared database.
The Planning Server stores the collected time series data from many sources, including
![]() Historical shipment or booking data from transactional systems at the lowest level.
Historical shipment or booking data from transactional systems at the lowest level.
![]() Forecast data from Sales, Manufacturing, Supply Chain, or third party at any level of aggregation.
Forecast data from Sales, Manufacturing, Supply Chain, or third party at any level of aggregation.
![]() Scenario definitions. A scenario is a different forecast and costing outcome for potentially overlapping time horizon.
Scenario definitions. A scenario is a different forecast and costing outcome for potentially overlapping time horizon.
![]() The Levels and Dimensions by which you will be “slicing and dicing” your forecast data.
The Levels and Dimensions by which you will be “slicing and dicing” your forecast data.
You could also collect from other data sources. You will need to write to the staging tables in the Planning Server. Other data sources might include non-Oracle Applications or syndicated sources such as Nielsen or IRI.
Reviewing Baseline Forecasts
Demand Planning sits on top of the Express Technologies. These are a set of multidimensional Online Analytical Processing (OLAP) tools. You can compare your plans with the constraint-based plans from Oracle Advanced Planning and Scheduling. From within the Documents folder in the Navigator, open the Forecast report. You can change the column widths. You can drill down by clicking a detail row and drill up by clicking the parent row. You can pull variables from the table to the page variables where they act as selection criteria. You can rotate the data by dragging the variable icon (the plate with raised bumps) to the column bar.
The baseline forecast serves as the initial estimate of is demand. A forecast is created for each scenario downloaded, and a set of forecast rules downloaded from the Planning Server. The forecast rules are a combination of forecast method, level, calendar, and horizon. You might decide to create a scenario for a new competitor entering the market and another for a new technology making one of your product lines obsolete.
Adjusting Forecasts
Individual planners have a worksheet interface to review and adjust the forecast. The Express worksheets are highly tuned to analyzing data at different levels of aggregation. Adjustments can be made by changing forecasting parameters or moving forecast volumes. These adjustments enable the planner to simulate possible changes. There are predefined reports available to check results as well as the capability to create ad hoc reports. Figure 9-7 is an example of the worksheet.

FIGURE 9-7. Working with forecasts in Demand Planning
To access the demand-planning environment, log in and choose the demand planner responsibility. The application will appear with a list of demand plans. Choose a demand plan and start demand planning. You will be in the Demand Planning page. The Demand Planning page consists of a Report and Graph workspace and a Worksheet workspace. By choosing Modify Data from the toolbar or clicking on the cells in the worksheet the planner can edit the forecast. Forecasts can be entered in units or currency. You can increase or decrease by an amount or percentage. You can update a block of cells by selecting the cells and selecting the Modify Data button from the Documents toolbar. You can specify a value or increase or decrease by a specified percentage. You can create rich history of the changes by clicking the Change Reason icon on the toolbar, represented as a notepad. The activity log will show all changes to the forecast quantity. Forecast changes can be made at any level in the hierarchy and will be spread down and rolled up.
NOTE
If you make a change at a high level in a hierarchy and then make a change lower down that hierarchy, the system will prompt you to recalculate to ensure there are no conflicts in the data.
You can lock one or more cells so that their values do not change when data is recalculated. Locking a cell protects the value in the cell as well as the values in all cells that are its children. To lock a cell or cells, highlight the area that you want to lock and click the LockCell/Unlock Cell button on the Document toolbar or right-click and choose Lock Cell from the pop-up menu. You can cut and paste between cells and between worksheets, if the selected block is of the same shape as the destination and the cells are not protected.
Submitting Forecasts
When a forecast is ready, the planner submits the final values to the shared database. If a demand plan includes multiple scenarios, planners submit a forecast for each scenario. To submit a forecast, the planner selects the worksheet that represents his best estimate of future demand and chooses Submit from the Documents toolbar. The forecast is then posted through to the shared database. If you are submitting forecasts for a given scenario, you will need to choose a scenario from the list box.
Reviewing Aggregate Forecasts
The planning manager reviews data that has been submitted to the shared database by individual planners. They might make further judgmental adjustments. The planning manager is working in the shared database. When the planning manager makes his submission, the forecast for the scenario is posted back to the planning server.
Publishing Forecasts to the Source Instance
The forecast data is published from the Planning Server to the source instance. This integrates the final estimate of demand into the transaction system. The Publish Forecast window specifies the parameters for publishing. You can publish an entire forecast scenario, or you can use optional filtering parameters to limit the data. Figure 9-8 is an example of publishing a forecast.

FIGURE 9-8. Demand plan publication
In the Demand Planning Administrator responsibility, choose the Publish Forecast option. You can publish from a scenario within a demand plan into a forecast within a forecast set in the source system. You can restrict the level of the forecast that is published to the source system.
Getting Feedback
Oracle Demand Planning includes a variety of tools for getting feedback and monitoring results at various stages of the demand planning process. You can
![]() Generate exception reports based on a variety of parameters
Generate exception reports based on a variety of parameters
![]() Run reports to check forecast accuracy, or set up alerts that will notify them of specific events
Run reports to check forecast accuracy, or set up alerts that will notify them of specific events
![]() Compare actual results against forecasts, or compare forecasts for various scenarios against one another
Compare actual results against forecasts, or compare forecasts for various scenarios against one another
![]() Refer back to reports, graphs, and forecast worksheets that they have saved in their personal database
Refer back to reports, graphs, and forecast worksheets that they have saved in their personal database
Predefined Reports
Demand Planning comes with a set of predefined reports. Predefined reports are selected and set up by the Demand Planning Administrator. Reports include
![]() Comparison Highlight similarities or differences between products, periods, or geographies.
Comparison Highlight similarities or differences between products, periods, or geographies.
![]() Distribution Focus on sales operations information such as slow moving items or items not selling.
Distribution Focus on sales operations information such as slow moving items or items not selling.
![]() Exception A set of Pereto reports to focus attention on the top 20% of your products or to highlight your problems.
Exception A set of Pereto reports to focus attention on the top 20% of your products or to highlight your problems.
![]() Forecast Used for reporting forecast accuracy.
Forecast Used for reporting forecast accuracy.
![]() Growth Shows the difference in a selected measure between two time periods.
Growth Shows the difference in a selected measure between two time periods.
![]() Quota Shows performance against a sales target.
Quota Shows performance against a sales target.
![]() Ranking Shows top dimension values such as products or geographies for a specified measure.
Ranking Shows top dimension values such as products or geographies for a specified measure.
![]() Review Sales operations focused report or account and quota review.
Review Sales operations focused report or account and quota review.
![]() Trend Shows activity over time for a specified measure. This can be smoothed using a moving average.
Trend Shows activity over time for a specified measure. This can be smoothed using a moving average.
The documents are grouped into folders that appear in the Navigation list below folders that you have created to store your personal documents. If there are no user-defined folders, the folders for predefined reports appear below individual documents.
To use a predefined report, double-click the Document Type after navigating to the correct folder. The document is displayed in the Report and Graph workspace. The data that it contains and the type of view (report or graph) are determined by the current settings. You can change the values displayed in the report by choosing Settings in the report heading. This displays the settings script that is close to natural language that you can use to select new values or change the type of view from report to graph.
Ad Hoc Reports
To generate an ad hoc report, click New on the Navigation toolbar and then choose New Graph or New Report. You can also right-click Documents in the navigation list. Choose whether you want the report based on the default or a named report or graph. Choose the dimension values (your slice of data) and measures (history, forecast, or custom measure) you want to report on. For example, you might want to report on history versus forecast for the West Coast of America for the year 2000.
You can arrange the dimension values for reporting by dragging and dropping the bar to the side of the dimension level name.
Defining Alerts
Alerts can be set up by planners or plan managers. To set up an alert, click the New icon and select New Alert. The Alert Wizard will be displayed. Define an exception condition such as:
"Select Geography within Geography:Country by Value
where Difference between Sales and Customer Forecast
is greater than the value 100"
Click the Next button and complete the selector form. First select Geography. Click the Selector button and select a value or select all by clicking the double-arrow button; then click OK. Repeat for Ship From Location, Product, and Time. Finally, define who will receive the messages.
Summary
This chapter explained the purpose of Demand Planning and the differences in the technology that underpins Demand Planning, covered the division of responsibilities in Demand Planning and the seeded roles, and looked at setting up Demand Planning—including planning dimensions, hierarchies, and levels—and explained how to define a demand plan, its inputs, and scenarios. The chapter then reviewed the administration of demand plans and how they are tracked, from pulling information from source systems to publishing the results back. Finally, the user environment for demand planners and how they get feedback on their plans was covered.