
Remember how in Chapter 4 we pointed out that the work break structure (WBS) breaks the project down into deliverables rather than activities? Well now comes the time when we define the actual activities needed to be performed to complete the project. As you may have guessed, we will use the lowest level deliverables from the WBS—the work packages—as inspiration. Creating the project schedule is incredibly important because once your sponsor approves it, the schedule will serve as a baseline for all the project work you and your team perform. You will be judged based on how well your project is able to stay on schedule as well as on the project’s cost and quality
A realistic project schedule considers several possible limitations. First, there may be a logical order in which some activities can be performed and we address this first by sequencing the activities. Second, each activity takes a certain amount of time and we cover this by estimating how long each activity will take. We will show the schedule on an easy to read Gantt chart. Third, we may not have all of the specific people we need exactly when we need them. We address this by assigning workers to each activity and then looking at all of the assignments to see if anyone is overloaded. If they are, we try to reduce the problem by comparing the assignments with the schedule. Fourth, some project schedules are limited by money coming in and we address that in the next chapter.
The purpose of this chapter is to help you:
1. Create a project schedule by defining and sequencing work activities into a network schedule and then identifying the critical path.
2. Communicate the project schedule simply by using a Gantt chart.
3. Assign a worker to each activity, identify where worker demand is overloaded, and resolve some of those overloads by “playing Tetris.”
During this stage of planning, it is essential that you involve the people who will actually be performing the project work, whether they are team members, subject matter experts, or others. Whoever it is needs to have a high degree of understanding about what the project entails. By looking at each work package, they should have a good idea of what needs to be done to complete each deliverable according to the acceptance criteria. In this way, you will generate a lengthy list of all the various activities that comprise your project.
List each activity on its own post-it note, and make sure that each activity has a name (the more self-explanatory, the better!) that is short and begins with a verb. The more people you involve in this process, the more thorough your list will be. And although it may be difficult or time-consuming to involve many people—especially from a wide variety of disciplines or departments—it will be time and energy well-spent. Remember, your schedule will be based on these activities, so any forgotten activities risk delaying your project and making you look bad! Exhibit 5.1 is an example of an activity list.
Activity List
• Purchase wood (PW)
• String electrical wires (SEW)
• Install railings (IR)
• Assemble ramp (AR)
• Hang paneling (HP)
• Install fixtures (IF)
• Paint all wood (PAW)
• Turn on electricity (TOE)
Once your activities have been defined, it is time to sequence them. Again, let the more knowledgeable members guide the rest of the team through this process. Since each activity is listed on a post-it note, use a table or wall to begin putting them in logical order; put any activities that can start immediately (in other words, they don’t depend on any other project activities to be completed) at the far left of your table or wall. Put activities that you know will take place toward the end of the project at the far right. Using the collective judgment and experience of the team, determine logical orders for each and every activity you have. Show the relationships between activities with arrows, with the work of the project flowing from left to right chronologically.
Note that each activity can have more than one predecessor activity (which must be performed before it) and/or more than one successor activity (which cannot be performed until after the given activity). Keep in mind that you are not yet factoring in such logic as how many workers you have or how many activities can realistically be performed simultaneously. For now, it is important that you sequence your activities so that each activity takes place as soon as possible, based only on the activities that are its logical predecessors. If more than one activity can begin right away (with no predecessor), create a post-it note that just says start and have arrows from it go to the activities that can start immediately. The same holds true at the end: if there is more than one activity with nothing following, create a post-it note that says end. When you calculate the schedule you will understand the value of having a single start and end. An example of this type of sequencing logic for a small project is shown in Exhibit 5.2.
On large projects you will use scheduling software such as Microsoft Project. However, even then, project software requires you to be a knowledgeable user and to identify predecessor and successor activities. Software can do a good deal of the tedious part of scheduling for you, but it cannot read your mind! You, as the project manager, need to understand the logic behind the sequencing of your activities. That is important both now, as you are creating a schedule, and throughout the life cycle of your project. When trade-offs have to be made or a project sped up, it is your understanding of the logical sequence and dependencies of activities that will help you make the best decisions for your team and project.
Small Project Logical Order of Activities

Once your activities have been sequenced, it is time to estimate how long each one will take. Yet again, the people who create the estimates should be the ones who will be performing—and therefore understand better than anyone else—the activities at hand. That said, you as the project manager need to have a good enough understanding of the activities or to at least seek a second opinion if you think there’s a chance the estimates are incorrect. Some workers may overestimate the amount of time necessary in order to pad their estimates; these could unnecessarily slow down your project or even prevent you from getting the bid if you are competing for project work. On the other hand, some workers may be overly optimistic about how quickly they can accomplish certain activities; if unchecked, this could set you up for the stress of falling behind schedule and disappointing your customers and sponsor. Some activities will be much shorter than others, but it is important you use the same unit of time for all. So, decide in advance if you will use weeks, workdays, hours, etc. Conflicting units of time make scheduling much more difficult and accident-prone. Exhibit 5.3 continues the example started previously with time estimates in work hours shown for each activity in the bottom center of each square. In some fields, such as construction, there are professionally developed standards as to how long certain activities take, scalable to the size of the job. American Physical Plant Association, International Facility Manager’s Association, and others have this information documented in their benchmarking data. If your project is in an industry that has standards such as these, by all means use them!
As an appendage to your activity duration estimates, it is good practice to include any assumptions you made in calculating them, as well as your degree of certainty in the estimates. For example, in creating your estimate for placing electrical wires, did you assume all your diagrams for the building were accurate and up-to-date or did you assume some of the diagrams contain errors, leading you to include additional time to account for the expected difficulties? You may also document activity attributes, comprised of such information as predecessor and successor activities, resource requirements, constraints, etc. All this supplementary information will further help you in our next step: developing the project schedule.
Developing the Project Schedule
Now that you have created your list of activities, have sequenced them, and have estimated the time to perform each, you are ready to create your project schedule. We will use the coding system in the lower right corner of Exhibit 5.3 to keep things straight. Each activity name, abbreviation, and estimated duration is put in its own box (also referred to as a node in PM terminology).
The outside four corners of each activity box will represent the activity’s early start (ES), early finish (EF), late start (LS), and late finish (LF) times (you can use hours, days, weeks, etc. as long as you are consistent throughout). These labels refer to the soonest or latest time an activity can begin and end and are used to determine the project’s critical path. We will also calculate float and place that to the immediate left of each activity box. Float, also called slack, is the amount of flexibility a particular activity has in the schedule. In other words, it is the length of time the activity can be delayed from its early start without delaying the project. As you will see, activities on the critical path will have a float of 0, which means they cannot be delayed without causing a delay to the project. We will show an example in Exhibit 5.4.
If we used software such as Microsoft Project, we would use calendar dates taking holidays and weekends into consideration. When we calculate by hand, we simplify. We say that any activity that can start right away can begin after zero days. This would work just as well if our schedule was in hours or weeks. We will use the two-pass method to calculate our schedule.
First Pass Complete

Purchase wood can start right away (after zero days) and it takes four days to complete, so the early finish is four days. String electrical wires start right off at zero and takes eight days, so it has eight as an early finish time. Now an activity that has only one predecessor such as assemble ramp, can begin as soon as the predecessor is done. In this case, assemble ramp can start after four days and takes three days, so the earliest it can be done is after seven total days. That is pretty straightforward. However, when an activity has more than one predecessor, you need to allow enough time for each predecessor to be done. For example, hang paneling cannot start until you have purchased the wood and strung the electrical wires behind where you plan to hang the paneling. Therefore, hang paneling cannot begin until after day 8, when the slower of these two predecessor activities ends. Since it takes seven days to hang the paneling, this activity can be completed after 15 days. We complete our forward or first pass through the network using this same logic on all our activities. The project end occurs when the last activity is complete—in this case after 20 days. This is shown in Exhibit 5.3.
The first pass showed us how soon each activity could finish. Now we work backward asking how late each activity could finish and then how late it could start. Since the project will end after 20 days, the two activities that are last both need to end by then. Therefore, both paint all wood and turn on electricity are shown with a late finish in their lower right of 20.
We then subtract the estimated durations from the late finish to calculate the late start. For example, paint all wood must end by 20, it takes five days, so it must start no later than after day 15. Turn on electricity takes only one hour and since it needs to be on by day 20, we must start turning it on no later than day 19.
When there is more than one arrow out of an activity, you must allow enough time for each path of activities that follow to be complete. When we did our first pass going forward, if there were multiple predecessor activities, we deferred to the time of the predecessor activity that took longest to complete. Going backward is just the opposite, so we choose the shorter time because it allows all successor activities enough time to finish. For example, all three activities of install railings, assemble ramp, and hang paneling depend on purchasing the wood. Install railings must start no later than 13. Assemble ramp must start no later than 12. Hang paneling must start no later than 8. Choose the smallest number, 8, to allow all following activities enough time. If you chose any number larger than 8, hang paneling would be late. See Exhibit 5.4 to see the second pass complete.
Second Pass Complete

The combination of sequencing and duration estimating give us the critical path—that is the longest series of activities in the project. If we want to complete the project faster, we need to speed up something on the critical path. Conversely, if anything on the critical path is delayed, the entire project is delayed. We now can use our schedule to determine which activities must be conducted exactly when scheduled (those on the critical path) and which ones have flexibility. Again, this flexibility is called float or slack and is shown to the immediate left of the activity. Float is calculated by:
Late Start (LS) – Early Start (ES) = Float
For example, assemble ramp could start as soon as four days or could be delayed to start as late as 12 days with no impact on the rest of the schedule. Therefore, assemble ramp float is calculated as12 − 4 = 8.
Critical Path Identified

The sequence of activities from start to finish with zero slack is called the critical path and is usually marked vividly. The float for each activity and the critical path are shown on Exhibit 5.5.
Showing Your Schedule on a Gantt Chart
We need the logic of the network diagram as shown above to create a project schedule, but it is not always the best way to communicate the schedule. For that we use a simple bar chart called a Gantt chart. To create a Gantt chart, each activity will have its own row, so for our example project, we show purchase wood, string electrical wires, and so on. We need to create a horizontal scale large enough to read but small enough to show the entire project and consistent throughout, so people looking at it will get the correct impression.
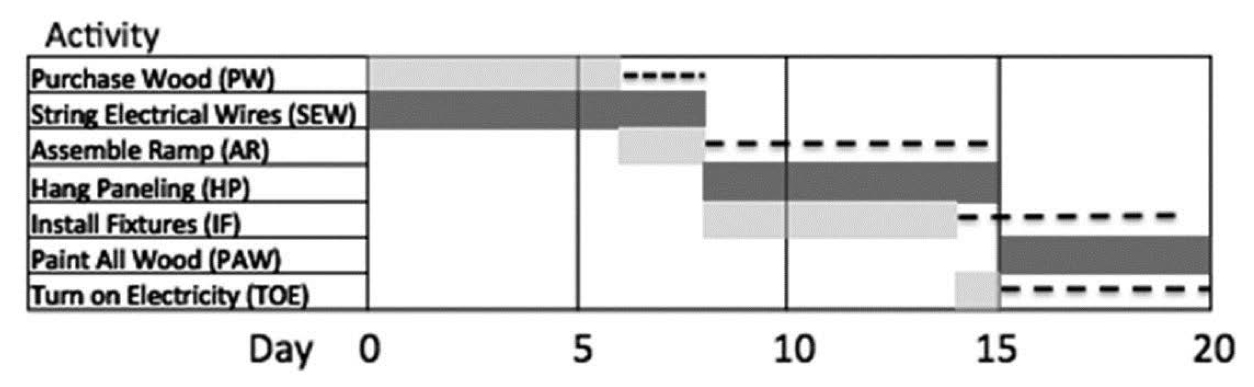
We usually mark critical path activities in red or in bold if our work is black and white so people notice them. We draw a bar from early start to early finish and mark the times to make it easy for people to read. We do this first for all critical path activities. Then we use blue or nonbold for noncritical activities. We front-load the schedule, meaning we mark early start and finish times as the endpoints of our bars. Finally, we show the float for the noncritical activities. (Remember, critical activities have no float.) One easy way to do this is extend a dotted black line out to the late finish for the activity as that represents the end of its float. The Gantt chart for this example project is shown in Exhibit 5.6.
Gantt charts work well whether you are using waterfall, agile, or a hybrid project life cycle. However, remember that when working on Agile projects, a person creates their schedule one sprint at a time. One simple example of a roadmap in the Agile world is the schedule for a musician’s concert tour as shown in Exhibit 5.7. The idea is to make sure that there are timelines along with any impediments highlighted for easy tracking, ownership, and accountability at one glance. Here is a roadmap with two tabs in a simple excel spreadsheet. The first tab shows three sprints without roadblocks and the second tab shows tasks that need to be completed before sprints.
Gantt Chart
Agile Example of Gantt Chart
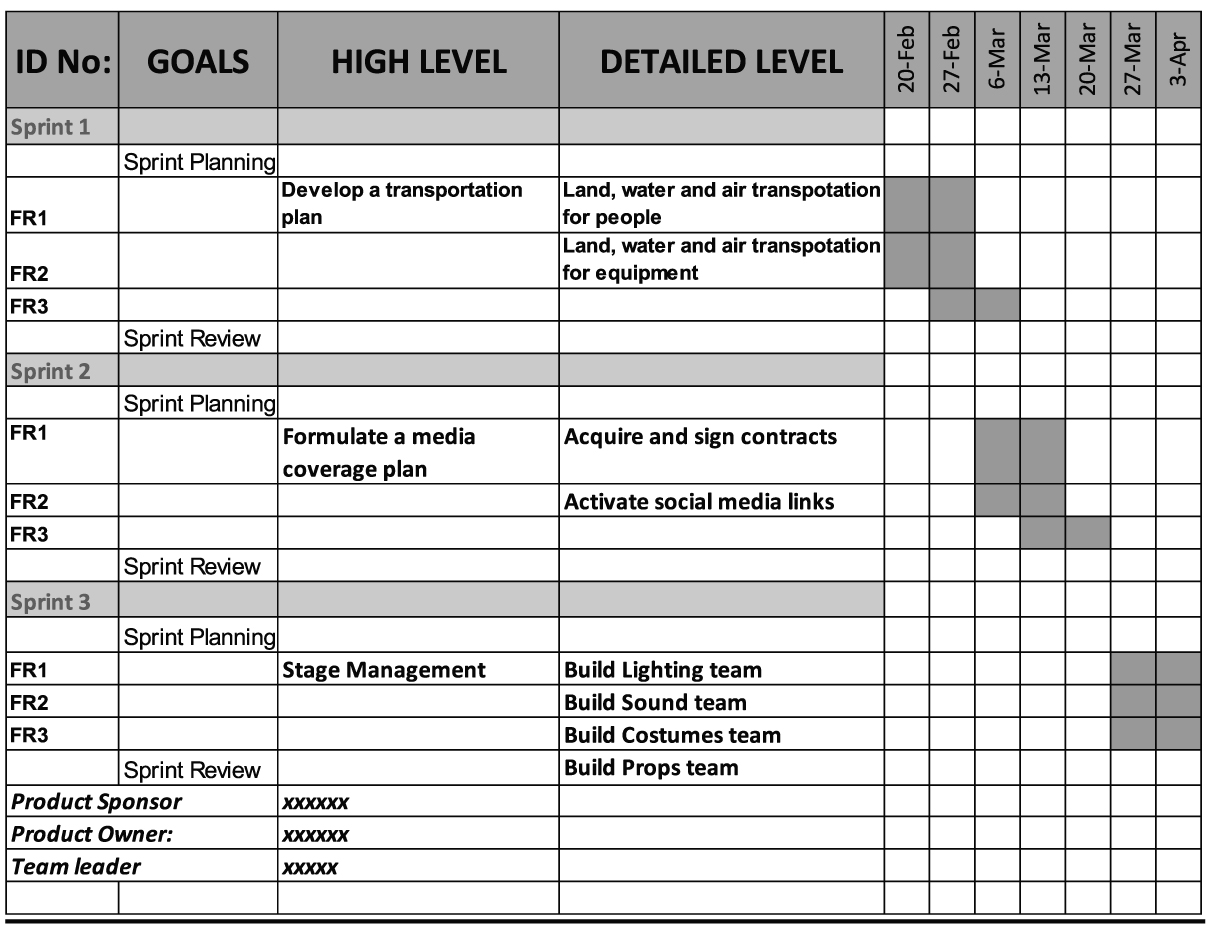
Source: Raji Sivaraman

Once you have identified all the work activities needed to create your project deliverables, you will want to assign responsibility for completing each. Further, you will want to ensure that all necessary communication and approvals take place. An easy way to do this is with a matrix called a RACI Chart. RACI is an acronym standing for responsible, accountable, consult, and inform.
A good practice is to have only one person accountable for the results of a given work activity. That may or may not be the person who is responsible for performing the work. Frequently the project manager is accountable for many of the activities even though other team members may be responsible for performing some of the tasks. Similarly, on a few major items, the sponsor may have accountability while the project manager has responsibility. A myriad of other stakeholders may need to be consulted for their opinions or at least informed of what transpires.
When constructing a RACI chart, the first column is the name of the activities. The remaining columns are for the various stakeholders. In our example, we will keep it simple with just the sponsor, project manager, and two core team members. Frequently, there will be quite a few more stakeholders. Sometimes a stakeholder has no involvement and no need to be informed of a particular activity such as Bill on string electrical wires as shown in Exhibit 5.8.

Identifying Resource Overloads
Remember that there are multiple constraints that can limit how fast a project can be completed. The emerging schedule you have created with a network diagram and then shown on a Gantt chart is based upon two of those limiting factors: the estimated duration of each individual activity and the logical order in which you can perform them. We now turn our attention to a third constraint: the availability of the right workers when you need them.
We will continue to use the same example. For simplicity sake let’s say we have two workers and either can do any of the activities. We now want to discover if we have scheduled more than two workers at the same time and, if so, what can we do about it. We will use the same scale as the Gantt chart and construct a histogram showing the demand for workers directly beneath the Gantt. When we glance at the Gantt, it appears that sometimes we might have scheduled three workers, so we will make our histogram three workers high.
We begin by placing the critical path activities on the bottom row. The reason for this is we might have to move when some activities are scheduled, and we know we do not want to change the critical path as that would delay the entire project. The first activity on the critical path is string electrical wires (SEW). Therefore, the first block of work shown is one worker high by eight hours long and (SEW) is shown in that block. That is followed by the other two critical path activities. Now I begin to build up. Purchase wood also takes one worker and its early start and early finish go from time zero to four. Assemble ramp follows at four to seven. Install railings would need a third worker from four to six, so it is built up in the third row. Install fixtures and turn on electricity would also be on the second row above hang paneling. Finally, paint all wood will be in the row for the second worker from 11 to 16.
We have an overload shown with need for a third worker from hour 4 to 6. Now remember we scheduled everything as early as possible. Therefore, we cannot move anything earlier, but we can move activities later if they have enough float and still complete the project on time. To do this we essentially “play Tetris.” In that game, you try to fit shapes into spaces. We will try to delay activities while remembering their logical order and amount of float. In our example, if we delay the start of install railings three days, it can be scheduled for the second worker after assemble ramp is complete. That would mean we need to delay install fixtures and turn on electricity one day each, as there was only space for one day after assemble ramp (day 8) in the original schedule. Each of these activities had more float than the one or two days we used up by delaying them. This is all shown in Exhibit 5.9.
Playing Tetris to Resolve Worker Overloads

On many projects, at least some of the overloads can be resolved in this manner. Even when all of the overloads cannot be fully resolved this way, at least you now know exactly which activities, which people, and which times of your schedule are in conflict. You can consider looking at alternative means to further resolve conflicts. Finally, you may need to go to your sponsor, armed with specific information and proof that you did what you could to try to resolve the conflicts in advance.
If you have not been doing so already, at this stage in project planning you will almost certainly want to use project software such as Microsoft Project. As long as you have accurate data to provide, the software will help you aggregate information from many of your planning documents, including:
• Activity List
• Activity Duration Estimates
• Activity Attributes
• Project Schedule Network Diagrams—the logical relationships of predecessors and successors you came up with during Sequence Activities
• Activity Resource Requirements—the types and quantities of resources needed for each activity
• Resource Calendars—include typical days and hours worked and individual workers’ schedules (vacation time, maternity leave, etc.)
• Project Scope Statement—we include this because it details the constraints and assumptions that may affect our project
• Risk Register (you created this in Chapter 4)
• Project Staff Assignments—specify which resources are assigned to each activity
In Summary
You will use the work packages from your WBS to determine the actual activities that need to be accomplished to complete your project and how long each activity will take. Logic will help you decide the order in which to accomplish the various activities, and the sequence of activities that lasts the longest from start to finish will be your critical path. Throughout the execution of your project you must take care not to delay activities on the critical path unless absolutely necessary since any change to the critical path will delay your overall project.
Only after you have decided on the order of activities will you begin assigning them to your human resources. If your schedule shows more activities taking place simultaneously than your workforce can accommodate, you have a resource overload and must find a way to adapt the schedule—if at all possible, without making changes to the critical path as not to delay the project. Use the two-pass method detailed in this chapter to determine the critical path and float/slack of all noncritical activities.
1. How will you create a project schedule by defining and sequencing work activities into a network schedule and then identifying the critical path?
2. How will you communicate the project schedule simply by using a Gantt chart?
3. How will you assign a worker to each activity, identify where worker demand is overloaded, and resolve some of those overloads by “playing Tetris”?