Chapter 7: Measuring Utilization of Services
Review: Basics of Medicare Claims Data
Algorithms: Delimit Claims by Continuously Enrolled Beneficiary Population
Algorithms: Measuring Evaluation and Management (E&M) Utilization
Algorithms: Measuring Inpatient Hospital Utilization
Algorithms: Measuring Emergency Department Utilization
Algorithms: Measuring Utilization of Ambulance Services
Algorithms: Measuring Outpatient Visit Information
Algorithms: Measuring Utilization of SNF, Home Health Agency, and Hospice Care
Service utilization is an important component of our work because measuring the use of healthcare services is necessary to determine things like patterns of care, access to care, resource use, and quality of care. Our research programming project requires us to calculate utilization measurements to evaluate the outcomes of a program that is designed to incentivize providers to reduce costs and improve quality. Measuring the utilization characteristics of our provider population helps us to understand the lay of the land so that we can better comment on why an incentive payment may or may not have worked. For example, perhaps an incentive payment did not work because of geographic differences in how medicine is practiced. If that were the case, one outcome of our evaluation would be to recommend investigating medical education and methods of practice in order to reduce costs.
Therefore, we will execute some relatively straightforward utilization algorithms in this chapter, both for the sake of performing the calculations planned for this chapter as well as setting up measurements calculated in later chapters, such as payment and quality outcomes for certain chronic conditions. To these ends, in this chapter, we will code algorithms to do the following:
• Delimit our administrative claims data to include only those claims for the population of interest, those continuously enrolled beneficiaries formed in Chapter 6.
• Measure evaluation and management (E&M) visits in a physician office setting.
• Measure inpatient hospital utilization.
• Measure the professional component of emergency department (ED) services.
• Measure the utilization of ambulance services using the Part B carrier data.
• Measure outpatient visit utilization.
• Measure utilization of skilled nursing facility (SNF), home health, and hospice care.
As discussed in earlier chapters, the online companion to this book is at http://support.sas.com/publishing/authors/gillingham.html. Here, you will find information on creating dummy source data, the code in this and subsequent chapters, as well as answers to the exercises in this book. I expect you to visit the book’s website, create your own dummy source data, and run the code yourself.
Before we begin, we will review some basics about the administrative claims data that we will use for our utilization work.
In Chapter 2 through Chapter 5, we discussed the following characteristics of programming with Medicare administrative data (note that this review is also relevant for Chapters 8, 9, and 10, although we will not repeat it in those chapters):
• Using Medicare claims data is not intuitive. The primary purpose of the Medicare payment system is not to create data for research, but to adjudicate and pay claims. This fact has implications for using our administrative data files and means we must understand the Medicare program to use Medicare claims data effectively.
• Data exist for claims paid by both Medicare Part A and Part B. The Medicare claims files are provided separately for final action Part B carrier, durable medical equipment (DME), outpatient, inpatient, skilled nursing facility (SNF), home health, and hospice services.
• The Part B carrier data set is most commonly associated with claims filed for services provided in a doctor’s office, like a checkup. However, the carrier data set also includes claims submitted by clinical social workers, chiropractors, ambulance services, nurse practitioners and physician assistants. In addition, the file also includes claims for services performed outside of a doctor’s office, such as ambulatory surgical centers, hospitals, and hospital emergency rooms. In general, the carrier claims file is the largest Medicare claims data set used for research purposes.
• The DME file includes paid claims for wheelchairs and walkers, hospital beds, blood glucose monitors and related supplies, canes and crutches, splints, prosthetics, orthotics, respiratory devices like oxygen equipment and related supplies, and dialysis equipment and supplies.
• The outpatient claims data set contains final action claims filed by institutional outpatient providers. Often users think of these providers as hospital outpatient departments. However, the file also includes the claims of other types of institutional outpatient providers, like ambulatory surgical centers, outpatient rehabilitation facilities, rural health clinics, and even community mental health centers.
• The inpatient claims data set contains final action claims submitted by long stay and short stay inpatient hospitals for the reimbursement of their facility costs, including things like room charges and even some drugs provided during a beneficiary’s hospital stay.
• The SNF file contains paid claims for skilled nursing and rehabilitative care in a SNF setting through specialists such as registered nurses, physical therapists, occupational therapists, speech pathologists, and audiologists. The purpose of this care is to treat, observe, and manage beneficiaries’ conditions, to help beneficiaries leaving an inpatient hospital to improve or maintain their current condition, and to assist beneficiaries in maintaining their independence. Medicare pays for these services for up to 100 days following an inpatient stay of at least 3 days.
• The home health data set contains final action claims filed by Home Health Agencies (HHAs). HHAs are entities that provide skilled professional care in a beneficiary’s home. These agencies provide services to Medicare beneficiaries like occupational therapy, physical therapy, skilled nursing care, and even speech therapy and medical social services like counseling that can help a beneficiary cope with the impacts of their illness on their mental health.
• The hospice claims file contains final action claims data that have been submitted by hospice providers. Hospice programs provide care for Medicare beneficiaries who are terminally ill. Hospice services include physical care provided by doctors and nurses, care provided by hospice aides, occupational therapy, physical therapy, medical equipment and supplies, drugs, and even grief counseling and respite care (care provided in a facility designed to give family members a break from giving care) for the beneficiary’s family members. All hospice services are covered as long as they are related to the beneficiary’s terminal illness (services not related to the terminal illness are covered by other Medicare benefits). Many of these services may involve pain management, and services may take place in a facility or the patient’s home. Hospice care is insured in benefit periods, meaning that a Medicare beneficiary can get hospice care for two 90-day benefit periods and then an unlimited number of 60-day benefit periods.
• At a minimum, the following data elements are commonly required for research programming: Information that identifies the beneficiary, such as a BENE_ID; information about the provider of the service, like the NPI; information that describes when the services occurred (start and end dates); codes that describe the beneficiary (medical diagnosis codes); codes that describe the services (like procedure codes); and information on the amount paid for the services.
• It is prudent to plan effectively prior to beginning your programming project. Part of this planning effort involves creating written specifications that will guide the creation of your SAS algorithms. In addition, it is equally important to execute quality assurance and quality control steps throughout your programming process. These QA/QC procedures include reviewing the written specifications and debugging your SAS code through viewing output and test cases, as well as benchmarking output. Finally, because Medicare administrative data files can be quite large, it is important to keep efficient programming techniques in mind when coding.
In Chapter 5, we submitted a data request to extract all claims and enrollment information for beneficiaries who were treated by the providers in our study population. We received and loaded our data, kept only those variables we wished to use in our study, and created claim-level files that contain both the base claim and revenue center (or claim line) detail in a single record for each claim. In Chapter 6, we used enrollment data to delimit our population to full-year FFS beneficiaries. Now, we wish to bring our claims data to bear on the calculation of utilization measurements. To this end, we will begin our exercise by merging our claims data with the beneficiary population outputted in Chapter 6, eliminating claims for those beneficiaries we are not studying due to their enrollment characteristics. Performing this step early on in our process will reduce the size of the claims files, thereby reducing the execution times of our programs. Once we delimit our claims files, we will begin to research and code our utilization algorithms. We will approach our investigation of utilization using a couple of methods. For services that are defined using procedure codes, we will simply count the unique occurrence of those procedure codes. For example, we can identify E&M services by keying on precise procedure codes. For services identified by the presence of a claim on a unique date or span of dates, we will simply count services by unique start and end dates. For example, we will get a handle on SNF utilization by looking at the start and end dates on claims. While we focus on identifying utilization of services using procedure codes or start and end dates on claims, our SAS code can be easily applied to studying utilization using revenue center codes, or to counting instances of a set of diagnosis codes. What’s more, while we do not explore utilization of durable medical equipment (DME), we could easily apply the code in this book to studying the utilization of DME, like hospital beds and wheelchairs.
The output of the exercises in this chapter will be a set of analytic files at the beneficiary-level used for the remainder of our programming work. Looking forward, we will continue to build on the work performed in Chapters 5 and 6 (and this chapter). In Chapter 8, we will use the output of this chapter in our study of Medicare payment. In Chapter 9, we will combine the study of chronic conditions with the study of quality of care by identifying services that are provided to beneficiaries with diabetes and COPD. As such, we will add an important dimension to our analysis. In Chapter 10, we will end our example project by summarizing our output.
In Step 7.1, we eliminate claims data for beneficiaries outside of our study population of continuously enrolled beneficiaries. We execute this task by performing a single DATA step merge of the claims files loaded in Chapter 5 (except for the DME file, which we do not use for our example research programming project) and the relevant enrollment data (ENR.CONTENR_2010_FNL) created in Chapter 6. Because we wish to eliminate all claims for those beneficiaries who are not in our study population, we must merge the data sets by the beneficiary identifier variable, BENE_ID. In order to make our algorithm run as quickly as possible, we want to be explicit about reading only the BENE_ID into memory when using our beneficiary population data set. In addition, because we can use the same code to delimit each of our seven claims data sets, we code a simple macro called CLM_LOOP that specifies the name of the input claims data set that we are delimiting. Using this macro allows us to avoid coding the below merging algorithms an additional six times. Reducing the total lines of code we have to write saves development time and reduces the potential for coding errors. Note that we perform an “if a” merge, keeping only those records in a given claims data set that match the BENE_ID in our enrollment data.
/* STEP 7.1: DELIMIT CLAIMS DATA BY BENEFICIARY POPULATION */
/* CREATE MACRO LOOP TO PROCESS ALL SEVEN CLAIM TYPES */
%macro clm_loop(clmtyp= );
data utl.&clmtyp._2010_fnl;
merge enr.contenr_2010_fnl(keep=bene_id in=a) etl.&clmtyp._2010(in=b);
by bene_id;
if a;
run;
%mend clm_loop;
%clm_loop(clmtyp=carr);
%clm_loop(clmtyp=dm)
%clm_loop(clmtyp=op);
%clm_loop(clmtyp=ip);
%clm_loop(clmtyp=sn);
%clm_loop(clmtyp=hh);
%clm_loop(clmtyp=hs)
Let’s start our investigation of utilization characteristics for our population of continuously enrolled beneficiaries by measuring the number of E&M services in a physician office setting in 2010. In Step 7.2, we create a macro variable called emcodes that identifies the E&M services we are measuring by looking for certain procedure code1 values beginning with “99” (indicating the “E&M” part of the criteria). We include the following procedure codes in the macro variable emcodes: 99201, 99202, 99203, 99204, 99205, 99211, 99212, 99213, 99214, and 99215. You can learn more about the definitions of these procedure code values online, or by purchasing a procedure code terminology manual. Note that we do not use every procedure code that begins with “99”. For example, procedure code values like 99241 and 99245 identify consultations, but those consultations take place outside of a physician’s office.
/* STEP 7.2: DEFINE E&M CODES */
%let emcodes='99201','99202','99203','99204','99205','99211',
'99212','99213','99214','99215';
Next, in Step 7.3, we search the carrier claims data set (the “physician office setting” part of the criteria) UTL.CARR_2010_FNL for the procedure codes contained in our macro variable emcodes. The carrier claims data has 13 line items, so our data set has 13 procedure codes to search on a per-claim (or per-record) basis. We perform our search by creating an array called HCPCSCD that represents the 13 procedure code variables (HCPCS_CD1-HCPCS_CD13). Then, we create a flag variable called EM_SVC that is set to a value of 1 if the substring of one of the procedure code variables in the array is in the set of procedure codes defined by the macro variable emcodes.2 If such evidence is found, the leave statement ends the processing, and the next record is searched (in other words, we are not counting all E&M services that could be on the claim, but simply searching for evidence of a single E&M service). The outputted data (EM_UTIL) contains the claims in the carrier data set, with a reduced set of variables that define the beneficiary, provider, dates of service, provider, and flag indicating an E&M service was discovered. This output file contains only those records where EM_SVC is equal to 1.
/* STEP 7.3: PULL RECORDS FROM CARRIER FILE BASED ON EMCODES LIST */
data em_util(keep=bene_id em_svc);
set utl.carr_2010_fnl (keep=bene_id expnsdt: prfnpi: hcpcs_cd:);
array hcpcscd(13) hcpcs_cd1-hcpcs_cd13;
em_svc=0;
do i=1 to 13;
if substrn(hcpcscd(i),1,5) in(&emcodes) then do;
em_svc=1;
leave;
end;
end;
if em_svc=1;
run;
In Step 7.4, we de-duplicate the file EM_UTIL by beneficiary identifier, keeping only one record per beneficiary, where there is evidence of an E&M service. We output a permanent file called UTL.EM_UTIL. In other words, this file is a list of beneficiaries for whom we found evidence of an E&M service in our carrier claims data.
/* STEP 7.4: DE-DUPLICATE TO CREATE LIST OF BENES WITH AT LEAST ONE E&M SERVICE */
proc sort data=em_util out=utl.em_util nodupkey;
by bene_id;
run;
Our inpatient data are at the claim level, not the stay level. An inpatient stay can be comprised of many claims. CMS offers a stay-level file, with these claims collapsed to a single stay record, but we did not request this data set. On past projects, I have been responsible for the complicated process of writing specifications to convert inpatient claims into stay-level records. Luckily, stays comprised of multiple claim records are not common. Indeed, stays comprised of multiple claims comprise only one or two percent of all inpatient claims. Therefore, at the risk of slightly over-counting the number of stays in our inpatient data, we will proceed with our discussion of stays as follows:
1. To keep the book at the introductory level, we will identify and keep only those claims in our inpatient data set for acute short-stay hospitals (more on this below).
2. We will treat our inpatient claim records as stays and ignore the fact that we have a very small number of hospital stays in our inpatient data that are comprised of multiple claims. We will also ignore the fact that some records represent transfers to other hospitals.3 (See the Exercises section below for a question on how to collapse multiple claims stays into a single record.) We use these claims to calculate the number of inpatient stays, the length of each stay, and the average length of stay for a beneficiary.
First, in Step 7.5, we focus on delimiting our population to acute short-stay hospitals, as well as keeping only those records with non-negative payment amounts. Medicare distinguishes acute short-stay hospitals between those that are subject to the Medicare Inpatient Prospective Payment System (IPPS) and critical access hospitals (CAHs). IPPS hospitals are paid an amount set prospectively (i.e., determined in advance) based on a patient’s condition (i.e., diagnosis) and treatment (i.e., procedures). These payments are based on the Medicare Severity Diagnosis-Related Groups (MS-DRGs). CAHs are limited to 25 or fewer beds and primarily operate in rural areas. They are paid on the basis of cost (i.e., not prospectively). We delimit our inpatient claims data set to these acute short-stay hospitals because these hospitals are seen as different from hospitals like inpatient rehabilitation, long-term care, and inpatient psychiatric facilities (e.g., CMS’s Hospital Compare4 only reports on acute short-stay hospitals).
/* STEP 7.5: IDENTIFY AND KEEP ONLY THOSE CLAIMS FOR SHORT STAY HOSPITALS AND NON-NEGATIVE PAYMENTS */
data utl.ip_2010_fnl_ss;
set utl.ip_2010_fnl;
provtype = substr(provider,3,4);
if (('0001'<=provtype<='0899') or ('1300'<=provtype<='1399')) and pmt_amt>0;
run;
How do we define acute short-stay hospitals? The PROVIDER variable is the provider identifier for the hospital and it contains embedded intelligence. Specifically, the first two positions of the PROVIDER variable identify the SSA state code for the hospital’s location, and the third and fourth positions identify the category of the hospital. We will use this category identifier to find IPPS hospitals and CAHs. IPPS hospitals are identified where the substring of the PROVIDER variable, starting at the third position through the sixth position, is equal to 0001 through 0899. CAHs are identified where the substring of the PROVIDER variable, starting at the third position through the sixth position, is equal to 1300 through 1399. Therefore, we create a variable called PROVTYPE that is this substring of the PROVIDER variable, starting at the third position and ending with the sixth position (inclusive). Then, we output a data set called UTL.IP_2010_FNL_SS, keeping only those records with values of PROVTYPE that identify IPPS and critical access hospitals. We output this data set to a permanent library because we will use it again in Chapter 8 when we measure Medicare payments for inpatient services (i.e., we will measure payments only for those services that occurred in acute short-stay hospitals).
In addition to keeping only those inpatient claims that occurred in acute short-stay hospitals, our code in Step 7.5 also uses the Medicare payment amount variable (PMT_AMT) to remove inpatient claims with negative payment amounts. There should be very few such claims. Generally, these claims are excluded because the negative Medicare payment amount is seen as an indicator that some information on the claim may not be reliable. In some instances, investigators do not use claims with negative payment amounts for payment analysis, but do use these claims for utilization and quality analyses. For example, in studying quality of care, we may choose to “err on the side of the provider” and look for evidence of a service that indicates high quality care (like a retinal eye exam) regardless of the value of payment amount. In our example research programming project, we will keep it simple and exclude these records from the inpatient data for the remainder of our work. Therefore, from this point forward, we will use the output of Step 7.4, called UTL.IP_2010_FNL_SS, for all work requiring inpatient claims data.
In Step 7.6, we use the UTL.IP_2010_FNL_SS data set that contains only claims for acute short-stay hospitals to calculate the length of stay (IP_LOS), measured in days for each beneficiary’s hospital stay. In simple terms, the length of stay is the discharge date (DSCHRGDT) less the admission date (ADMSN_DT), plus one day to account for cases where the admission and discharge dates fall on the same day (without adding one day, the result would be a stay of zero days). In some cases, you may consider writing separate algorithms for stays where the admission and discharge dates are equal, and for stays lasting longer than a single day. We also perform a frequency distribution of the length of stay calculations. We output a data set called STAY_UTIL that contains beneficiary and provider identifiers, the start and end dates of the hospitalization, and the calculated length of stay variable. We also perform a frequency distribution of IP_LOS, using SAS’ Output Delivery System to create our results.
/* STEP 7.6: CALCULATE LOS, ASSUMING EVERY INPATIENT CLAIM IS A STAY */
data stay_util(keep=bene_id admsn_dt dschrgdt provider ip_los);
set utl.ip_2010_fnl_ss;
ip_los=dschrgdt-admsn_dt+1;
run;
ods html file=“C:UsersmgillinghamDesktopSAS BookFINAL_DATAODS_OUTPUTGillingham_fig7_6.html”
image_dpi=300 style=GrayscalePrinter;
ods graphics on / imagefmt=png;
title “FREQ OF INPATIENT LENGTH OF STAY”;
proc freq data=stay_util(where=(1<=ip_los<=10));
tables ip_los;
run;
ods html close;
Output 7.1 shows the results of Step 7.6, delimited for display purposes to count only those records where the IP_LOS is between 1 and 10 days, inclusive.
Output 7.1: Frequency of Inpatient Length of Stay

In Step 7.7, we modify the STAY_UTIL data set by calculating the number of stays for each beneficiary, as well as the total number of days spent in the hospital for the year (TOT_IP_LOS). We use a PROC SQL statement that creates a variable called STAY_CNT that is the count of the number of claims, grouped by BENE_ID (beneficiary), in our input data set. At the same time, we add the IP_LOS values for each beneficiary to create the TOT_IP_LOS variable for use in calculating the average length of stay in the next step. We output a data set called UTL.STAY_UTL. Because we used distinct(BENE_ID) in the select statement, our output contains one record per beneficiary (so the IP_LOS variable is no longer relevant).
/* STEP 7.7: CALCULATE NUMBER OF STAYS AND TOTAL IP LOS, ASSUMING EVERY INPATIENT CLAIM IS A STAY */
proc sql;
create table utl.stay_util as
select distinct(bene_id), admsn_dt, dschrgdt, count(bene_id) as stay_cnt, sum(ip_los) as tot_ip_los
from stay_util
group by bene_id;
quit;
In Step 7.8, we modify the UTL.STAY_UTIL data set by calculating the average length of stay (IP_ALOS), measured in days for each beneficiary. For a provider, the ALOS statistic provides information on how quickly patients are being discharged after treatment. For a beneficiary, the ALOS statistic provides information on the average length of hospital stays. We calculate ALOS by dividing IP_LOS by STAY_CNT and performing a frequency distribution of IP_ALOS. Again, we use ODS to output the results of the frequency distribution.
/* STEP 7.8: CALCULATE ALOS */
data utl.stay_util;
set utl.stay_util;
ip_alos=tot_ip_los/stay_cnt;
run;
ods html file=“C:UsersmgillinghamDesktopSAS BookFINAL_DATAODS_OUTPUTGillingham_fig7_8.html”
image_dpi=300 style=GrayscalePrinter;
ods graphics on / imagefmt=png;
title “FREQ OF INPATIENT AVG LENGTH OF STAY”;
proc freq data=utl.stay_util(where=(1<=ip_alos<=5));
tables ip_alos;
run;
ods html close;
Output 7.2 shows the results of Step 7.8, delimited to include only those records with a value of IP_ALOS between 1 and 5 days, inclusive.
Output 7.2: Frequency of Inpatient Average Length of Stay

As discussed in Chapter 3, the identification of emergency department utilization is an interesting and challenging task. Proper identification of emergency room services involved the use of three claims data sets: inpatient data, outpatient data, and Part B carrier data.5 Specifically:
• If a beneficiary is admitted to the hospital following the ED visit, the information pertaining to the ED visit can be found in the inpatient data. These ED services are identified using revenue center codes 0450-0459 and 0981.
• If a beneficiary is seen in an ED but is not subsequently admitted to the hospital, the claim for the ED visit can be found in the outpatient data. These claims can be identified using the same revenue center codes used for identification of ED visits in the inpatient data (revenue center codes 0450-0459 and 0981).
• The professional component for ED services may appear in the Part B carrier data. This professional component can be identified using certain procedure code values (such as 99281, 99282, 99283, 99284, and 99285). We could also use (or add) a place of service code value of 23.
If we were measuring total ED costs, or counting total ED visits, we would identify ED services using all three claims data sets. However, because we are studying a set of providers, we will focus on identifying the professional component of ED services. In Step 7.9, we use the carrier file created in Step 7.1 above (UTL.CARR_2010_FNL) to identify the professional component of ED services. Our code is similar to the code used in Step 7.3, creating an array for the 13 HCPCS codes (HCPCS_CD1-HCPCS_CD13) on carrier claims, and a flag representing an ED service (ED_SVC). We search each claim for procedure codes equal to 99281, 99282, 99283, 99284, and 99285. These procedure code values indicate emergency department services (a procedure code value of 99288 may be considered because it indicates direction by a physician of emergency medical systems care during the transportation of the patient to the emergency department, but Medicare does not pay it).6 We output a file called UTL.ED_CARR_UTIL.
/* STEP 7.9: IDENTIFY THE PROFESSIONAL COMPONENT OF ED SERVICES */
data utl.ed_carr_util(keep=bene_id ed_svc);
set utl.carr_2010_fnl;
array hcpcscd(13) hcpcs_cd1-hcpcs_cd13;
ed_svc=0;
do i=1 to 13;
if substrn(hcpcscd(i),1,5) in('99281','99282','99283','99284','99285') then do;
ed_svc=1;
leave;
end;
end;
run;
ods html file=“C:UsersmgillinghamDesktopSAS BookFINAL_DATAODS_OUTPUTGillingham_fig7_9.html”
image_dpi=300 style=GrayscalePrinter;
ods graphics on / imagefmt=png;
title “PRINT OF ED PROFESSIONAL COMPONENT SERVICES”;
proc print data=utl.ed_carr_util(obs=10);
where ed_svc=1;
run;
ods html close;
Finally, we use ODS to display the output of Step 7.9, keeping only those records where ED_SVC is equal to 1. Output 7.3 illustrates just the first 10 observations for display purposes.
Output 7.3: ED Professional Component Services

Let’s further explore the carrier file by studying the utilization of ambulance services. Checking with a subject matter expert in identifying services using billing codes reveals that we can identify these services using procedure code values of A0021, A0080, A0090, A0100, A0110, A0120, A0130, A0140, A0160, A0170, A0180, A0190, A0200, A0210, A0225, A0380, A0382, A0384, A0390, A0392, A0394, A0396, A0398, A0420, A0422, A0424, A0425, A0426, A0427, A0428, A0429, A0430, A0431, A0432, A0433, A0434, A0435, A0436, A0800, A0888, and A0999.
Because it is possible for more than one ambulance service to appear on a claim, we use a variant of the code developed in Step 7.3 to identify the occurrence of an E&M visit. Specifically, we must change the code to count the total number of occurrences of a relevant procedure code, instead of using a leave statement to end the processing after a single occurrence of a relevant procedure code is found.
In Step 7.10, we create a macro variable called ambcodes that identifies the procedure code values we are looking for. Then, we use the Part B carrier data set created in Step 7.1 (UTL.CARR_2010_FNL) to search for the procedure codes represented by the ambcodes macro variable. We create an array for the 13 procedure codes (HCPCS_CD1-HCPCS_CD13) on the carrier claims, as well as a variable called AMB_CARR_SVC used to count the total number of relevant procedure codes on the claim. Note the absence of a leave statement that ends the processing when a relevant value of the procedure code variable is found. In place of the leave statement, we include logic that iterates the value of AMB_CARR_SVC on a record by one each time a relevant procedure code (i.e., one of the procedure codes represented by ambcodes) is found on that record. We output a file called AMB_UTIL, keeping only the BENE_ID, procedure codes, and the AMB_CARR_SVC variables.
/* STEP 7.10: IDENTIFY AMBULANCE SERVICES IN CARRIER CLAIMS */
/* DEFINE AMBULANCE PROCEDURE CODES */
%let ambcodes='A0021','A0080','A0090','A0100','A0110',
'A0120','A0130','A0140','A0160','A0170','A0180','A0190','A0200','A0210',
'A0225','A0380','A0382','A0384','A0390','A0392','A0394','A0396','A0398',
'A0420','A0422','A0424','A0425','A0426','A0427','A0428','A0429','A0430',
'A0431','A0432','A0433','A0434','A0435','A0436','A0800','A0888','A0999';
data amb_util(keep=bene_id hcpcs_cd: amb_carr_svc);
set utl.carr_2010_fnl;
array hcpcscd(13) hcpcs_cd1-hcpcs_cd13;
retain amb_carr_svc;
amb_carr_svc=0;
do i=1 to 13;
if substrn(hcpcscd(i),1,5) in(&ambcodes) then do;
amb_carr_svc=amb_carr_svc+1;
end;
end;
if amb_carr_svc>=1;
run;
ods html file=“C:UsersmgillinghamDesktopSAS BookFINAL_DATAODS_OUTPUTGillingham_fig7_10.html”
image_dpi=300 style=GrayscalePrinter;
ods graphics on / imagefmt=png;
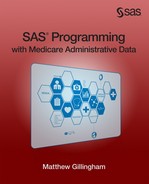
title “PRINT OF AMBULANCE SERVICES BY BENEFICIARY”;
proc print data=amb_util(where=(bene_id='0073EAD53F4BBC1C')); run;
ods html close;
Here is the AMB_UTL data for a single beneficiary who has more than one claim for ambulance services, displayed using ODS. You can see that the value of AMB_CARR_SVC matches the number of relevant procedure codes on the claim.
In Step 7.11 we count the total number of ambulance services per beneficiary. Specifically, we sum the values of AMB_CARR_SVC by beneficiary. The output of this summation is stored in a variable called TOT_AMB. We output a permanent file called UTL.CNT_SVCS_AMB_UTIL, keeping only one record per distinct value of BENE_ID.
/* STEP 7.11: COUNT AMBULANCE SERVICES PER BENEFICIARY */
proc sql;
create table utl.amb_util as
select distinct(bene_id), sum(amb_carr_svc) as tot_amb_svc
from amb_util
group by bene_id;
quit;
ods html file=“C:UsersmgillinghamDesktopSAS BookFINAL_DATAODS_OUTPUTGillingham_fig7_11.html”
image_dpi=300 style=GrayscalePrinter;
ods graphics on / imagefmt=png;
title “PRINT OF TOTAL AMBULANCE SERVICES COUNTS BY BENEFICIARY”;
proc print data=utl.amb_util(where=(bene_id='0073EAD53F4BBC1C')); run;
ods html close;
Output 7.4 shows the UTL.CNT_SVCS_AMB_UTIL data for the same beneficiary displayed above. You can see that the value of TOT_AMB is indeed the summation of the values of AMB_CARR_SVC displayed above.
Output 7.4: Total Ambulance Services Counts

In Step 7.12, we present a simple formula for calculating the number of outpatient visits for each beneficiary. We treat each record in the outpatient file as a claim for a distinct visit (making assumptions similar to those for inpatient data, and for similar reasons, and with similar implications). Therefore, we use PROC SQL to count each claim for a beneficiary (creating a variable called OP_VISIT_CNT using a group by statement). We output a data set called UTL.OP_UTIL, and perform a PROC PRINT to display the summarized information contained therein, using ODS to create our results.
/* STEP 7.12: MEASURE OUTPATIENT UTILIZATION */
proc sql;
create table utl.op_util as
select distinct(bene_id), count(bene_id) as op_visit_cnt
from utl.op_2010_fnl
group by bene_id;
quit;
ods html file=“C:UsersmgillinghamDesktopSAS BookFINAL_DATAODS_OUTPUTGillingham_fig7_12.html”
image_dpi=300 style=GrayscalePrinter;
ods graphics on / imagefmt=png;
title “PRINT OF OUTPATIENT VISIT SUMMARIES BY BENEFICIARY”;
proc print data=utl.op_util(obs=10); run;
ods html close;
Output 7.5 shows the results of Step 7.12, printing just the first 10 observations for display purposes.
Output 7.5: Outpatient Visit Summaries

Claims for SNF and hospice services are billed in 30-day increments; claims for home health services are billed in 60-day increments. If a beneficiary is discharged (or expires) prior to the completion of a 30- or 60-day period, the last claim in a set may be for less that 30 or 60 days, respectively. Therefore, when sorting claims by FROM_DT and THRU_DT for a beneficiary’s home health care, we expect to see some claims with a length of stay of 60 days. We may also see claims with a length of stay of less than 60 days for the last claim in the stay.7 In order to determine length of stay, we must collapse claims that comprise a single stay.
• Scenario #1: Claims with consecutive dates of service, defined where the THRU_DT on the earlier claim is within one day of the FROM_DT on the next earliest claim. For example, the first claim in a set contains a FROM_DT equal to March 1, 2010 and a THRU_DT equal to April 30, 2010, and the next consecutive claim in the set has a FROM_DT equal to May 1, 2010 and a THRU_DT equal to June 30, 2010.
• Scenario #2: Claims with a FROM_DT that falls before the THRU_DT on another claim in the set. For example, if one claim contains a FROM_DT equal to March 1, 2010 and a THRU_DT equal to April 30, 2010, and another claim has a FROM_DT equal to April 25, 2010 and a THRU_DT equal to June 24, 2010.
• Scenario #3: Claims with a FROM_DT and THRU_DT that fall within the FROM_DT and THRU_DT of another claim for the beneficiary. For example, one claim contains a FROM_DT equal to March 1, 2010 and a THRU_DT equal to April 30, 2010, and another claim contains a FROM_DT equal to March 5, 2010 and a THRU_DT equal to April 4, 2010.
• Scenario #4: Claims that do not fall into any of the above categories. For example, one claim contains a FROM_DT equal to March 1, 2010 and a THRU_DT equal to April 30, 2010, and the next consecutive claim in the set has a FROM_DT equal to July 1, 2010 and a THRU_DT equal to August 30, 2010.
In all cases, we want to collapse sets of claims into a single record such that the FROM_DT and THRU_DT on the collapsed record are equal to the earliest FROM_DT in the set and the latest THRU_DT in the set, respectively. In Step 7.13 through Step 7.15, we present an algorithm to collapse beneficiary’s claims into a single record where appropriate.8 Our algorithm utilizes a macro called CLM_LOOP2 that is very similar to the CLM_LOOP macro used in Step 7.1 above (the difference being that the CLM_LOOP2 macro only processes the SNF, home health, and hospice data sets). First, in Step 7.13, we sort the relevant claims data set created in Step 7.1, outputting intermediate data sets to our work library. Note that we only keep the beneficiary identifier, FROM_DT, and THRU_DT on the claim because those are the only variables needed for our work. The sort key (BENE_ID, FROM_DT, and THRU_DT) orders each beneficiary’s claims by date in preparation for the processing performed in later steps.
/* STEP 7.13: SORT FILE BY BENE_ID, FROM_DT, THRU_DT */
%macro clm_loop2(clmtyp=);
proc sort data=utl.&clmtyp._2010_fnl out=&clmtyp._2010_fnl(keep=bene_id from_dt thru_dt);
by bene_id from_dt thru_dt;
run;
Step 7.14 uses a lag function to create a variable called CLAIM_SEGMENT_ID to use for identifying claims to collapse. The key to understanding this step is to recognize that the ‘else do’ statement executes first for new combinations of BENE_ID and FROM_DT values, and CLAIM_SEGMENT and END2 are re-initialized for a new group of overlapping claims. This lag function reads the previous record for a beneficiary (remember that the records are sorted in consecutive order) and determines the relationship of the THRU_DT on the previous claim to the FROM_DT on the next consecutive claim. If this relationship is described by Scenario #1, Scenario #2, or Scenario #3 above, the CLAIM_SEGMENT_ID does not increase by 1, meaning that claims in these scenarios will have the same value of CLAIM_SEGMENT_ID. The output of this step is an intermediate data set saved to our work library.
/* STEP 7.14: IDENTIFY CLAIMS WITH DATE RANGES TO BE COLLAPSED USING CLAIM_SEGMENT_ID */
data &clmtyp._2010_stay(drop=bene_id2 thru_dt rename=(from_dt=begin_dos end2=end_dos));
set &clmtyp._2010_fnl;
retain end2;
bene_id2=lag1(bene_id);
if bene_id2=bene_id and from_dt le (end2+1) then do;
from_dt=end2;
end2=max(thru_dt,end2);
end;
else do;
claim_segment_id+1;
end2=thru_dt;
end;
format end2 mmddyy10.;
run;
Step 7.15 keys on the CLAIM_SEGMENT_ID to collapse the records outputted in Step 7.14. Specifically, for records with the same value of CLAIM_SEGMENT_ID, the code outputs a single record that contains a value of FROM_DT equal to the earliest FROM_DT in the set of claims, as well as a value of THRU_DT equal to the latest value of THRU_DT in the set of claims. In the case of records that fall in Scenario #4, the code will output multiple records for the beneficiary. Finally, the code calculates the length of stay (called LOS) as the difference of the THRU_DT and the FROM_DT on each outputted record. The outputted analytic files, UTL.SN_2010_STAY, UTL.HH_2010_STAY, and UTL.HS_2010_STAY, are saved as permanent data sets for future use.
/* STEP 7.15: COMBINE CLAIMS WITH OVERLAPPING SEGMENTS */
data utl.&clmtyp._2010_stay_fnl(drop=begin_dos end_dos claim_segment_id);
retain from_dt thru_dt;
set &clmtyp._2010_stay;
by bene_id claim_segment_id;
format from_dt thru_dt mmddyy10.;
if first.claim_segment_id then do;
from_dt=begin_dos;
end;
if last.claim_segment_id then do;
thru_dt=end_dos;
los=thru_dt-from_dt;
output;
end;
run;
%mend;
%clm_loop2(clmtyp=sn);
%clm_loop2(clmtyp=hh);
%clm_loop2(clmtyp=hs);
In this chapter, we used our claims and enrollment data to program measurements of utilization and output analytic files containing utilization data for our population. Specifically, we:
• Delimited the claims data we will use throughout the remainder of this book by the beneficiary population we created in Chapter 6.
• Programmed an algorithm to measure utilization of evaluation and management (E&M) services in a physician office setting by defining procedure codes that define E&M visits and searching the array of line-level procedure code variables in the Part B carrier data for any one of those procedure codes.
• Programmed an algorithm to calculate inpatient hospital stays, discussed how most records in the inpatient data set represent a stay, learned how to define acute short-stay hospitals, and programmed an algorithm to determine the length of stay.
• Programmed an algorithm to measure the professional component of emergency department (ED) services by defining how to find ED services in claims data and learning how to search procedure codes for some of those services.
• Programmed an algorithm to measure utilization of ambulance services by defining the procedure codes that characterize ambulance services and counting the total occurrences of those codes on a given claim.
• Programmed algorithms for measures of utilization for outpatient visits, SNFs, home health agencies, and hospice services.
1. Can you rearrange programming in Step 7.6 through Step 7.9? Does the program run faster?
3. Can you write code for collapsing stays comprised of multiple claims into a single record containing all information for the stay?
4. Can you think of how the algorithms for identifying the professional component of ED services can be modified to search the inpatient and outpatient files for the existence of revenue center codes that define an ED service?
5. Perform the following thought experiment: Assuming you have data on durable medical equipment claims, apply what you learned in this chapter to write some pseudocode to identify utilization of wheelchairs and hospital beds.
6. Can you apply the logic used to define stays in the Skilled Nursing Facility file to inpatient data to account for multi-claim stays in the inpatient file?
1 As discussed in Chapter 3, Healthcare Common Procedure Coding System (HCPCS) Level I codes, also known as Current Procedural Terminology (CPT) codes, are five digit numeric codes describing medical services, and are a copyrighted coding schema of the American Medical Association (AMA). HCPCS Level II codes are five character alphanumeric codes defining services not described by the Level I codes.
2 Note that the use of the substring here is a personal preference and may not be necessary in your application.
3 If you wish to look into transfers further, they can be simply defined by identifying two or more sequential claims for a beneficiary, where the providers are different, and the first date of service on the latter claim (represented by the ADMSN_DT variable) is equal to the last date of service or one day after the last date of service on the previous claim (represented by the DSCHRGDT variable). For more information, see ResDAC’s article called Identifying Multiple Claims for a Hospital or Skilled Nursing Facility Stay, available at http://www.resdac.org/resconnect/articles/125.
4 The Hospital Compare website is at http://www.medicare.gov/hospitalcompare.
5 Specifications in this section adapted from ResDAC’s article called How to Identify Emergency Room Services in the Medicare Claims Data, available at http://www.resdac.org/resconnect/articles/144.
6 In general, while there are a number of reasons that beneficiaries are seen in an ED, which could encompass a large range of E&M codes, we are focusing on ED E&M codes as defined in the HCPCS manual.
7 In addition, the FROM_DT is always equal to the THRU_DT on the first claim in a set for home health services (see the definition of the FROM_DT variable available on ResDAC’s website at http://www.resdac.org/cms-data/variables/Claim-Date).
8 This algorithm is adapted from a SUG paper by Doug Shannon and Wade Bannister, available on VALSUG’s website at http://www.valsug.org/meetings/2004/jan/SASPaper-OverlappingDateSegments-D&W.pdf. I like its comprehensive approach to identifying and collapsing records in a SAS data set with consecutive and overlapping dates, as well as records that are not consecutive or overlapping.