
Chapter 5: Setting Up and Configuring EMR Clusters
In previous chapters, while explaining Amazon EMR architecture or different big data applications within it, we have given sample AWS CLI commands and a few high-level steps to create an EMR cluster. In this chapter, we will dive deep into setting up an EMR cluster with quick options and also advanced configurations, using which you can control different hardware, software, networking, and security settings.
This chapter will also explain troubleshooting, logging, and tagging features of the EMR cluster and how you can leverage AWS SDKs and APIs to launch or manage clusters.
The following are the topics that we will cover in this chapter:
- Setting up and configuring clusters with the EMR console's quick create option
- Advanced configuration for cluster hardware and software
- Working with AMIs and controlling cluster termination
- Troubleshooting, logging, and tagging a cluster
- SDKs and APIs to launch and manage EMR clusters
Understanding these concepts will help you to have advanced control of your cluster configurations, using which you can reduce maintenance overhead, optimize resources, and also troubleshoot cluster or job failures.
Technical requirements
In this chapter, we will dive deep into an EMR cluster's advanced configuration, logging, and debugging. To test out the configurations, you will need the following resources before you get started:
- An AWS account
- An IAM user that has permission to create EMR clusters, EC2 instances and dependent IAM roles, VPCs, and security groups and can access CloudWatch and CloudTrail logs
Now let's dive deep into an EMR cluster's advanced options and how you can configure them using the EMR console and the AWS CLI.
Setting up and configuring clusters with the EMR console's quick create option
The EMR console's quick create option helps you to create an EMR cluster quickly with default configurations specified for software, hardware, and security sections. Each section has default values selected that you can change or override and there are some configurations that are not exposed for selection during the cluster creation process.
For example, you do not get the option to select a Virtual Private Cloud (VPC) or subnet for your cluster. EMR configures the cluster in your region's default VPC and public subnet.
Now, to get started, you can follow these steps to create a cluster:
- After signing in to the AWS console, navigate to the Amazon EMR console at https://console.aws.amazon.com/elasticmapreduce/.
- Choose the Clusters option and then select or click Create cluster, which will open the Quick create page.
- On the Create Cluster - Quick Options page, you will have default values populated that you can change as needed. We will cover the options in detail in a later part of the chapter.
- Then select Create cluster, which will launch the cluster.
- Then, on the cluster status page, you can find the cluster status, which should change from Starting to Running and then Waiting.
- When the status reaches the Waiting stage, that means it's ready to accept jobs as steps, and also you can SSH to the master node.
Now let's deep dive into the default configuration the quick create page shows, which you might have seen in step 3.
It divides the cluster configuration into four sections: General Configuration, Software configuration, Hardware configuration, and Security and access. The following screenshot shows options you get in General Configuration and Software configuration:

Figure 5.1 – General Configuration and Software configuration of the EMR quick creation option
Now let's explore each of the settings you see in General Configuration and Software configuration:
- General Configuration: This section of the configuration allows you to specify a name for your cluster, enable logging for your cluster, and then define the launch mode, which can be either Cluster or Step execution.
- Logging requires an Amazon S3 path to which EMR will be writing logs. Please note logging can be enabled while creating the cluster only and cannot be changed later. With the quick options, EMR populates a default S3 path that you can override.
- For Launch mode, Cluster is selected as the default value that you can change. Cluster mode represents a long-running cluster that does not auto-terminate the cluster when the job executions are completed. If you are creating a transient cluster that needs to execute a few steps and then auto-terminate, then you can select Step execution for Launch mode.
- Software configuration: Amazon EMR has different release versions and it auto-selects the latest version that you can use to create your cluster. Each release includes big data applications and their respective versions included in that release. As a quick option, EMR specifies a set of applications to choose from. For example, Core Hadoop includes Hadoop, Hive, Hue, Mahout, Pig, and Tez, and similarly, HBase, Spark, and Presto are also a few other application packages listed that you could choose from. If you need a custom set of applications, then you can use advanced EMR options.
In addition to selecting an EMR release and big data applications, you will also see the Use AWS Glue Data Catalog for table metadata option, which is unchecked by default. This option will enable you to use the AWS Glue Data Catalog as a Hive external metastore.
Now let's understand the configuration settings you get for Hardware configuration and Security and access.
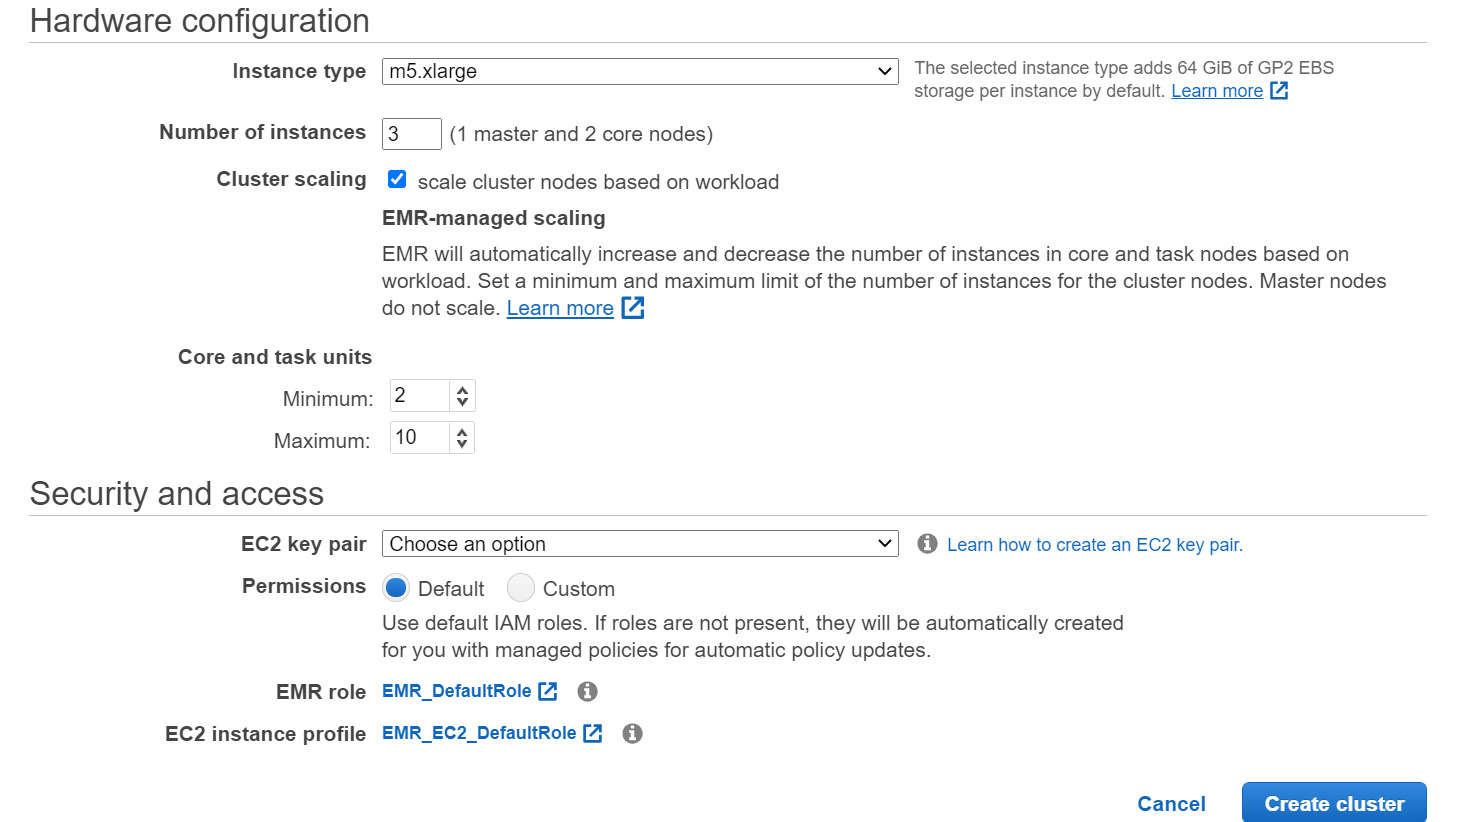
Figure 5.2 – Hardware configuration and Security and access configuration of the EMR quick create option
- Hardware configuration: This facilitates choosing the EC2 instance type for your cluster, the number of instances you need, and whether you plan to enable scaling on your cluster.
By default, EMR specifies 3 as the total instance count for the cluster, which includes 1 master and 2 core nodes. If you would like to change the configuration or would like to configure multiple master nodes, then you can switch to advanced configuration.
The scaling option is disabled or unchecked by default, but if you plan to enable it, then it requests that you provide the minimum and maximum instance counts for core nodes. By default, it has 2 as the minimum nodes and 10 as the maximum, which you can change as per your requirements. EMR offers two cluster scaling mechanisms, auto scaling and managed scaling, which we will deep dive into in future chapters. With quick option configuration, EMR will use managed scaling to scale the cluster up and down.
- Security and access: This section allows you to configure IAM roles, permissions, and an EC2 key pair for your cluster. By default, EMR creates EMR_DefaultRole and EMR_EC2_DefaultRole with the required permissions, but you can override them with custom roles or permissions you would like to apply.
EC2 key pair is an optional parameter. You can assign an EC2 key pair if you plan to link to the cluster node using Secure Shell (SSH) and submit steps or execute commands via the CLI. Please note, you need to create an EC2 key pair first before creating the EMR cluster and it's recommended to assign an EC2 key pair as without it, you won't be able to connect to the cluster master node using SSH.
As we have got an overview of the quick cluster creation option, now let's dive deep into the advanced configurations EMR provides to control cluster hardware, software, networking, and security controls.
Advanced configuration for cluster hardware and software
In the previous section, you saw the default configurations the quick option provides, and now, we will see how you can customize each of those default configurations as per your requirements.
Understanding the Software Configuration section
Using the Software Configuration section, you can choose the EMR release, the applications you plan to set up, master node and metastore configurations, and any custom configurations you plan to add that may override default configurations of the cluster.
The following explains each of these configurations.
- Release: In this section, you can select the EMR release you plan to use. After selecting the release, you will see the list of applications that release includes with their software version. For each release, EMR automatically marks a few applications as selected, which you are free to change if needed.
- Multiple master nodes: EMR supports enabling multiple master nodes, which brings high availability to your cluster. You can select either one or three master nodes. However, launching three master nodes is only supported starting with the EMR 5.23.0 release.
Higher availability is achieved by using an EMR cluster with three master nodes. If one of the master nodes goes down, then it automatically fails over to another master node without any interruption. Meanwhile, EMR also replaces the failed master node with required configurations and bootstrap actions, so that the cluster maintains three master nodes for high availability. EMR also extends the high availability feature to a few big data applications, such as HDFS, YARN, Hive, Hue, Oozie, and Flink, benefitting from the multiple master feature. For Hive, Hue, and Oozie you need to make sure that the metastore databases are externalized outside of the master node so that the failover to other master node does not affect the operation.
- AWS Glue Data Catalog settings: As we have explained in previous chapters, you can externalize your metastore databases outside of your cluster. For that, you can leverage either Amazon RDS, Amazon Aurora databases, or AWS Glue Data Catalog. This setting allows you to specify whether you would like to leverage AWS Glue Data Catalog for Hive and Spark applications. By default, these applications are not selected and you can enable them as needed.
- Edit software settings: This section enables you to provide additional custom configuration parameters, which are intended to override the default configurations of the cluster. Configuration objects include a big data application's classification, such as the Hadoop core site, its properties, and other optional nested configurations. You can provide custom configuration as a JSON string or you can save your JSON configuration into Amazon S3 and specify the S3 path while creating the cluster.
For example, the following sample JSON specifies configurations for core-site and mapred-site classifications and includes Hadoop and MapReduce properties with values that you plan to override in the cluster. In the previous chapter, while covering different big data application configurations, we covered several other examples similar to this.
[
{
"Classification": "core-site",
"Properties": {
"hadoop.security.groups.cache.secs": "500"
}
},
{
"Classification": "mapred-site",
"Properties": {
"mapred.tasktracker.map.tasks.maximum": "10",
"mapreduce.map.sort.spill.percent": "0.80",
"mapreduce.tasktracker.reduce.tasks.maximum": "20"
}
}
]
The following diagram is a screenshot of the AWS console that shows software configurations within the advanced cluster creation options.

Figure 5.3 – Software Configuration of EMR's advanced cluster create option
After understanding what options you have under Software Configuration, let's next understand what options you get while configuring steps in your EMR cluster.
Understanding Steps
After specifying software configurations, you can specify steps for your cluster, which may run sequentially or in parallel.
The following are the settings available when you specify optional steps for your cluster:
- Concurrency: This setting is disabled or unchecked by default, which means all the steps you add to the cluster will get executed in sequence. By enabling this setting, you can specify a maximum for how many steps or jobs can run in parallel to utilize the cluster resources better.
- After last step completes: This setting gives you control to specify whether you would like to terminate your cluster when all defined steps complete execution or you would like to keep the cluster active in the waiting state so that other jobs can be submitted later.
- Step type: This setting allows you to add a step to the cluster and the steps can be a Hive, Pig, Spark, or custom JAR file job. Choosing any type opens up an additional configuration screen where you can specify parameters for the step or job.
The following screenshot of the EMR console shows the parameters for steps:

Figure 5.4 – Steps configuration of EMR's advanced cluster create option
In this section, you have learned how you can configure steps in your cluster to get executed in sequence or in parallel. Next, you will learn what hardware configuration options are available.
Understanding the Hardware Configuration section
This section provides configurations using which you can control your cluster hardware, networking, and scaling configurations.
The following explains each of these configurations.
- Cluster Composition: This is an important configuration for the cluster hardware where you can specify your cluster nodes to be part of an instance group or instance fleet. An instance group represents a uniform node type for your cluster, whereas an instance fleet represents a mix of different EC2 instance types for core or task nodes. Based on the cluster composition you select, you get additional configuration parameters in cluster node types and cluster scaling configuration.
- Networking: This section allows you to launch your cluster in your region's default VPC or other public or private VPC. Apart from configuring a VPC, you can specify one or more subnets for your cluster within which instance nodes will be launched. The subnets can be public, private, or shared, or can be associated with AWS Local Zones or AWS Outposts.
Please make sure you have created the VPC and subnets before so that you can select them while creating your EMR cluster configuration.
The following screenshot shows an EMR console screen that includes Cluster Composition:

Figure 5.5 – Cluster Composition configuration of your EMR cluster
And here's a screenshot of Networking information in the EMR console:

Figure 5.6 – Networking configuration of your EMR cluster
- Cluster Nodes and Instances: This section of the configuration provides the control to choose Instance type, Instance count, and Purchasing option options for the Master, Core, and Task node types. The following EMR console screenshot shows where you can select cluster nodes and instances.

Figure 5.7 – EMR Cluster Nodes and Instances type configuration
Please note, Task node types are optional so you can delete them if needed. Also, if you plan to leverage Task node types, then you have the flexibility to add multiple task instance groups where you can specify a different instance type and instance count for each task instance group.
- Cluster scaling: You can enable scaling capability on your cluster by selecting the Enable Cluster Scaling option. It provides the flexibility to choose between EMR managed scaling and a custom scaling policy. With EMR managed scaling you need to provide your minimum and maximum nodes and the maximum number of on-demand and core nodes for scaling.
With a custom auto scaling policy, you can define custom scale-out and scale-in rules with any cluster or application parameters. We will deep dive into this topic in the next chapter.
Please note, when you select Instance fleets as the cluster instance group composition, for the scaling feature you only get the EMR managed scaling option as custom auto scaling is not available for instance fleets.
- EBS Root Volume: Each instance type you choose will have an EBS root volume attached to it and you can control the size of the volume you need for it. Please note, you can increase the default 10 GB size to a maximum of 100 GB and the same size will be applicable to all instances of the cluster.
The following is a screenshot of the EMR console showing Cluster scaling and EBS Root Volume size settings:

Figure 5.8 – EMR Cluster scaling and EBS Root Volume size configuration
In this section, you have learned about configurations related to EC2 instances of the cluster, EBS volumes attached to the EC2 instances, scaling the resources, and also specifying a VPS and security groups. Next, you will learn about a few general configurations that you can apply to your cluster.
Understanding general configurations
This section allows you to configure logging, debugging, tagging, and bootstrap actions on your cluster. This section also provides the option to choose EMR File System (EMRFS) consistent view and a custom Amazon Machine Image (AMI) for your cluster.
Now let's get an overview of each of these settings:
- General Options: In this section, you can specify your cluster name and specify the configuration for logging, log encryption, debugging, and termination protection. Please note, you can specify these options while launching the cluster only. We will dive deep into each of these sections in future sections of this chapter.
The following screenshot shows the options you get under General Options:

Figure 5.9 – General Options for your EMR cluster
- Tags: With tagging, you can group your resources and identify usage and cost by the environment, project, AWS services, and more. It consists of a key and value pair and you can add more than one tag for your cluster. For example, you can add tags to your EMR cluster such as the name of the environment, the project name, project type, the owner, and so on.
Tags assigned to an EMR cluster are also propagated to its underlying EC2 instances and you can add or remove tags after the cluster is created too. You might also use tags to define IAM permissions.
The following is a screenshot of the EMR console that represents assigning multiple tags to your cluster:

Figure 5.10 – Adding tags for your EMR cluster
- Additional Options: This section allows you to specify a custom AMI ID that you plan to use for your cluster nodes and any bootstrap actions you would like to add. By default, your EMR cluster uses Amazon Linux AMI for Amazon EMR but starting from the EMR 5.7.0 release, you can override it by providing your custom AMI.
If you would like to install custom libraries and software on your cluster nodes, then you have two options to do it. Either you can specify bootstrap actions with the command you would like to execute or create a custom AMI with all the required software and use that to launch your cluster. Please note a custom AMI performs better compared to bootstrap actions as bootstrap actions are executed after the cluster is created.

Figure 5.11 – Additional Options for your EMR cluster
Important Note
EMR provides the EMRFS consistent view option to solve the eventual consistency issue of Amazon S3. But recently Amazon S3 started supporting strong read-after-write consistency, which means you won't face the eventual consistency issue.
You don't need to enable the EMRFS consistent view option for any of the EMR release versions.
In this section, you have learned about general configurations using which you can specify logging, debugging, and tagging options for your cluster and also can specify custom AMIs with bootstrap actions. In the next section, you will get an overview of the options EMR has related to the security of the cluster.
Understanding Security Options
The Security Options section gives you configurations to specify EC2 key pairs, IAM roles, security groups, and more, using which you can control who can access your cluster resources and what privileges they have. By default, EMR creates roles and access policies as needed by the cluster, but you can override them with your custom roles and access policies.
Now let's get an overview of each of these settings:
- EC2 key pair: As explained regarding the quick create option, EC2 key pairs are used to link to the master node using SSH and it is recommended to assign an EC2 key pair while creating the cluster as you cannot assign one later.
- Permissions: By default, EMR creates three roles – EMR_DefaultRole as the EMR role, EMR_EC2_DefaultRole as the EC2 instance profile, and EMR_AutoScaling_DefaultRole as the Auto Scaling role. But you can create your own custom roles and assign them to the cluster.
To understand each of these roles better, EMR role calls or interacts with other AWS services, such as EC2, while creating the cluster. The EC2 instance profile role provides access to cluster EC2 instances to access other AWS services such as Amazon DynamoDB, Amazon S3, and more. The Auto Scaling role provides access to add or remove EC2 instances from the cluster when scaling up or down happens through managed scaling or auto scaling policies.
- Security Configuration: This allows you to specify encryption and authentication options for your cluster. You need to create the configuration before creating the EMR cluster.
- EC2 security groups: EC2 security groups provide firewall security for your AWS services' inbound and outbound access. You can control which ports are allowed to access which source IP or security group or whether it is open to all.
EMR establishes two security groups by default: one for the master node and another for the core and task nodes. You can choose EMR managed security groups, which EMR automatically updates as needed or you can create your custom security groups to control access to your cluster.
The following is a screenshot of the EMR console that includes the security options you get when you create an EMR cluster with advanced options.

Figure 5.12 – Security options for your EMR cluster
After selecting options on the final security screen, click Create cluster, which will launch the cluster and start executing steps if defined or will go into the waiting state.
In this section, you have learned how you can use the EMR console's advanced options to create your EMR cluster. In the next section, let's dive deep into working with custom AMIs and how you can control cluster termination.
Working with AMIs and controlling cluster termination
In the previous section, we explained how EMR by default uses the Amazon Linux AMI for EMR and you have the option to create a custom AMI and use it while creating a cluster.
Now, in this section, we will dive deep into the default Amazon Linux AMI for EMR, custom AMI implementations, and how cluster termination works that you can configure as per your use case.
Working with AMIs
An AMI includes all the resources required to launch an EC2 instance. While launching an instance, you can specify the AMI it should be using. You can use the same AMI to launch multiple EC2 instances. If your EC2 instances need different configurations, then you can create instance-specific AMIs.
An AMI has the following components:
- One or more Elastic Block Store (EBS) snapshots, or if the AMI is backed by an instance store, a template for the EC2 instance's root volume. This might include an operating system, applications, and application servers.
- Permissions that defines which AWS account can use this AMI to launch EC2 instances.
- A block device mapping, which defines the volumes to be attached when an instance is launched.
Next, we will learn how EMR uses the default AMIs available and what configurations are available to specify your custom AMIs.
Using the default Amazon Linux AMI for EMR
For each EMR release version, there is a predefined and pre-configured AMI available that is integrated with the big data applications in that release. This means even if a new Amazon Linux AMI is available for that release, it won't be used in EMR. This is the reason it is recommended to use the latest release of EMR unless you have a specific need to use earlier releases of EMR.
The following explains how software updates are handled in the default AMI:
- When the EMR cluster's EC2 instance boots for the first time, it uses the default Amazon Linux AMI for Amazon EMR, identifies the package repository enabled for the AMI, and checks for software updates that apply to the AMI version. Similar to other EC2 instances, important security updates are applied automatically from these repositories.
Please note your networking and firewall settings should allow egress traffic to the Amazon Linux repository in S3.
- By default, software packages or kernel updates that require instance reboot are not automatically downloaded while launching the instance.
- The cluster completes the launch irrespective of whether the package installation is successful or not. If for any reason there is a network issue or the repository is not reachable and the software packages cannot be installed, that does not stop the cluster launch. So provide additional monitoring to keep a check on the cluster.
Important Note
It is recommended not to run sudo yum update on cluster EC2 instances either through the SSH command line or using bootstrap actions. This might create incompatibilities between nodes and big data applications.
The following are a few considerations or best practices that you can follow while using the default AMI:
- If you are using an earlier release of EMR, before updating software packages, consider testing the migration with the latest release.
- If you plan to migrate to the latest release, then test the implementation in a non-production environment. To do this, you can leverage the cloning feature for the EMR cluster.
- Look at Amazon Linux Security Center for any updates.
- Avoid installing custom packages by directly doing SSH to individual cluster nodes as it might create inconsistencies across nodes. Instead, use bootstrap actions for additional custom installations, which will install required software packages across the cluster. This requires terminating the cluster and relaunching it.
Using a custom AMI with your EMR cluster
In EMR, custom AMIs are supported starting with the EMR 5.7.0 release. It's useful to use a custom AMI when you need to do the following:
- Perform software customizations or pre-install applications before using the cluster. As explained earlier, you can do customizations using bootstrap actions too but pre-installed or pre-configured AMIs help in reducing the time required to launch an EMR cluster as the customizations are already a part of the cluster and no additional step is needed. This way, custom AMIs can improve your cluster start time.
- Implement more automated, sophisticated node and cluster configurations than bootstrap action steps allow.
Earlier than the EMR 5.24.0 release, you could use encrypted EBS root volumes only if you are using custom AMIs. But after EMR 5.24.0, you have the option to specify encryption using EMR security configurations. Having gotten an overview of default and custom AMIs, next we will learn the difference between cluster-level and instance-level AMIs.
Cluster-level versus instance-level custom AMIs
While assigning custom AMIs, you have the option to assign a single custom AMI to the whole cluster or an instance-level custom AMI, which will have a different custom AMI for each instance of your cluster.
Important Note
Please note, you cannot have both instance-level and cluster-level AMIs assigned at the same time.
Starting from EMR release 5.7.0 and later, you have the option to specify a different instance-level custom AMI for each instance type in an instance group or instance fleet. For example, you can configure arm64 architecture that is available with m6g.xlarge instance types and x86_64 architecture that is available in m5.xlarge instance types in the same instance fleet or group. Each instance type will use a custom AMI that matches its application architecture.
The following are some differences you will find when comparing cluster-level custom AMIs with instance-level AMIs:
- Instance-level custom AMIs can use both Graviton based ARM and x86 architectures in the same cluster, which you cannot do with single cluster-level AMIs.
- You can assign a custom AMI when adding an instance fleet or instance group to an already running cluster only with instance-level AMIs.
- Be it cluster-level or instance-level custom AMIs, you cannot run a custom AMI and an EMR AMI in the same cluster.
The following are a few best considerations or best practices that you can follow when creating your EMR cluster with custom AMIs:
- EMR 5.30.0 and later and the Amazon EMR 6.x series clusters are based on Amazon Linux 2, so for them, you need to use custom AMIs based on Amazon Linux 2. For EMR releases earlier than 5.30.0, you should use a 64-bit Amazon Linux AMI.
- Use the most recent EBS-backed Amazon Linux AMI as the base for your customizations.
- Avoid copying a snapshot of an existing cluster EC2 instance to create a custom AMI as that causes errors.
- Make sure you choose only the HVM virtualization type and instances that are compatible with Amazon EMR. Please check the AWS documentation to find the supported instance types.
- Your cluster service role should have launch permissions on the AMI or your AMI should be public to grant access, or you might be the owner of the AMI or the owner of the AMI shared it with you.
- Avoid using application names such as "Hadoop," "Hive," or "Spark" as user names for the AMI, as they might conflict with cluster service names and cause errors.
- If your AMI has contents in the /var, /tmp, and /emr folders, then they are moved to the respective /mnt/ path of the cluster (for example, /mnt/var, /mnt/tmp, and /mnt/emr). Please note, these file contents are reserved so if you have a large amount of data in these paths, then that might affect your cluster startup time.
For more detailed considerations and limitations, please refer to the AWS documentation, which might include more updates with new EMR releases.
Important Note
Please note, while using a custom AMI for your EMR cluster, use the Update all installed packages on reboot option, which is recommended.
In this section, you got an overview of default and custom AMIs in EMR and how you can configure them at the instance or cluster level. In the next section, we will dive deep into the EMR cluster termination process and how you can control it.
Controlling the EMR cluster termination process
As explained in the previous section, while creating an EMR cluster you can configure it to be long-running or you can configure it to auto-terminate after the defined steps have completed successful execution. When a cluster gets terminated, all its associated Amazon EC2 instances are terminated and you lose access to data in the EBS volume or instance store. The content of the EBS volume or instance store is not recoverable, which means you should have a good strategy in place for terminating your cluster.
Auto-terminating the cluster in transient cluster use cases optimizes your costs as the cluster does not spend time in the waiting state and you pay for actual usage hours. In long-running clusters that require interactive analytics, you can enable termination protection to prevent accidental termination of the cluster.
There are a few important points that you should consider:
- EMR clusters created through the AWS console or the AWS CLI do not have auto-termination enabled by default, whereas clusters created through the EMR API have auto-termination enabled by default.
- EMR enables auto-termination for clusters that have multiple masters and it overrides any settings you provide for auto-termination.
- To terminate a cluster with multiple masters, you need to disable the auto-termination settings first and only then will it allow you to terminate the cluster.
Now let's get more insights into how you can leverage auto-termination and termination protection features of EMR.
Configuring an EMR cluster to auto terminate
If you plan to auto terminate your cluster after your steps are done, then you can look at the following options to configure auto-termination:
- Using the quick creation option of the AWS console: When you create a cluster using the quick create option of the AWS console, auto-termination is only enabled if you follow the Step execution launch mode.
- Using the advanced option of the AWS console: When you create a cluster using the advanced option, under the Steps (optional) configuration, select Cluster auto-terminates for the After last step completes setting.
- Using the AWS CLI: When creating a cluster with AWS CLI commands, you can enable auto-termination for your cluster using the --auto-terminate option. The following is a sample AWS CLI command that includes auto-termination configuration:
aws emr create-cluster --name "EMR Cluster" --release-label emr-6.3.0 --applications Name=Hive Name=Spark --use-default-roles --ec2-attributes KeyName=myKey --steps Type=HIVE,Name="Hive Program", ActionOnFailure=CONTINUE, Args=[-f,s3://<mybucket>/scripts/query.hql,-p,INPUT=s3://<mybucket>/inputdata/,-p,OUTPUT=s3://<mybucket>/outputdata/,$INPUT=s3://<mybucket>/inputdata/,$OUTPUT=s3://<mybucket>/outputdata/] --instance-type m5.xlarge --instance-count 4 --auto-terminate
This section explained how you can configure the auto-termination of your cluster when you have transient EMR cluster use cases. Now let's look at long-running cluster use cases, where you can enable termination protection to prevent accidental termination.
Using termination protection for your long-running cluster
When you have enabled termination protection on your long-running cluster, you can still terminate it but with an additional step where you have explicitly disabled the termination protection first and then terminate your cluster. This feature helps you prevent terminating the cluster because of any error.
When termination protection is enabled on your cluster, the TerminateJobFlows action of the EMR API fails so you cannot terminate the cluster using the API or AWS CLI. The AWS CLI exits the command execution with a non-zero return code and the EMR API returns an error but if you are using the EMR console, then you will be prompted if you need to turn off the termination protection.
Important Note
Please note that termination protection prohibits you from terminating the cluster but does not provide any guarantee against data loss or rebooting the EC2 instances that might be caused because of human error. You can still trigger an EC2 instance reboot when you are connected to any instance through SSH or you have an automated script that triggered a reboot of the instance.
With termination protection, there are chances your HDFS data will still be lost. Leverage Amazon S3 as your persistent data store to prevent data loss because of EC2 instance failures.
Also note that termination protection does not affect your cluster when you resize your cluster with auto scaling policies or when you add or remove instances from your cluster's instance group or instance fleet.
Next, we will learn how EMR termination protection works when your cluster uses EC2 Spot instances.
Termination protection with EC2 and Spot instances
When you enable termination protection for your EMR cluster, it has the DisableAPITermination attribute set for all the Amazon EC2 instances of the cluster. Please note, you do have separate termination protection configuration available for your EC2 instances and when you trigger a termination request for your EMR cluster and the settings for EMR and EC2 instances conflict, then EMR overrides the EC2 instance settings.
Let's assume you have used the EC2 console to enable termination protection for your EC2 instances but your EMR cluster has termination protection disabled. In that state, if you terminate your EMR cluster, then it will set DisableApiTermination to false on the associated EC2 instances and then terminate the instance and the cluster.
Important Note
Please note that the termination protection setting of your EMR cluster does not apply to EC2 Spot instances. If you are using EC2 Spot instances for your cluster's core or task nodes and the Spot price rises beyond the maximum Spot price you have defined, then Spot instances will get terminated irrespective of the termination protection setting on the cluster. With Use on-demand as max price, you can avoid Spot instance termination.
Having learned how termination protection works with EC2 and Spot instances, next we will learn how termination protection works when we have unhealthy YARN nodes.
Termination protection behavior with unhealthy YARN nodes
As we explained in Chapter 2, Exploring the Architecture and Deployment Options, EMR periodically checks the status of YARN applications running on instances and also the instance's health by checking the status of NodeManager's health checker service. If any specific node is reported as UNHEALTHY, then the EMR instance controller does not allocate any new containers to it and blacklists the node until it becomes healthy again.
There can be multiple reasons for an EC2 instance becoming unhealthy, but a common reason is the instance disk utilization goes beyond 90%. If a node continues to be UNHEALTHY for more than 45 minutes, then Amazon EMR takes the following actions, depending on whether the cluster has termination protection enabled or not:
- If termination protection is enabled, the unhealthy EC2 core instances continue to remain in the blacklisted state and will be counted towards your cluster capacity or cost. As the EC2 instances are not terminated, you can connect to your EC2 instance, make configuration changes, or perform data recovery and can resize your cluster to add additional node capacity.
However, unhealthy task nodes are not protected from termination and get terminated if they continue to stay unhealthy for more than 45 minutes.
- If termination protection is disabled on your cluster, then EMR terminates the EC2 instances irrespective of task or core nodes, but to maintain the minimum capacity specified in the instance group or instance fleet, it provisions new instances.
If all of the core nodes of the cluster are reported as UNHEALTHY for more than 45 minutes, the complete EMR cluster will be get terminated with the NO_SLAVES_LEFT status.
When the instances get terminated, the HDFS data will get lost and you will not have a way to recover them. So it is recommended to enable termination protection on your cluster and also use Amazon S3 as a persistent data store instead of instance EBS volumes as an HDFS store.
Termination protection, auto-termination, and step execution
When you have enabled both termination protection and auto-terminate settings with step execution, then auto-termination takes precedence, which terminates the cluster after finishing all step execution.
When you define steps on your cluster, you do have the option to configure what action should be taken when a step fails. You can set the ActionOnFailure property value to define the action on step failure, which has values of CONTINUE, CANCEL_AND_WAIT, and TERMINATE_CLUSTER.
If auto-termination is enabled and ActionOnFailure is set to CANCEL_AND_WAIT, then the cluster gets terminated without executing any other subsequent steps.
If ActionOnFailure is set to TERMINATE_CLUSTER, then the cluster terminates in all cases except when auto-termination is disabled and termination protection is enabled.
Configuring termination protection while launching your cluster
You can enable termination protection while creating your cluster using the AWS console, the AWS CLI, or using the EMR API. Termination protection is disabled by default in all the approaches except when you create a cluster using the AWS console's advanced options.
Now let's learn how you can configure termination protection for your cluster while creating it through the AWS CLI or AWS console:
- Using the AWS Console: When you create a cluster using advanced options, go to General Cluster Settings under General Options and select the Termination protection option to enable it or uncheck it to disable it. The following screenshot represents the option in the AWS console.

Figure 5.13 – Termination protection configuration with EMR advanced cluster create options
- Using the AWS CLI: When creating a cluster with the AWS CLI commands, you can enable termination protection on your cluster using the --termination-protected parameter. The following is a sample AWS CLI command that includes termination-protected configuration:
aws emr create-cluster --name "EMR Cluster" --release-label emr-6.3.0 --applications Name=Hive Name=Spark --use-default-roles --ec2-attributes KeyName=myKey --steps Type=HIVE,Name="Hive Program", ActionOnFailure=CONTINUE, Args=[-f,s3://<mybucket>/scripts/query.hql,-p,INPUT=s3://<mybucket>/inputdata/,-p,OUTPUT=s3://<mybucket>/outputdata/,$INPUT=s3://<mybucket>/inputdata/,$OUTPUT=s3://<mybucket>/outputdata/] --instance-type m5.xlarge --instance-count 4 --termination-protected
Now let's learn about termination protection.
Configuring termination protection for a running cluster
In the previous section, you learned how you can configure termination protection while launching or creating a cluster, but you also have the option to change the settings for an already running cluster.
You can change the setting through both the AWS console and the AWS CLI:
- Using the AWS console: To change the termination protection configuration for a running cluster, you can navigate to the EMR console, select the cluster for which you plan to change the configuration, and then on the Summary tab, for Termination protection, choose Change, which will provide the following options:

Figure 5.14 – Change the Termination protection configuration
Select On or Off and select the green check mark to confirm it.
- Using the AWS CLI: To change the termination protection configuration for a running cluster using the AWS CLI, leverage the modify-cluster-attributes EMR CLI command with the —termination-protected or —no-termination-protected parameters. The following is a sample AWS CLI command to enable termination protection for a running cluster:
aws emr modify-cluster-attributes --cluster-id <cluster-id> --termination-protected
The following is a sample AWS CLI command to disable termination protection for a cluster if it is already enabled:
aws emr modify-cluster-attributes --cluster-id <cluster-id> --no-termination-protected
Before executing the preceding commands, please replace <cluster-id> with your EMR cluster ID.
In this section, you have learned about an EMR cluster's default AMI and how you can configure a custom AMI. You have also learned about the cluster termination process.
In the next section, you will get an overview of how you can troubleshoot your cluster failures and what logging options you have that can help troubleshoot your cluster.
Troubleshooting and logging in your EMR cluster
An Amazon EMR cluster has several components, such as open source software, custom application code, and AWS integrations, which can contribute to cluster failures or can take longer than expected to complete defined jobs. In this section, you will learn how you can troubleshoot these failures and what fixes can be applied.
When you are starting to implement big data applications in an EMR cluster, it's recommended to enable debugging on the cluster and also take a step-by-step approach to test your application with a smaller subset of data, which might help in debugging failures.
Let's dive deep into a few troubleshooting aspects that can help.
Tools available to debug your EMR cluster
We can divide the set of tools available for troubleshooting into the following three categories:
- Tools that display cluster details
- Tools to view cluster or application logs
- Tools that can be used to monitor cluster performance
Now let's dive deep into each of these sections.
Tools that display cluster details
You can leverage the AWS EMR console, AWS CLI commands, or EMR APIs to get cluster details or any specific job details:
- Using the AWS console: On the EMR console, you can see a list of active or terminated clusters that you have launched in the past 2 months. You can select the cluster name for which you would like to get more details and the cluster detail screen provides information with a multiple-tab structure that includes a summary, application user interfaces, monitoring, hardware, and more.
The Application user interface tab of the console provides more details about YARN or other applications' status, such as Spark, where you can drill down to find different metrics, job stages, and executors assigned to them. This interface is available for EMR clusters with a release version of 5.8.0 or more.
- Using the AWS CLI: You can get cluster details using the AWS CLI command by passing the —describe parameter.
- Using the EMR API: You can leverage DescribeJobFlows of the EMR API to get details about a specific cluster.
Having learned how you can find cluster details; next we will look at what tools we have to view log files.
Tools to view log files
Both Amazon EMR and big data applications on the cluster generated different log files and you can access these log files which depends on the configuration that you specified while creating the cluster.
The following are some of the ways you can access logs:
- Log files on the cluster master node: Every cluster publishes its logs to the /mnt/var/log/ path of the master node, which is accessible till the time the cluster is active.
- Log files archived in Amazon S3: While launching the cluster, if you have specified an Amazon S3 path, then EMR copies the master node logs available in /mnt/var/log/ to S3 every 5 minutes. This helps you persist the log files, which you can access after the cluster is terminated too. As the log files are copied every 5 minutes, a few last-minute logs might not be available when the cluster is being terminated.
Having understood how you can access the log files of your cluster, in the next section, you will learn how you can monitor your cluster's performance.
Introducing tools to monitor cluster performance
To monitor your cluster usage and performance, you have primarily two options. One is Hadoop application web interfaces that you can access to monitor respective big data applications and the other is Amazon CloudWatch, which can be used for centralized logging too:
- Hadoop application web interfaces: Depending on the big data applications you have configured on your cluster; you can access web interfaces available for them using an SSH tunnel through the cluster master node. You can learn about this a bit more in the next chapter.
- Amazon CloudWatch metrics: EMR clusters publish various metrics to CloudWatch, which you can use for monitoring or defining alarms with CloudWatch rules.
In this section, you have learned about different tools available in your EMR cluster for viewing cluster details, accessing logs, and monitoring applications. In the next section, you will learn how you can view and restart different EMR applications.
Viewing and restarting cluster application processes
While troubleshooting or monitoring your cluster, you might be interested to list the application processes running in your cluster and for any configuration changes, you might need to restart them.
There are two types of processes that run on a cluster. One is EMR processes, which can be instance-controller or LogPusher, and the other is related to your Hadoop application-related processes, for example, Hadoop-yarn-resourcemanager or Hadoop-hdfs-namenode.
Now let's get an overview of how you can view or restart these application processes.
Viewing running processes of your cluster
To view the list of Amazon EMR processes, you can execute the following command on your cluster master node's Linux prompt:
ls /etc/init.d/
This command will provide output as follows:
acpid cloud-init-local instance-controller ntpd
To view the list of processes related to the application released, you can execute the following command on your master node's Linux prompt:
ls /etc/init/
This command will provide output as follows:
control-alt-delete.conf hadoop-yarn-resourcemanager.conf hive-metastore.conf
In this section, you have learned about identifying running processes and in the next section, you will learn how you can restart them.
Restarting processes
After you identify the processes running, you might need to stop, start, or restart them. Depending on whether it's an Amazon EMR process or Hadoop application process, you will have a different command to restart the processes.
To stop, start, or restart Amazon EMR processes, you can execute the following commands:
sudo /sbin/stop <process-name>
sudo /sbin/start <process-name>
To restart the processes related to EMR application releases, you can execute the following commands:
sudo /etc/init.d/<process-name> stop
sudo /etc/init.d/<process-name> start
Please replace <process-name> in the preceding commands with the actual process you plan to stop and start.
Troubleshooting a failed cluster
This section will explain how you can troubleshoot a cluster that has failed, which means it is terminated with an error code. It will cover the following steps:
- Step 1: Collecting data about the issue
- Step 2: Checking the environment
- Step 3: Checking the last state change
- Step 4: Looking at the log files
- Step 5: Testing the cluster step by step
Now let's dive deep into each of these steps.
Step 1: Collecting data about the issue
As a first step, you need to gather information about your cluster that includes collecting details on the issue, cluster configuration, and status.
- Define the problem: When you start investigating the issue, you can collect details by asking a few high-level questions such as What was expected to happen and what really happened? When was the first occurrence of the issue? How frequently or how many times has the issue occurred? Did we change anything in the cluster configuration that was not planned for? And so on. The answers to these questions will provide a great starting point to troubleshoot the issue.
- Collect cluster details: Collect your cluster details, which include the cluster identifier, the AWS region, availability zones, the number of masters, core and task nodes, types of EC2 instances, and whether you configured an instance group or instance fleet, which might help in identifying whether there are limitations around the maximum number of instances you can provision.
After you have collected these basic details, next you can check the environment.
Step 2: Checking the environment
As the next step, you can check for any service outages or usage limits that caused the failure, or the issue could be specific to your EMR release version or related to networking configurations:
- Check for service outage: When you create a cluster, under the hood, EMR uses several AWS services, including Amazon EC2 instances for cluster nodes, Amazon S3 to store logs or cluster data, CloudWatch for log monitoring, and many more. The failure could be related to any of these services, so checking the status of the services will help, which is accessible through https://status.aws.amazon.com/.
- Check usage limits: Every AWS service has a default quota limit set, which can be increased upon request. When you are creating a cluster, it might hit any specific service limits, which could be the number of Amazon EC2 instances launched in your region or it could be the number of S3 buckets you can create. You can check for the error message; for example, if you are hitting the EC2 quota limit for your account, then you might get an EC2 QUOTA EXCEEDED error.
- Check the EMR release version: Check the EMR release you selected while launching the cluster. As the cluster includes several pieces of open source software, the issue you are facing might have been fixed in the latest EMR releases. In those cases, you can re-launch your cluster with the latest EMR release.
- Check the cluster VPC and subnet configuration: Please check if you have configured your VPC or subnet settings as described in the AWS documentation and also make sure that your subnet has enough IP addresses to assign to cluster nodes.
As the next step, we can look at the latest state change of your cluster.
Step 3: Checking the last state change
Look at your cluster's last state change, which might provide information about what happened when it changed status to FAILED. For example, when you launch a cluster with a Spark Streaming step and your output S3 path already exists, then you get the error Streaming output directory already exists.
You can get the last state change with the AWS CLI describe-cluster and list-steps commands, or with the EMR API's DescribeCluster and ListSteps actions.
As the next step, we can look at the log files for further debugging.
Step 4: Looking at the log files
The next step is to examine the logs being generated by your cluster, which can be instance syslogs or different Hadoop application logs. If the initial task attempt does not complete on time, EMR might terminate it and create a duplicate task attempt, which is called a speculative task. This activity will generate a significant amount of logs, which get logged into stderr or syslog of the instances.
For your debugging, you can start checking bootstrap action logs for any unexpected configuration changes or for any errors. Then you can look at each step log to identify whether there were any errors in any step that caused the failure. You can also look into Hadoop job logs to discover failed task attempts.
Now let's get an overview of each of these log types:
- Check bootstrap action logs: Bootstrap actions are intended to run startup scripts on your cluster as it is launched. Their primary purpose is to install additional software libraries or customize default configurations. There is a chance that these bootstrap scripts created the failure or affected the cluster's performance, so checking its logs will provide additional insights.
- Check your cluster step logs: There are four types of logs generated from each step of the cluster: controller, stderr, stdout, and syslogs.
controller logs contain errors generated by Amazon EMR while trying to execute your step. Errors generated from accessing your application steps or loading are often included here. syslog primarily includes non-Amazon software logs, which might point to open source Apache Hadoop or Spark streaming errors.
stdout logs include the status of mapper and reducer task executables. Often, application loading errors are included here and sometimes contain application error messages too. stderr includes error messages that are generated while processing your defined steps. This log sometimes may contain stack traces or application loading errors.
For any obvious errors, stderr logs are very helpful. They could provide a list of errors if the step got terminated quickly by throwing errors that might be related to mapper or reducer applications running on the cluster.
You can also check the last few lines of your controller or syslog as that might include notices of failures or errors related to failed tasks, if it says Job Failed.
- Check task attempt logs: If you notice one or more failed tasks from your previous analysis, then analyzing the task attempt logs might provide more insights too.
After analyzing all the logs, you should plan for step-by-step testing of your cluster, which might help debug the issue.
Step 5: Testing the cluster step by step
Restarting your cluster without any steps and adding steps one by one to debug is a great technique that might help too. This way, you can see the failures of any step and you can try to fix and rerun to validate.
The following is an approach you can follow for your step-by-step execution:
- Launch a new cluster with the previous configuration and two additional configurations (if not enabled earlier), that is, to keep the termination protection and keep alive enabled. This will help follow a step-by-step approach and prevent creating a new cluster every time.
- Once your cluster is in the WAITING state, you can submit your steps one by one.
- When your step completes processing, look for errors in that specific step's log files. You can connect to the master node with SSH to view the logs. Please note, step log files takes some time to appear.
- If the step succeeded without any errors, then you can run the next step. If not, then analyze the logs to find the error. If it is an application code error, then apply the necessary fix and rerun this step.
- Once your debugging steps are done, you can disable the termination protection and then terminate the cluster.
In this section, we have provided a few steps using which you can troubleshoot a failed cluster. Next, we'll see how you can troubleshoot a cluster that is running slowly.
Troubleshooting a slow cluster
This section will explain how you can troubleshoot a cluster that is in the running state but takes longer than expected to return results. Most of the time, it might be caused by resource constraints for your job and might get resolved by assigning more resources, either by moving to high instance types or by increasing the number of instances.
Apart from resource constraints, there might be other reasons that are making your jobs run slowly and the following steps might help in identifying them:
- Step 1: Collecting data about the issue
- Step 2: Checking the environment
- Step 3: Looking at the log files
- Step 4: Checking your cluster and instance health
- Step 5: Looking for suspended instance groups
- Step 6: Reviewing cluster configuration settings
- Step 7: Validating your input data
Now let's dive deep into each of these steps.
Step 1: Collecting data about the issue
Similar to the failed cluster scenario, step 1 should be asking high-level questions about expectation versus reality, configuration changes, and the frequency of errors, and then collecting cluster details including availability zones, region, VPC, subnets, EC2 instance type configurations, and more.
Step 2: Checking the environment
Checking the environment step is also the same as in the failed cluster scenario, where you check for any service outages, usage limits, and networking configurations that might affect the cluster's expected behavior.
Sometimes environment issues might be transient and restarting the cluster might help in improving the performance.
Step 3: Looking at the log files
As explained for the failed cluster scenario, looking at bootstrap action logs, step logs, and task attempt logs provides a great level of detail about the failure of a step or slow-running jobs.
In addition, checking the Hadoop daemon logs also helps us, which are available in var/log/Hadoop of each node. You can also look for failed task nodes or instances from the JobTracker logs and then connect to that instance to find any instance-specific issues related to CPU or memory usage.
Step 4: Checking your cluster and instance health
As you learned earlier, your EMR cluster consists of three types of nodes that include master nodes, core nodes, and task nodes. Each of these node types might contribute to slow-running jobs as they go through resource constraints such as CPU and memory or experience network connectivity issues.
When you are looking at your cluster health, you should look at both cluster- and individual instance-level health. There are several tools that you can use for monitoring health and the following are some of the commonly used methods:
- Check for service outage: EMR clusters push different metrics to Amazon CloudWatch, including the performance of the cluster, HDFS utilization, total load, running or remaining tasks, and more. You can leverage these metrics to get an overall picture of your cluster and jobs and also can define alarms to get notified if any metrics go beyond a threshold.
- Check job status and HDFS health: On the EMR console, on the Application user interfaces tab, you can look at YARN application details and can drill down to logs for checking the status of jobs.
A few Hadoop or big data applications have web user interfaces for monitoring tasks such as JobTracker, HDFS NameNode, TaskTracker, or Spark HistoryServer that you can leverage to identify the amount of resources being consumed by each task or Spark executor, which node they are running, and whether there are resource constraints that you should be working to resolve.
- Check EC2 instance health: You should also look at individual EC2 instance health in the EC2 console and can also define CloudWatch alarms for monitoring and notifications.
After looking at these, next, you should look at your instance groups if they are in the suspended state.
Step 5: Looking for suspended instance groups
As discussed earlier, you can define instance groups while configuring your cluster and there is a chance the instance group itself might go into the SUSPENDED state if it continues to fail new nodes or check in with existing nodes.
The launch of a new instance or node might fail if Hadoop or related services are broken in some way and do not accept new nodes, or there is a bootstrap script configured for new nodes that fails to complete, or the node itself is not working as expected and is not able to check in with Hadoop. If the issue persists for some time, instead of provisioning new nodes, the instance group goes into the SUSPENDED state.
If the instance group goes into the SUSPENDED state and the cluster is in the WAITING state, then you can add a cluster step to reset the required number of core or task nodes, which might resume the instance group back to the RUNNING state.
Step 6: Reviewing cluster configuration settings
When you launch a cluster, Amazon EMR uses default Hadoop configurations, which you can override using bootstrap actions. These configuration parameters are used to execute your jobs and the job log data is stored in a file called job_<job-id>_conf.xml, which is stored in the /mnt/var/log/hadoop/history/ directory of the cluster's master node.
You can review jobs and override the default configuration parameters as needed to improve your job's performance.
Step 7: Validating your input data
One other thing you can check is your input data quality and distribution across nodes or executors. There is a chance that your data is not evenly distributed, which means a single node or Spark executor might be overloaded with a big chunk of your data. This uneven distribution of data is represented as data skewness, which results in one node or Spark executor getting stuck for a long period of time as it needs to process most of the data.
You can also look at data quality as corrupted data might be making your jobs fail if your application logic does not handle it well.
In this section, you have learned how you can debug or troubleshoot a slow-running cluster and in the next section, you will learn about logging in your EMR cluster that includes the different default log files available and how you can archive or aggregate them in Amazon S3.
Logging in your EMR cluster
In the previous section, we explained how you can leverage log files available in your cluster to debug a cluster failure or slow-running jobs. In this section, we will dive a bit more deeply into logging to explain what different log files are available in each path of the cluster and how you can integrate log archiving with Amazon S3.
Default log files available in EMR
By default, EMR clusters are configured to write log files to the /mnt/var/log directory of the master node, and to access them you can SSH to the master node. These log files are available till the time the master node is in the running state and if it terminates for any reason, then you lose access to these log files, so it's always a great idea to archive log files to Amazon S3 for persistence.
The following are the different types of log files generated by your cluster:
- Step logs: These logs include the result of each step and are stored in the /mnt/var/log/hadoop/steps/ directory of the master node. Each step's log files are separated by a subdirectory that has a 13-character step identifier and includes an incremental number at the end to represent each step. For example, for step 1, the subdirectory path will be /mnt/var/log/hadoop/steps/s-<stepId>1/ and stepId will be unique for the cluster.
- Hadoop and YARN component logs: These logs include different Hadoop and YARN component logs, which are available as subdirectories under /mnt/var/log. A few subdirectory examples include hadoop-mapreduce, hadoop-yarn, hadoop-hdfs, and hadoop-httpfs. There is an additional hadoop-state-pusher subdirectory, which stores the output of the Hadoop state pusher process.
- Bootstrap action logs: If you have configured bootstrap actions for your cluster, then its logs are stored under the /mnt/var/log/bootstrap-actions/ directory of the master node. Each bootstrap action stores its log output in a separate subdirectory, which is an incremental number. For example, the first bootstrap action will have the path /mnt/var/log/bootstrap-actions/1/.
- Instance state logs: These logs provide EC2 instance-specific information that includes CPU, memory, and garbage collector threads of the cluster node and are stored in the /mnt/var/log/instance-state/ directory of the master node.
As you have learned, all these logs are configured to store output in the cluster's master node by default. In the next section, let's understand how you can configure these logs to be archived to Amazon S3 for persistence.
Archiving log files to Amazon S3
While launching your cluster, you can define configuration to archive your master node logs to Amazon S3. By default, clusters launched using the EMR console have this setting enabled but clusters launched using the AWS CLI or the EMR API need to have it enabled. These logs are pushed to Amazon S3 every 5 minutes and there is a chance the last 5 minutes of log data will not be pushed to Amazon S3 when the cluster gets terminated.
Let's look at a few options to configure Amazon S3 log archival or aggregation.
- Archive logs to Amazon S3 using the AWS Console: When you launch a cluster with the EMR console, logging is enabled by default for both quick create and advanced options with a default Amazon S3 log path that you can change. But for the advanced options, you get an additional configuration to enable encryption for your log files, where you can specify the ARN of your AWS KMS key. This encryption option is available for clusters using EMR 5.30.0.
- Archive logs to Amazon S3 using the AWS CLI: To archive logs to Amazon S3, you can specify the --log-uri parameter while launching the cluster using the AWS CLI. The following is a sample command using the AWS CLI that specifies the Amazon S3 path through the --log-uri parameter:
aws emr create-cluster --name "Archive cluster log" --release-label emr-6.3.0 --log-uri s3://<mybucket>/logs/ --applications Name=Hadoop Name=Hive Name=Spark --use-default-roles --ec2-attributes KeyName=<myEC2KeyPair> --instance-type m5.2xlarge --instance-count 3
This helps to archive logs into Amazon S3, but if you plan to aggregate a single application log to a single file, then you can look at the following configuration to aggregate logs.
Aggregating logs in Amazon S3 using the AWS CLI
When an application runs on the cluster, it gets executed as distributed tasks running in different cluster nodes where each node container generates its own log for that application. If you plan to aggregate these container logs to a single file, then while launching the cluster, you can specify additional configuration through bootstrap actions. This feature is available in EMR starting from EMR 4.3.0.
Let's assume we have saved this JSON configuration file as s3-log-aggregation-config.json:
[
{
"Classification": "yarn-site",
"Properties": {
"yarn.log-aggregation-enable": "true",
"yarn.log-aggregation.retain-seconds": "-1",
"yarn.nodemanager.remote-app-log-dir": "s3://<my-log-bucket>/logs"
}
}
]
Please replace <my-log-bucket> with your bucket name and then pass this configuration file while creating the cluster using the AWS CLI:
aws emr create-cluster --name "EMR Log Aggregation cluster" --release-label emr-6.3.0 --applications Name=Hadoop --use-default-roles --ec2-attributes KeyName=<myEC2KeyPairName> --instance-type m5.xlarge --instance-count 3 --configurations file://./s3-log-aggregation-config.json
Please replace <myEC2KeyPairName> with your EC2 key pair name.
Enabling the debugging tool
This additional debugging tool allows you to browse log files more easily from the EMR console. Enabling this option is available both from the EMR console's advanced cluster create option or through the AWS CLI. You need to enable logging to use this debugging tool.
When you enable debugging on your cluster, EMR archives the log files to S3 and indexes those files for easier access.
In the EMR console, when you choose the advanced cluster create option, you can find this option in the General cluster settings section's General Options configuration parameters. If you are using the AWS CLI to create the cluster, you should specify --enable-debugging with the --log-uri parameter.
Summary
Over the course of this chapter, we have got an overview of how you can create an EMR cluster using both the AWS console's quick and advanced creation options with different configuration options. We have also provided an overview of how you can integrate custom AMIs for your cluster and how termination protection can help for transient cluster use cases.
Finally, we covered the different logging and troubleshooting options you have to debug your cluster or job failures.
That concludes this chapter! Hopefully, you have got a good overview of setting up an EMR cluster with its different configurations and in the next chapter, we can dive deep into different monitoring, scaling, and high availability concepts.
Test your knowledge
Before moving on to the next chapter, test your knowledge with the following questions:
- Assume on top of default EMR configurations, you need to install a few additional libraries and, post-installation, execute a few scripts. This process will be repeated every time a new instance is added to the cluster. How will you implement this while launching your cluster?
- You have a running EMR cluster, where you have one Hive and one Spark job configured to be executed in a sequence as EMR steps. You have noticed that step 2, which is a Spark job, is failing. With further analysis, you have identified that all tasks of that Spark job are completed but one task is running for a long period of time, which makes the whole process slow. How will you resolve this problem?
- Your organization has compliance policies that say all the application logs need to be persistent at least for a year. You are going to integrate EMR for one of your transient cluster use cases that will do batch ETL operations. To be compliant with your organization's policy, how should you configure your EMR cluster?
Further reading
Here are a few resources you can refer to for further reading:
- Learn more about tagging a cluster: https://docs.aws.amazon.com/emr/latest/ManagementGuide/emr-plan-tags.html
- Learn more about the networking of a cluster: https://docs.aws.amazon.com/emr/latest/ManagementGuide/emr-plan-vpc-subnet.html
- Common errors in EMR: https://docs.aws.amazon.com/emr/latest/ManagementGuide/emr-troubleshoot-errors.html